 Open Access Article
Boosting the catalytic performance of metal–zeolite catalysts in the hydrocracking of polyolefin wastes by optimizing the nanoscale proximity†
Xinlei
Han
 a,
Xinru
Zhou
 a,
Tuo
Ji
a,
Feng
Zeng
a,
Tuo
Ji
a,
Feng
Zeng
 a,
Weiping
Deng
 b,
Zhenchen
Tang
 *a and
Rizhi
Chen
 a
a
aState Key Laboratory of Materials-Oriented Chemical Engineering, College of Chemical Engineering, Nanjing Tech University, Nanjing 211816, Jiangsu, China. E-mail: z.tang@njtech.edu.cn
bState Key Laboratory of Physical Chemistry of Solid Surfaces, College of Chemistry and Chemical Engineering, Xiamen University, Xiamen 361005, Fujian, China
First published on 9th October 2023
Abstract
Hydrocracking polyolefins using bifunctional metal–zeolite catalysts is a pivotal strategy for the catalytic upcycling of plastic waste to produce value-added fuels. However, the macro-molecular size and stable C–C bond of polyolefins impose major challenges on catalyst design based on noble metal and microporous zeolites. The lack of investigation into the nanoscale proximity between Pt and USY has hindered the development of an evolving generation of catalysts. Herein, we report Pt/USY prepared by colloid-immobilization method with Pt nanoparticles exclusively located on the surface of USY is a superior catalyst (>50% higher activity) compared to its analogues that have Pt inside or away from USY crystalline, reaching a selectivity to gasoline (C5–12) over 90%. The formation rate of liquid products reaches 6122 gliquid gPt−1 h−1 and 5048 gliquid gPt−1 h−1 in hydrocracking polyethylene (PE) and polypropylene (PP) at 280 °C, respectively. The hydrocracking of model alkanes with different molecular sizes demonstrates the nanoscale Pt-USY proximity as a key criterion in optimizing the accessibility and acidic environment of Pt, and the diffusion distance between metal and acid sites. These findings comprise a significant step forward toward rational catalyst design aiming at upcycling plastic waste for sustainable fuel production.
Broader contextPlastic wastes impose major threats on our environment and ecosystems. The petro-origin of polyolefin wastes makes them potential feedstocks for fuel production, while the chemically inert and macromolecular nature renders them very challenging to degrade and recycle. The hydrocracking of polyolefins using bifunctional metal–zeolite catalysts is an appealing process that breaks the backbones of polyolefin to generate fuels, such as gasoline. Platinum is often used as the active metal; however, the increasing demand and cost of Pt in the industry drives the more efficient use of Pt in catalysis. This study significantly outperforms the previous reports in terms of Pt utilization for liquid fuel production, reaching 6122 gliquid gPt−1 h−1 and 5048 gliquid gPt−1 h−1 in the hydrocracking of polyethylene (PE) and polypropylene (PP) at 280 °C, respectively. The critical technique is to load Pt nanoparticles exclusively on the outer surface of zeolite USY via the colloid-immobilization method, which maximizes the utilization of Pt and constructs a consecutive cracking process from the outer surface of zeolite to the inner pore networks. Tuning the nanoscale metal–zeolite proximity introduces a rational design of highly active catalysts in the hydrocracking of macromolecular polyolefins that accelerates the upcycling of plastic wastes to value-added fuels and chemicals on a practical scale. |
Introduction
Plastics have ubiquitous use in human society, with over 3.6 billion metric tons are produced worldwide every year.1–3 More than half of its production are polyolefins (polyethylene, PE; polypropylene, PP, and polystyrene, PS), which have a chemically stable nature that makes them durable in their functional lifetime but difficult to degrade and recycle at the end of life.1,4–6 The majority of plastic products have a rather short lifetime and end up in landfill or incineration that leads to substantial environmental pollution.4,7 The chemical upcycling of plastic waste to value-added products is an appealing solution towards the sustainable lifecycle of plastics, while conventional mechanical recycling generates products with compromised chemical and physical properties.8,9The hydrocracking of polyolefins is one promising technique for the catalytic upcycling of plastic waste that produces hydrocarbons with high octane numbers ranging from gasoline to jet fuels.6,10,11 The typical hydrocracking of the C–C bond in hydrocarbons, PE, and PP requires metallic and acidic sites, and involves three sequential steps: (1) the dehydrogenation of alkanes on metallic sites; (2) isomerization/cracking of the as-formed alkenes on acidic sites; and (3) hydrogenation of cracked alkenes on metallic sites.12,13 Only a limited number of catalytic systems have been investigated in the hydrocracking of polyolefins. Pt/WO3/ZrO2 mixed with FAU-type zeolites were employed as bifunctional catalysts at mild conditions, that generated a mixture of fuels with a maximum yield of liquid at 85%.11 Supported Ni, Co, and Pt catalysts with acidic zeolites were found to be active for the hydrocracking of PE and PP at temperatures higher than 330 °C, but generated large amounts of undesired gas-range products.14–16 Pt-USY (USY, ultra-stable Y, hydrothermally treated Y zeolite) based bifunctional catalytic systems have been widely investigated for the conversion of hydrocarbons and plastics.12,13,17 The excellent activity of Pt for (de)hydrogenation, and the acid properties and hierarchical pore structure of USY make their combination a suitable choice for the hydrocracking of polyolefins.18,19 Beyond the individual metal or acid properties, their mutual spatial distance at the nanoscale has been largely neglected, which was recently found as a critical factor in the hydro-conversion of short alkanes (C7, C10, and C19).13,20,21 A much higher selectivity to the undesired over-cracked gaseous products was observed when the Pt nanoparticles (NPs) were within the zeolites rather than on the alumina binder or the zeolite surfaces.
Different from short-chain alkane molecules that could readily diffuse in the USY, it is challenging for the macromolecular polymer to access the Pt sites inside micropores to initiate the hydrocracking reaction.22,23 Therefore, optimizing the metal-acid proximity in the bifunctional Pt/USY catalyst is critical to enhance the accessibility of Pt sites and product selectivity when converting the macromolecular polyolefins. Nevertheless, since the pore diameter of USY (12-member ring, 7.4 Å) is much larger than the size of Pt precursors (e.g., Pt(NH3)42+, PtCl62−), the conventional incipient-wet-impregnation (IWI) or ion-exchange (IE) methods to load Pt on USY only generate Pt NPs mostly inside the pore networks, and thus would probably deteriorate the accessibility of Pt and the selectivity to liquid products.20,21,24
Herein, we report a Pt/USY catalyst, which has Pt NPs exclusively located on the USY surface, that shows superior catalytic performance compared to its analogues in the hydrocracking of polyolefins under mild conditions. The intimacy of Pt and the acidic sites at the nanoscale was precisely controlled by adopting different preparation methods that allowed for Pt NPs inside the USY, on the surface of USY, and have a distance from USY. The colloid-immobilization (CI) method, which generates the Pt NPs (∼3.2 nm) colloid in the aqueous solution, was introduced for the first time to prepare Pt/USY catalysts that would prevent Pt species from entering the pores of USY and immobilize Pt NPs on its surface alone.25,26 This catalyst exhibited the best catalytic activity and selectivity to gasoline ranged fuels (C5–12), owing to its outstanding accessibility of Pt NPs and critical metal-acid proximity. The formation rate of liquid products reached 6122 gliquid gPt−1 h−1 at 280 °C with over 90% selectivity to C5–12 highly branched hydrocarbons. Tuning the nanoscale proximity of the metallic and acidic sites in a bifunctional Pt/USY catalyst not only boosts its performance in the hydrocracking of polyolefins, but also demonstrates the key criterion of creating the accessibility of active sites in the upcycling of macromolecular plastic waste.
Results and discussion
Preparation of catalysts with different Pt-USY proximity
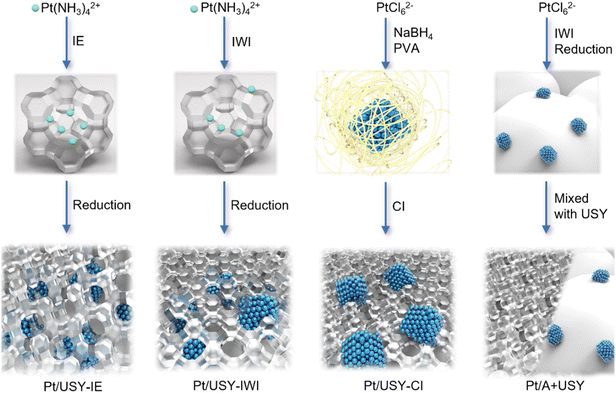
Four different methods were adopted to prepare Pt-USY catalytic systems with a range of metal-acid proximity, from closest to surface-contacted, and to nano-/micro-scale, as illustrated in Scheme 1. The IE method that exchanges the Pt(NH3)42+ ion (∼0.54 nm) with acidic sites inside the zeolite networks solely generated Pt NPs inside the USY after calcination and subsequent reduction at 300 °C in H2/N2 flow.13,19 The widely-used IWI method loaded a majority of the Pt(NH3)42+ ion inside the pore of the zeolite, and only a small fraction was located on the USY surface. After reduction, the Pt ions became localized Pt NPs, i.e., mostly inside the USY pores.24 The CI method first formed the Pt NPs colloid in a solution that was then immobilized by USY. This method would exclusively have the Pt NPs located on the USY surface because the Pt NPs (∼3 nm) cannot enter the pore opening of USY (0.74 nm).25,26 The metal-acid spatial distance was further extended to the nano-/micro-meter scale by physically mixing 1Pt/A (1Pt/γ-Al2O3, designated as 1Pt/A), with USY powders having the same mass of Pt and USY.Determination of the Pt-USY proximity
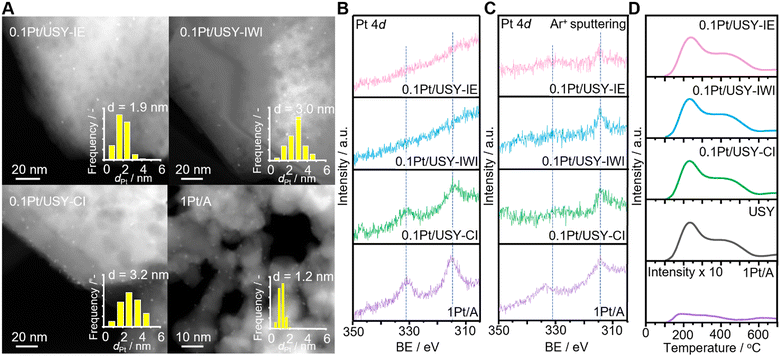
0.1Pt/USY samples prepared by IE, IWI and CI with nominal Pt loading at 0.1 wt% were analyzed by inductively coupled plasma (ICP), which showed the comparable actual Pt loading of 0.10, 0.11 and 0.096 wt%, respectively (Table 1 and Table S1, ESI†). Pt supported on alumina (1Pt/A) exhibited a Pt loading at 0.81 wt%. High-angle annular dark-field scanning transmission electron microscopy (HAADF-STEM) showed that the Pt NPs loaded directly on USY have comparable mean-sizes at 1.9, 3.0 and 3.2 nm for 0.1Pt/USY-IE, -IWI and -CI, respectively, while 1Pt/A showed a much smaller size at 1.2 nm (Fig. 1A). The smaller size of Pt in 1Pt/A compared to the 0.1Pt/USY catalysts is probably due the stronger metal-support interaction between Pt and γ-Al2O3. The 0.1Pt/USY catalysts synthesized by IE and IWI have the Pt NPs evenly distributed in the USY crystalline structure, while the 0.1Pt/USY-CI catalysts have Pt NPs located mainly on the USY edge (space compressed in the Z axis in a 2D STEM image). It has been demonstrated (e.g., by HR-TEM with 3D reconstruction) that the formation and growth of Pt particles inside the zeolite crystal was able to break the neighboring micropores or supercages, and generate Pt NPs (3–4 nm) that are much larger than the original size of the pore or supercages.24 Thus, it confirms that the 0.1Pt/USY prepared by IE and IWI have Pt NPs predominantly within the zeolite pores, while the one prepared by CI has Pt NPs on the USY surface. The specific proximity between the Pt NPs and USY was further confirmed by X-ray photoelectron spectroscopy (XPS, Fig. 1B). The 1Pt/A shows a typical metallic Pt0 signal at 314.5 eV (Pt 4d5/2).20,27 As the Pt NPs are located on the surface of USY, 0.1Pt/USY-CI also exhibits a clear Pt0 signal even with the very low Pt loading at 0.1 wt%. However, there is no observable signal of Pt loaded by IE and IWI even though both samples have comparable Pt loading with 0.1Pt/USY-CI. This is attributed to the surface-sensitive nature of the XPS method (detectable depth is about 5 nm) and the location of the Pt NPs is inside the zeolite crystalline structure (Fig. 1A). These samples were further measured by destructive elemental depth profile XPS (DPXPS) using an Ar ion sputtering method that could remove the top layer of these samples (Fig. 1C).28,29 After exposure in an Ar ion beam for 200 s (ca. 40 nm top layer was removed), the Pt 4d5/2 signal at 314.5 eV emerged in samples 0.1Pt/USY-IE and 0.1Pt/USY-IWI, which indicated that the Pt NPs inside the USY pores were exposed after removing the USY layer. Meanwhile, the signal of Pt in 0.1Pt/USY-CI and 1Pt/A exhibited significantly lower intensity. This is due to the Pt NPs on the surface being partially removed during the Ar ion sputtering process. The results of XPS and DPXPS further confirm the successful control of the Pt-USY proximity at the nanoscale.| Catalyst | Pt loadinga/wt% | Surface areab/m2 g−1 | Pore volumec/cm3 g−1 | Si/Al |
|---|---|---|---|---|
| a The Pt loading was determined by ICP-OES. b The surface area was determined by N2-physisorption using BET method. c The pore volume was determined by N2-physisorption using BJH adsorption method. | ||||
| 0.1Pt/USY-IE | 0.10 | 594 | 0.18 | 22 |
| 0.1Pt/USY-IWI | 0.11 | 589 | 0.20 | 22 |
| 0.1Pt/USY-CI | 0.096 | 578 | 0.21 | 22 |
| 1Pt/A | 0.81 | 91 | 0.57 | n.a. |
| USY | n.a. | 599 | 0.19 | 22 |
Characterizations of the textual, crystallinity, and acidity properties
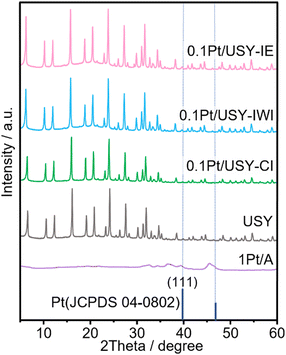
To rule out the influence of USY on the effects of the Pt-USY proximity, the same USY (Si/Al = 22, SBET = 599 m2 g−1) was used as the support for Pt as well as the acid component. It was determined that the 0.1Pt/USY catalysts prepared by IE, IWI, and CI share similar textural properties with pristine USY, as the specific surface area and pore volume ranged from 578 to 599 m2 g−1 and from 0.18 to 0.21 cm3 g−1, respectively (Table 1 and Table S1, ESI†). Except for the micropores, the USY has a large amount of mesopores ranging from 5 to 60 nm, with a center at 30 nm (Fig. S1, ESI†). The 1Pt/A sample has a smaller surface area than USY at 91 m2 g−1, but a much larger pore volume at 0.57 cm3 g−1. Moreover, after loading Pt with different methods, these catalysts exhibited a similar XRD pattern with pristine USY, indicating that the crystallinity of USY was well preserved (Fig. 2). 1Pt/A is mainly amorphous with some weak peaks at 36.50, 39.51 and 45.64 degrees that is ascribed to the γ-phase Al2O3. There was no peak assigned to Pt observed in all 0.1Pt/USY and 1Pt/A, suggesting that the small Pt NPs were well dispersed in these samples.19 The acid properties of these catalysts were examined by ammonia temperature-programed desorption (NH3-TPD). It was found that the 0.1Pt/USY catalysts prepared by IE, IWI, and CI present almost the same profile with pristine USY (Fig. 1D). The total acidity is around 0.38 mmol g−1, with two major desorption peaks at 225 and 420 °C that are usually ascribed as weak and strong acid sites, respectively (Table S2, ESI†).13,30 1Pt/A shows a broad peak at 180–480 °C with significantly lower intensity, which indicates a much lower acidity (0.003 mmol g−1) of γ-Al2O3 than USY. The systematic characterizations confirm that all of these catalysts share similar Pt loading, Pt size, textural properties, crystal structure, and acid properties, while only the proximity of the Pt and acid is altered from the closest to the nano-/micro-meter scale, which would allow us to investigate the effects of the nanoscale intimacy and accessibility of Pt on hydrocracking polyolefins.The effects of Pt-USY proximity in hydrocracking PE
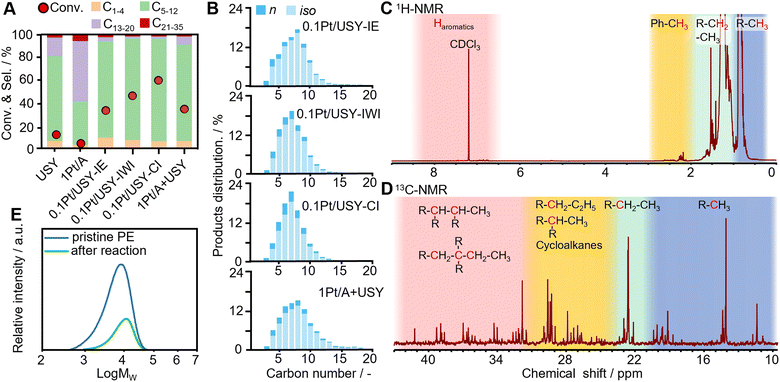
The Pt catalysts supported on Al2O3, SiO2, and different zeolites and referential pristine USY were tested for the hydrocracking of polyethylene under optimized conditions at 280 °C under 3 MPa H2 in a stainless-steel autoclave with mechanical stirring (Fig. S2, ESI†). The catalysts with only metal sites (1Pt/A and 1Pt/SiO2) or with only acidic sites (USY) were found to have very low activity (<13%), which is in accordance with the hydrocracking theory that the metal and acid are both indispensable catalytic sites (Fig. 3A).12,13,31 The combination of Pt and USY were found to have significantly higher activity (PE conversion 94%) and selectivity to gasoline-range fuels (C5–12, 85%) than Pt loaded on MOR, Beta, ZSM-5 and NaY (conversion < 20%, selectivity to C5–12 < 60%) (Fig. S3, ESI†).19,32–34 For the Pt/USY catalysts with various Pt loading quantities, the conversion increased from 25.2% to 98.3% when the amount of Pt increased from 0.1 to 2 mg and USY was kept at 0.2 g (Fig. S4, ESI†), which suggests that the (de)hydrogenation on the Pt sites is the rate-determining step in these consecutive reactions. This indicates that increasing the Pt-USY proximity and the accessibility of Pt NPs are vital factors for the facile hydrocracking of polyolefins (Fig. S5, ESI†).The Pt-USY catalysts with different nanoscale proximity showed a volcano trend of activity. The 0.1Pt/USY-CI, with Pt NPs exclusively on the USY surface, exhibits remarkably higher activity (conversion 62.4%) compared to the catalysts with Pt NPs mostly inside the USY crystal (0.1Pt/USY-IE and 0.1Pt/USY-IWI, conversion from 29.3% to 45.5%) and the catalyst with a physical mixture of 1Pt/A and USY (conversion 32.6%) (Fig. 3A). Moreover, 0.1Pt/A + USY, with the same Pt usage, showed very similar catalytic performance as the 1Pt/A + USY, which further suggests the good dispersion and accessibility of Pt on γ-Al2O3 (Fig. S6, ESI†). Therefore, 0.1Pt/USY-CI was identified as an outstanding catalyst for the hydrocracking of PE. These catalysts share similar selectivity patterns of liquid and gas products, with the major products distributed from C4 to C12 (Fig. 3B and Fig. S7, ESI†). In addition, a much higher selectivity to branched alkanes was obtained than to normal alkanes (iso/n ratio at 4.5–6.5), thus signifying that it is an excellent gasoline fuel with the high-octane number. Moreover, a higher selectivity to gasoline (C5–12) at 90.9% was achieved with 0.1Pt/USY-CI than its analogues (85–88%), which is probably due to the Pt inside the USY pores favoring the deep hydrocracking of gasoline to gas products (C1–4).13,20 As analyzed by 1H-NMR and 13C-NMR, the major composition of the liquid product was further confirmed as being branched aliphatic alkanes, while little aromatics were detected (Fig. 3C and D).35,36 The molecular weight of the original PE and solid products collected after reaction was analyzed by high-temperature gel penetration chromatography (HT-GPC) (Fig. 3E). The original PE has a weight-averaged molecular weight (Mw) at 8.5 kDa. After hydrocracking over 0.1Pt/USY-CI, the Mw slightly increases to 12.7 kDa. This does not mean the catalysts would promote the “polymerization”, but it indicates that a polyethylene with a smaller molecular weight would more easily be converted and the larger ones would be left as a solid product.36,37
Hydrocracking of model n-alkanes
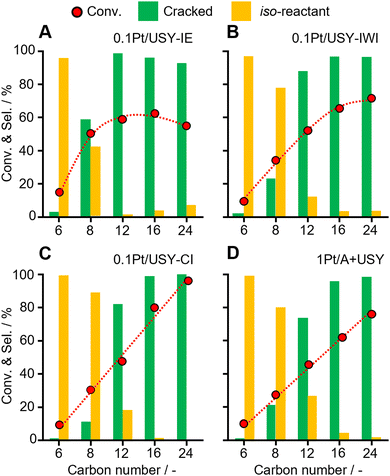
Several normal alkanes with increased size (C6, C8, C12, C16, C24) were selected as model reactants to further investigate the effects of the Pt-USY proximity and accessibility of Pt (Fig. 4 and Table S3, ESI†). First, with the increasing carbon number from 6 to 24, the reactivity largely increased. The selectivity to the iso-reactant gradually decreased, but increased for the cracked products. This is probably due to the longer alkanes more easily forming carbenium ions than short ones, which is the key intermediate for the isomerization and cracking to proceed.12,30 The conversion of these reactants increased linearly over 0.1Pt/USY-CI and 1Pt/A + USY. However, a volcano-shape conversion was observed on 0.1Pt/USY-IE and 0.1Pt/USY-IWI, with the highest conversion at C16 on 0.1Pt/USY-IE. In 0.1Pt/USY-IE, the Pt NPs were almost inside the USY crystal. Therefore, the reactant must diffuse from the surface to Pt NPs through the pore networks of USY (12-member ring opening at 0.74 nm).21,30,38,39 As the carbon number of the n-alkanes rises from 6 to 24, the molecular size increases and the diffusion efficiency decreases,40,41 with octane (C8, 0.75 nm) showing a comparable molecular size with the USY pore opening (Fig. S8, ESI†).42–45 On the one hand, the reactivity increases with the larger carbon number; on the other hand, the increased size of the reactant decreases its possibility of reaching the Pt NPs inside USY, thus leading to the drop in the conversion of C24 over 0.1Pt/USY-IE. As the Pt NPs are exclusively on the surface of USY or alumina in 0.1Pt/USY-CI and 1Pt/A, there is no limit for the accessibility of Pt. Therefore, a linear trend of conversion was observed. The facile diffusion into the micropores of USY seems to be hindered for octane and above. This is also reflected in the product distribution, wherein the selectivity starts to decline over octane.Moreover, for the conversion on different Pt-USY catalysts of relatively small reactants (C6 and C8), which have little diffusion limit, the Pt NPs inside the USY pores showed clearly higher activity and formation of more cracked products (Fig. 4 and Fig. S9, ESI†). This suggests that Pt NPs with spatially surrounded acid sites have much higher intrinsic activity in the cracking of C–C bonds than Pt NPs on a (weak) acidic surface (USY and Al2O3). However, the diffusion limitation would rule out the hydrocracking of PE on these sites, and it would promote the cracking of gasoline products towards undesired gas.13,15,30 Furthermore, as the carbon number of the reactants increased to C16 and C24, like in PE conversion, the conversion first increases as the Pt-USY proximity increases from Pt NPs inside the pores (0.1Pt/USY-IE) to Pt NPs on the USY surface (0.1Pt/USY-CI). Then, the conversion drops as the Pt-USY proximity increases to the nano-/micro-meter scale (1Pt/A + USY). The deteriorated catalytic performance of 1Pt/A + USY could be ascribed to the excessively large distance between Pt and USY that hinders the diffusion of alkene intermediates from Pt to USY, along with the rather weak acidity of Al2O3.11,46,47
The model of consecutive hydrocracking of PE
The possible hydrocracking routes of PE over different Pt/USY catalysts are summarized in Fig. 5. The primary hydrocracking of PE into heavy alkane intermediates was considered to be the rate-determining step in such consecutive cracking process,11,48 which is largely accelerated by 0.1Pt/USY-CI that consists of accessible Pt NPs on an acidic USY surface (Fig. 5B). The PE could simply be dehydrogenated and cracked on the 0.1Pt/USY-CI surface. However, the Pt/USY catalysts (0.1Pt/USY-IE, -IWI) have very few Pt NPs on USY surface, which accounts for the catalytic cracking initiation of the primary cracking proceeding more slowly than the hydrocracking process (Fig. 5A). In addition, the Pt NPs inside USY pores catalyze undesired over-cracking.13,15,30 When the Pt-USY proximity increases to the nano-/micro-meter scale (1Pt/A + USY, Fig. 5C), the PE could readily undergo dehydrogenation on 1Pt/A, but the alkene intermediates cannot be cracked on the barely acidic Al2O3 surface and must diffuse to USY for cracking. These diffusion steps thus depress the efficiency of the whole hydrocracking process. Along with the results from the hydrocracking of model alkanes (C6–C24), it was found that the hydrocracking of large alkanes and PE macromolecules was dominated by the metal-acid proximity. Loading the Pt NPs on the USY surface would largely increase the accessibility of Pt NPs and optimize its acid environment, thus enhancing the activity and selectivity to the desired gasoline fuels.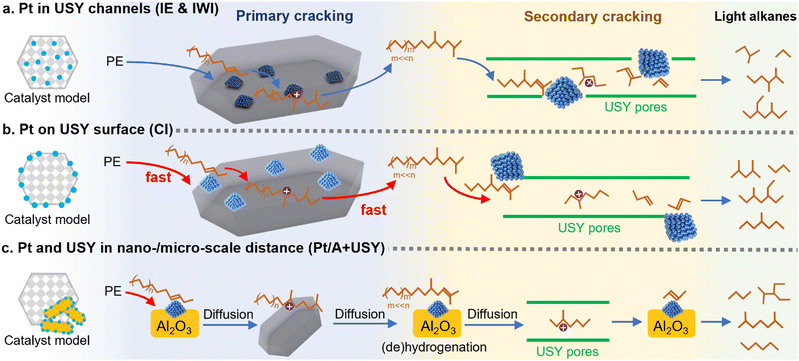 | ||
| Fig. 5 The proposed mechanism of hydrocracking of PE on Pt/USY catalysts with different metal-acid proximity. | ||
Hydrocracking of various plastics
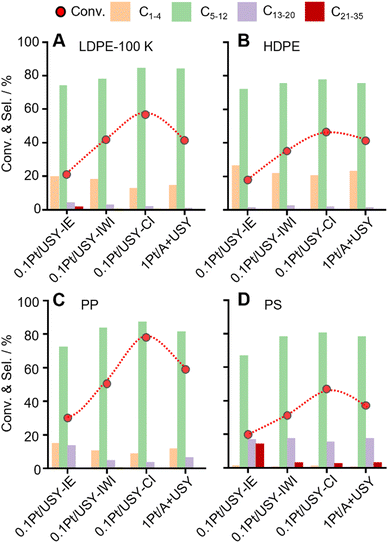
These Pt-USY catalysts were further applied to convert various plastic materials, LDPE-100K (pellet, Mw = 100 kDa), HDPE (pellet, Mw = 141 kDa), PP (powder, Mw = 27 kDa) and PS (powder, Mw = 4.6 kDa) (Fig. 6 and Fig. S10, ESI†). A similar volcano-shaped activity pattern was observed over the increased Pt-USY proximity. The 0.1Pt/USY-CI sample shows significantly better activity than its analogues. With the increased molecular weight of PE (Mw from 100 kDa to 141 kDa), the conversion decreased from 57.6% to 48.4% over 0.1Pt/USY-CI. This is probably due to the increased molecular size and viscosity that hinder the diffusion.15,49 Moreover, the conversion of PP with larger molecular weight (Mw = 27 kDa) is even higher than that for PE (Mw = 8.5 kDa), reaching 77.6% conversion and 87.3% selectivity to C5–12. This can be ascribed to the fact that the branched PP has a higher tendency to form carbenium ions as the key intermediate.12,50,51 The conversion of PP and PS catalyzed by 0.1Pt/USY-CI is more than 2 times higher than that of 0.1Pt/USY-IE. This suggests the advantage of locating Pt NPs on the surface of USY since the branched PP and PS have a much larger configuration and higher resistance to diffusion in the micropores of USY.9,52,53Time course and stability tests
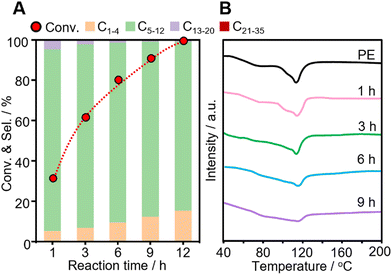
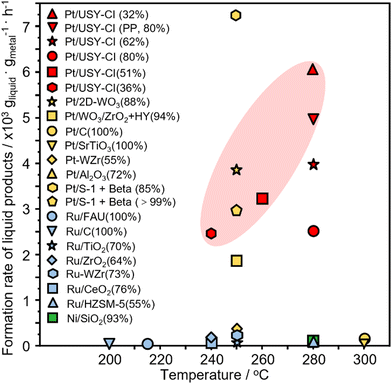
The time course of the reaction was investigated over Pt-USY catalysts with different metal-acid proximities. The conversion of PE increases from 30.9% at 1 h to 100% at 12 h over the 0.1Pt/USY-CI catalyst (Fig. 7A). The selectivity to gasoline slightly decreases from 89.0% to 83.1%. The selectivity to gas increases from 7.3% to 15.4% and that to diesel decreases from 3.6% to 0.7%, which suggests that the heavier products were further hydrocracked to lighter alkanes over the prolonged reaction time. A similar selectivity pattern was also observed on catalysts 0.1Pt/USY-IE, 0.1Pt/USY-IWI and 1Pt/A + USY (Fig. S11, ESI†). However, these catalysts showed much lower activity than 0.1Pt/USY-CI, with only about 70% conversion achieved after 12 hours of reaction. Moreover, the solid residues obtained after reaction were analyzed by DSC (Fig. 7B). The neat PE shows a main peak at 116 °C and a shoulder peak at around 80 °C. When the reaction time progressively increased, the intensity of the peak at 116 °C decreased, while the area of the peak shoulder (<116 °C) increased. This demonstrated the gradual reduction in the molecular weight of the solid residues.14 This supports that PE was transformed into lighter products during the process.The catalytic performance of 0.1Pt/USY-CI is further compared to that of various metal-based catalysts (Fig. 8 and Table S4, ESI†).11,50,54–65 The formation rate of soluble liquid products from PE or PP reaches 6122 gliqiud gPt−1 h−1 at 280 °C for 1h and 5048 gliqiud gPt−1 h−1 at 280 °C, respectively, which is superior to those of Pt-, Ru- and Ni-based catalysts.11,54 Even with the temperature down to 240 °C, the 0.1Pt/USY-CI catalyst still showed a formation rate at 2420 gliqiud gPt−1 h−1. A relatively low conversion level was selected for the calculation of the formation rate that reflects the ability of the catalyst to transform polyolefins into liquid fuels. These results indicate the advantage of loading Pt NPs exclusively on the outer surface of USY that could maximize the utilization of precious Pt, thus significantly reducing its usage.20
The reusability and stability of 0.1Pt/USY-CI were studied by regenerating and reusing the catalyst for 5 runs. The spent catalyst was regenerated by calcination at 500 °C and reduction at 300 °C in hydrogen to remove the formed coke and to fully reduce Pt. The conversion of PE gradually dropped from 100% to 77.8% over five runs, accompanied by the product distribution gradually shifting to heavier alkanes and the selectivity to gasoline slightly decreasing from 84.7% to 82.1% (Fig. S12, ESI†). Although the crystallinity and textual properties of the catalyst do not change over 5 runs (Fig. S13 and S14, ESI†), the loading of Pt and acidity of USY decrease from 0.096% to 0.085% (after 5 runs, Table S1, ESI†), and from 0.37 mmol g−1 to 0.23 mmol g−1 (Fig. S15 and Table S2, ESI†), which probably contribute to the drop of activity and slightly decreased cracking ability, respectively.48,66,67
Conclusion
The nanoscale proximity of Pt and USY was carefully controlled from the closest (Pt NPs inside USY crystalline) to nano-/micro-scale (physical mixture of 1Pt/A and USY) using different Pt precursors and preparation methods, while other key properties of the catalyst stayed unaffected. The Pt NPs exclusively located on the surface of USY prepared by colloid immobilization (0.1Pt/USY-CI) exhibit significantly higher activity, showing the liquid product formation rate at 6122 (from PE) and 5048 (from PP) gliquid gPt−1 h−1, which are far superior to those of its analogues. Full PE conversion and 83.1% selectivity to gasoline-range fuels were achieved at 280 °C for 12 hours of reaction. Moreover, 0.1Pt/USY-CI is also applicable for the conversion of various plastics, e.g., LDPE-100K, HDPE, PP, and PS, to produce highly branched gasoline fuels with a selectivity over 80%. Model reactions using reactants with different sizes (C6–C24) further revealed that 0.1Pt/USY with Pt NPs inside the USY pores has intrinsically higher activity. However, the limited accessibility of the Pt NPs constrains its apparent activity in converting macromolecular polymers. In addition, the excessive distance between Pt and USY would cause the catalytic performance to deteriorate, which probably is due to the long diffusion path between the metallic Pt and acidic USY. This work demonstrates that the nanoscale proximity of the metal and acid sites is a key criterion for bifunctional catalysts that employ noble metal and microporous support for hydrocracking macro-molecular polyolefins into gasoline, thus marking a pivotal step towards upcycling plastic waste for value-added fuel production.Experimental
Materials
Pt precursors, Pt(NH3)4(NO3)2 (99.9%), H2PtCl6·xH2O (99.9%), NaBH4 (99.0%) and poly vinyl alcohol (PVA, Mw = 8200, 85–90% hydrolyzed) were purchased from Macklin Co., Ltd. SiO2 and Al2O3 were purchased from Evonik. Typical zeolites USY (Si/Al = 22), NaY (Si/Al = 10), HY (Si/Al = 20), ZSM-5 (Si/Al = 72), beta (Si/Al = 72) and MOR (Si/Al = 50) were purchased from Nankai Catalysts Co., Ltd. All zeolites were calcined at 500 °C for 5 h before use. All supports were dried under vacuum at 120 °C overnight before catalyst preparation.Catalyst preparation
Characterizations
Nitrogen physisorption was measured at −196 °C using a MicrotracBEL Japan. Prior to analysis, the samples were degassed overnight at 300 °C. The specific surface area was calculated using the Brunauer–Emmett–Teller (BET) method. The total pore volumes were derived from the amount of N2 adsorbed at p/p0 = 0.99. The pore size distributions were determined via the Barrett–Joyner–Halenda method based on the adsorption branch isotherms. Inductively coupled plasma (ICP) analysis of platinum was performed on a PerkinElmer Optima 2000 DV ICP instrument after sample dissolution according to standard in-house procedures. Scanning transmission electron microscopy (STEM) was measured on a FEI F20 with an electron source at voltage 200 kV, using a high-angle annular dark-field (HAADF) detector. The average size and distribution of Pt NPs were obtained by measuring at least 100 Pt NPs per sample. X-Ray photoelectron spectroscopy (XPS) measurements were carried out on a Kratos Axis Ultra DLD (Shimadzu) equipped with an Al Kα X-ray source (1486.6 eV). Destructive elemental depth profile XPS (DPXPS) was measured using an Ar ion sputtering (beam energy 2000 eV, beam current 1 μA), and the etching rate was estimated at 0.2 nm per second.28 The sample was etched for 200 seconds, which resulted in a depth of around 40 nm. The binding energy was corrected by taking the C1s line at 284.5 eV as a reference. The sample for the measurement of ammonia temperature-programmed desorption (NH3-TPD) was first pretreated under He flow for 1 h at 500 °C (ramp = 10 °C min−1) and cooled down to 100 °C, after which ammonia (10 vol% in He) was adsorbed until saturation was achieved. Physiosorbed ammonia was flushed by flowing He for 30 min at 100 °C and stabilized for 2 h. Ammonia desorption was measured from 100 °C to 700 °C (ramp = 10 °C min−1) using a TCD detector. The X-ray diffraction (XRD) pattern was recorded on a Rigaku SmartLab X-ray diffractometer with Cu Kα radiation operating at 40 kV and 15 mA. The samples were scanned in a 2θ range of 5°–60° with a 2θ step-scan interval of 1.83°. Molecular weight distributions of pristine plastics (PE, LDPE-100K, HDPE, PP and PS) or the solid products were analyzed by high temperature gel permeation chromatography (HT-GPC) on an Agilent PL-GPC 220, equipped with two PL-Gel Mixed B columns, and a refractive index (RI) detector. Samples were dissolved in 1,2,4-trichlorobenzene containing ditertbutylhydroxytoluene at 150 °C for at least 1 h. 1H and 13C-NMR spectra were measured on AVANCE AV-300, Bruker, using deuterated chloroform as the solvent. Differential scanning calorimetry (DSC) was measured on a NETZSCH STA 449F3. The sample was heated in nitrogen flow from 40 to 200 °C with a heating rate of 10 °C min−1.Catalyst evaluation
The hydrocracking of polyolefins and n-alkanes was carried out in an electrically heated stainless-steel autoclave (volume = 45 mL) with a mechanic stirrer (Shanghai Yanzheng Instruments Co., Ltd). In a typical test, the PE powder (4.0 g) and catalyst (0.1Pt/USY-CI, 0.2 g) were added into the autoclave and sealed. The reactor was purged with H2 for 3 times to fully remove air, and then the pressure of H2 was set at 3 MPa at room temperature. The reactor was heated to 280 °C with vigorous stirring and maintained for 3 hours, excluding the ramping time of 30 mins. Then, the reaction was quenched in flowing water until room temperature was achieved. Afterwards, the gas sample in the headspace was completely collected with a sealed air bag. The reactor was opened, and 30 mL cyclohexane (as solvent) was quickly added to the reactor and kept for 30 min to dissolve high molecular hydrocarbons. All of the liquid was collected and diluted to 50 mL in a volumetric flask. The resulting mixture was then filtered by a syringe membrane filter (0.45 um) to remove the catalyst residue and unreacted polymers. The gas and liquid (with internal standard 1,3,5-tritertbutylbenzene) products were analyzed by a gas chromatograph (Fuli GC9790Plus) equipped with a capillary column (HP-5) and a flame ionization detector (FID). Since it is difficult and not practical to identify and obtain all of the isomers of the n-alkanes as standard chemicals, the relative response factor of the alkane isomers was assumed to be the same as that of its n-alkanes.The undissolved PE and high molecular hydrocarbon solids were collected, filtered, and dried at 120 °C overnight before further analysis. The conversion of PE was calculated as follows:
where Ci is the product group of alkanes with i-th carbon. All peaks between n-Ci−1 and n-Ci were assumed as branched Ci alkanes, i.e., iso-Ci.
The selectivity of the hydrocarbon Ci was calculated as:
 is the sum of hydrocarbons in the gas and liquid phases. The carbon balance in all experiments was higher than 90%.
Calculation of molecular sizes
The HyperChem v8.0 was used to calculate the geometry configuration of n-alkanes that was optimized with the molecular mechanics + (MM+) force field model. Accordingly, the molecular size of the selected normal alkanes was calculated based on their space cartesian coordinates.Author contributions
Xinlei Han: investigation, catalyst preparation, characterization, catalytic tests, discussion, writing – original draft. Xinru Zhou: catalyst preparation, characterization, catalytic tests, discussion. Tuo Ji, Feng Zeng: characterization, discussion. Weiping Deng: helpful discussion. Zhenchen Tang: designing the study, analyzing the data, discussion, and writing – review & editing. Rizhi Chen: supervision, discussion, and writing – review & editing.Conflicts of interest
The authors declare that they have no known competing financial interests or personal relationships that could have appeared to influence the work reported in this paper.Acknowledgements
The authors are grateful for the financial support from the National Natural Science Foundation (22208144), and the Natural Science Foundation of Jiangsu Province of China (BK20220346).References
- A. Stubbins, K. L. Law, S. E. Muñoz, T. S. Bianchi and L. Zhu, Science, 2021, 373, 51–55 CrossRef CAS.
- B. M. Weckhuysen, Science, 2020, 370, 400–401 CrossRef PubMed.
- R. Geyer, J. R. Jambeck and K. L. Law, Sci. Adv., 2017, 3, e1700782 CrossRef PubMed.
- G. W. Coates and Y. D. Y. L. Getzler, Nat. Rev. Mater., 2020, 5, 501–516 CrossRef CAS.
- I. Vollmer, M. J. F. Jenks, M. C. P. Roelands, R. J. White, T. van Harmelen, P. de Wild, G. P. van der Laan, F. Meirer, J. T. F. Keurentjes and B. M. Weckhuysen, Angew. Chem., Int. Ed., 2020, 59, 15402–15423 CrossRef CAS.
- F. Zhang, F. Wang, X. Wei, Y. Yang, S. Xu, D. Deng and Y.-Z. Wang, J. Energy Chem., 2022, 69, 369–388 CrossRef CAS.
- J. R. Jambeck, R. Geyer, C. Wilcox, T. R. Siegler, M. Perryman, A. Andrady, R. Narayan and K. L. Law, Science, 2015, 347, 768–771 CrossRef CAS PubMed.
- A. Rahimi and J. M. García, Nat. Rev. Chem., 2017, 1, 0046 CrossRef.
- A. J. Martín, C. Mondelli, S. D. Jaydev and J. Pérez-Ramírez, Chem, 2021, 7, 1487–1533 Search PubMed.
- W.-T. Lee, A. van Muyden, F. D. Bobbink, M. D. Mensi, J. R. Carullo and P. J. Dyson, Nat. Commun., 2022, 13, 4850 CrossRef CAS.
- S. Liu, P. A. Kots, B. C. Vance, A. Danielson and D. G. Vlachos, Sci. Adv., 2021, 7, eabf8283 CrossRef CAS PubMed.
- J. Weitkamp, ChemCatChem, 2012, 4, 292–306 CrossRef CAS.
- J. Zecevic, G. Vanbutsele, K. P. de Jong and J. A. Martens, Nature, 2015, 528, 245–248 CrossRef CAS PubMed.
- B. C. Vance, P. A. Kots, C. Wang, J. E. Granite and D. G. Vlachos, Appl. Catal., B, 2023, 322, 122138 CrossRef CAS.
- W. Ding, J. Liang and L. L. Anderson, Energy Fuels, 1997, 11, 1219–1224 CrossRef CAS.
- J. M. Escola, J. Aguado, D. P. Serrano, A. García, A. Peral, L. Briones, R. Calvo and E. Fernandez, Appl. Catal., B, 2011, 106, 405–415 CrossRef CAS.
- Q. Zhang, S. Gao and J. Yu, Chem. Rev., 2023, 123, 6039–6106 CrossRef CAS.
- P. Lanzafame, S. Perathoner, G. Centi, E. Heracleous, E. F. Iliopoulou, K. S. Triantafyllidis and A. A. Lappas, ChemCatChem, 2017, 9, 1632–1640 CrossRef CAS.
- L. I. Van der Wal, J. Oenema, L. C. J. Smulders, N. J. Samplonius, K. R. Nandpersad, J. Zečević and K. P. de Jong, ACS Catal., 2021, 11, 3842–3855 CrossRef CAS PubMed.
- K. Cheng, L. C. J. Smulders, L. I. van der Wal, J. Oenema, J. D. Meeldijk, N. L. Visser, G. Sunley, T. Roberts, Z. Xu, E. Doskocil, H. Yoshida, Y. Zheng, J. Zečević, P. E. de Jongh and K. P. de Jong, Science, 2022, 377, 204–208 CrossRef CAS.
- K. Cheng, L. I. Van der Wal, H. Yoshida, J. Oenema, J. Harmel, Z. Zhang, G. Sunley, J. Zečević and K. P. de Jong, Angew. Chem., Int. Ed., 2020, 59, 3592–3600 CrossRef CAS PubMed.
- A. Tennakoon, X. Wu, A. L. Paterson, S. Patnaik, Y. Pei, A. M. LaPointe, S. C. Ammal, R. A. Hackler, A. Heyden, I. I. Slowing, G. W. Coates, M. Delferro, B. Peters, W. Huang, A. D. Sadow and F. A. Perras, Nat. Catal., 2020, 3, 893–901 CrossRef CAS.
- S. Chen, A. Tennakoon, K.-E. You, A. L. Paterson, R. Yappert, S. Alayoglu, L. Fang, X. Wu, T. Y. Zhao, M. P. Lapak, M. Saravanan, R. A. Hackler, Y.-Y. Wang, L. Qi, M. Delferro, T. Li, B. Lee, B. Peters, K. R. Poeppelmeier, S. C. Ammal, C. R. Bowers, F. A. Perras, A. Heyden, A. D. Sadow and W. Huang, Nat. Catal., 2023, 6, 161–173 CrossRef CAS.
- J. Zečević, A. M. J. van der Eerden, H. Friedrich, P. E. de Jongh and K. P. de Jong, ACS Nano, 2013, 7, 3698–3705 CrossRef.
- J. A. Lopez-Sanchez, N. Dimitratos, C. Hammond, G. L. Brett, L. Kesavan, S. White, P. Miedziak, R. Tiruvalam, R. L. Jenkins, A. F. Carley, D. Knight, C. J. Kiely and G. J. Hutchings, Nat. Chem., 2011, 3, 551–556 CrossRef CAS.
- Z. Tang, D. G. Boer, A. Syariati, M. Enache, P. Rudolf, H. J. Heeres and P. P. Pescarmona, Green Chem., 2019, 21, 4115–4126 RSC.
- Z. Tang, P. Liu, H. Cao, S. Bals, H. J. Heeres and P. P. Pescarmona, ACS Catal., 2019, 9, 9953–9963 CrossRef CAS.
- H. Huang, W. Ye, C. Song, Y. Liu, X. Zhang, Y. Shan, Y. Ge, S. Zhang and R. Lu, J. Mater. Chem. A, 2021, 9, 14710–14721 RSC.
- Y. J. Hofstetter and Y. Vaynzof, ACS Appl. Polym. Mater., 2019, 1, 1372–1381 CrossRef CAS.
- A. Primo and H. Garcia, Chem. Soc. Rev., 2014, 43, 7548–7561 RSC.
- F. Alvarez, F. R. Ribeiro, G. Perot, C. Thomazeau and M. Guisnet, J. Catal., 1996, 162, 179–189 CrossRef CAS.
- L. Dai, N. Zhou, K. Cobb, P. Chen, Y. Wang, Y. Liu, R. Zou, H. Lei, B. A. Mohamed, Y. Cheng and R. Ruan, Appl. Catal., B, 2022, 318, 121835 CrossRef CAS.
- K. Pyra, K. A. Tarach and K. Góra-Marek, Appl. Catal., B, 2021, 297, 120408 CrossRef CAS.
- X. Wu, A. Tennakoon, R. Yappert, M. Esveld, M. S. Ferrandon, R. A. Hackler, A. M. LaPointe, A. Heyden, M. Delferro, B. Peters, A. D. Sadow and W. Huang, J. Am. Chem. Soc., 2022, 144, 5323–5334 CrossRef CAS PubMed.
- W. Zhang, S. Kim, L. Wahl, R. Khare, L. Hale, J. Hu, D. M. Camaioni, O. Y. Gutiérrez, Y. Liu and J. A. Lercher, Science, 2023, 379, 807–811 CrossRef CAS.
- F. Zhang, M. Zeng, R. D. Yappert, J. Sun, Y.-H. Lee, A. M. LaPointe, B. Peters, M. M. Abu-Omar and S. L. Scott, Science, 2020, 370, 437–441 CrossRef CAS.
- X. Jia, C. Qin, T. Friedberger, Z. Guan and Z. Huang, Sci. Adv., 2016, 2, e1501591 CrossRef.
- J. He, Z. Wu, Q. Gu, Y. Liu, S. Chu, S. Chen, Y. Zhang, B. Yang, T. Chen, A. Wang, B. M. Weckhuysen, T. Zhang and W. Luo, Angew. Chem., Int. Ed., 2021, 60, 23713–23721 CrossRef CAS.
- I. Vollmer, M. J. F. Jenks, R. Mayorga González, F. Meirer and B. M. Weckhuysen, Angew. Chem., Int. Ed., 2021, 60, 16101–16108 CrossRef CAS PubMed.
- H. Jobic, A. Méthivier, G. Ehlers, B. Farago and W. Haeussler, Angew. Chem., Int. Ed., 2004, 43, 364–366 CrossRef CAS.
- R. Tsekov and P. G. Smirniotis, J. Phys. Chem. B, 1998, 102, 9385–9391 CrossRef CAS.
- M. Mantina, A. C. Chamberlin, R. Valero, C. J. Cramer and D. G. Truhlar, J. Phys. Chem. A, 2009, 113, 5806–5812 CrossRef CAS.
- B. Smit, Chem. Rev., 2008, 108, 4125–4184 CrossRef CAS.
- L. Song, Z. Sun, L. Duan, J. Gui and G. S. McDougall, Microporous Mesoporous Mater., 2007, 104, 115–128 CrossRef CAS.
- C. Jia, S. Xie, W. Zhang, N. N. Intan, J. Sampath, J. Pfaendtner and H. Lin, Chem Catal., 2021, 1, 437–455 CrossRef CAS.
- A. Bin Jumah, V. Anbumuthu, A. A. Tedstone and A. A. Garforth, Ind. Eng. Chem. Res., 2019, 58, 20601–20609 CrossRef CAS.
- N. D. Hesse and R. L. White, Appl. Polym. Sci., 2004, 92, 1293–1301 CrossRef CAS.
- J. Duan, W. Chen, C. Wang, L. Wang, Z. Liu, X. Yi, W. Fang, H. Wang, H. Wei, S. Xu, Y. Yang, Q. Yang, Z. Bao, Z. Zhang, Q. Ren, H. Zhou, X. Qin, A. Zheng and F.-S. Xiao, J. Am. Chem. Soc., 2022, 144, 14269–14277 CrossRef CAS.
- D. Munir, M. F. Irfan and M. R. Usman, Renewable Sustainable Energy Rev., 2018, 90, 490–515 CrossRef CAS.
- S. D. Jaydev, A. J. Martín and J. Pérez-Ramírez, ChemSusChem, 2021, 14, 5179–5185 CrossRef CAS PubMed.
- S. D. Jaydev, M.-E. Usteri, A. J. Martín and J. Pérez-Ramírez, Chem Catal., 2023, 3, 100564 CrossRef CAS.
- R. Cao, M.-Q. Zhang, C. Hu, D. Xiao, M. Wang and D. Ma, Nat. Commun., 2022, 13, 4809 CrossRef CAS.
- Z. Zhang, D. Li, J. Wang and J. Jiang, Appl. Catal., B, 2023, 323, 122164 CrossRef CAS.
- Q. Zhou, D. Wang, Q. Wang, K. He, K. H. Lim, X. Yang, W.-J. Wang, B.-G. Li and P. Liu, Angew. Chem., Int. Ed., 2023, e202305644 CAS.
- Y. Nakaji, M. Tamura, S. Miyaoka, S. Kumagai, M. Tanji, Y. Nakagawa, T. Yoshioka and K. Tomishige, Appl. Catal., B, 2021, 285, 119805 CrossRef CAS.
- J. E. Rorrer, A. M. Ebrahim, Y. Questell-Santiago, J. Zhu, C. Troyano-Valls, A. S. Asundi, A. E. Brenner, S. R. Bare, C. J. Tassone, G. T. Beckham and Y. Román-Leshkov, ACS Catal., 2022, 12, 13969–13979 CrossRef CAS.
- P. A. Kots, S. Liu, B. C. Vance, C. Wang, J. D. Sheehan and D. G. Vlachos, ACS Catal., 2021, 11, 8104–8115 CrossRef CAS.
- Z. Zhao, Z. Li, X. Zhang, T. Li, Y. Li, X. Chen and K. Wang, Environ. Pollut., 2022, 313, 120154 CrossRef CAS.
- C. Wang, T. Xie, P. A. Kots, B. C. Vance, K. Yu, P. Kumar, J. Fu, S. Liu, G. Tsilomelekis, E. A. Stach, W. Zheng and D. G. Vlachos, JACS Au, 2021, 1, 1422–1434 CrossRef CAS.
- M. Tamura, S. Miyaoka, Y. Nakaji, M. Tanji, S. Kumagai, Y. Nakagawa, T. Yoshioka and K. Tomishige, Appl. Catal., B, 2022, 318, 121870 CrossRef CAS.
- G. Celik, R. M. Kennedy, R. A. Hackler, M. Ferrandon, A. Tennakoon, S. Patnaik, A. M. LaPointe, S. C. Ammal, A. Heyden, F. A. Perras, M. Pruski, S. L. Scott, K. R. Poeppelmeier, A. D. Sadow and M. Delferro, ACS Cent. Sci., 2019, 5, 1795–1803 CrossRef CAS.
- B. C. Vance, P. A. Kots, C. Wang, Z. R. Hinton, C. M. Quinn, T. H. Epps, L. T. J. Korley and D. G. Vlachos, Appl. Catal., B, 2021, 299, 120483 CrossRef CAS.
- J. Du, L. Zeng, T. Yan, C. Wang, M. Wang, L. Luo, W. Wu, Z. Peng, H. Li and J. Zeng, Nat. Nanotechnol., 2023, 18, 772–779 CrossRef CAS.
- J. E. Rorrer, G. T. Beckham and Y. Román-Leshkov, JACS Au, 2021, 1, 8–12 CrossRef CAS PubMed.
- L. Li, H. Luo, Z. Shao, H. Zhou, J. Lu, J. Chen, C. Huang, S. Zhang, X. Liu, L. Xia, J. Li, H. Wang and Y. Sun, J. Am. Chem. Soc., 2023, 145, 1847–1854 CrossRef CAS PubMed.
- G. Elordi, M. Olazar, G. Lopez, P. Castaño and J. Bilbao, Appl. Catal., B, 2011, 102, 224–231 CrossRef CAS.
- C. Kassargy, S. Awad, G. Burnens, G. Upreti, K. Kahine and M. Tazerout, Appl. Catal., B, 2019, 244, 704–708 CrossRef CAS.
Footnote |
| † Electronic supplementary information (ESI) available. See DOI: https://doi.org/10.1039/d3ey00180f |
| This journal is © The Royal Society of Chemistry 2024 |

