 Open Access Article
Formation of nanoporous aerogels from defatted rice bran via supercritical carbon dioxide drying
Sumanjot
Kaur
a,
Jingyi
Chen
 b and
Ali
Ubeyitogullari
 *ac
*ac
aDepartment of Food Science, University of Arkansas, Fayetteville, N205, 2650 N. Young Ave, AR 72704, USA. E-mail: uali@uark.edu; Tel: +1 (479)-575-3183
bDepartment of Chemistry and Biochemistry, University of Arkansas, Fayetteville, AR 72701, USA
cDepartment of Biological and Agricultural Engineering, University of Arkansas, Fayetteville, AR 72701, USA
First published on 25th October 2023
Abstract
Rice bran (∼8–10% of the total rice weight), generated in large quantities during rice processing, is an underutilized rice processing byproduct. The objective of this study was to upcycle defatted rice bran into starch and protein-based nanoporous aerogels using supercritical carbon dioxide (SC-CO2) drying. Specifically, crude starch-1, crude starch-2, and protein aerogels were prepared at three different concentrations of 10, 15, and 20% (w/w). The generated aerogels were characterized for their morphology, crystallinity, chemical interactions, textural properties, solubility, and thermal stability. The aerogels (15%, w/w) prepared from rice bran crude starch and protein formed a three-dimensional interconnected open porous structure. At this concentration, protein aerogels revealed the highest surface area of 25.3 m2 g−1, a pore size of 22 nm, and a pore volume of 0.13 cm3 g−1, whereas crude starch-1 and crude starch-2 aerogels had surface areas of 19.7 and 21.3 m2 g−1, pore sizes of 22 and 18 nm, and pore volumes of 0.10 and 0.09 cm3 g−1, respectively. All the aerogels exhibited densities lower than 0.3 g cm−3 with porosities higher than 82%. Overall, this study generated high-value starch and protein-based aerogels that can be used for developing functional foods to deliver bioactive compounds, thereby adding value to the underutilized defatted rice bran.
Sustainability spotlightRice bran, generated in large quantities during rice processing, is an underutilized rice processing byproduct. To date, rice bran has been only commercialized for oil production, and the rest is used as animal feed, feedstock, and boiler fuel, and in biohydrogen production. The objective of this study was to upcycle defatted rice bran into starch and protein-based nanoporous aerogels using supercritical carbon dioxide drying. This study generated high-value starch and protein-based aerogels that can be used for developing functional foods to deliver bioactive compounds, thereby adding value to the underutilized defatted rice bran. Thus, this study advances the UN's Sustainable Development Goals (SDG) 2: end hunger, achieve food security and improved nutrition and promote sustainable agriculture (i.e., SDG 2.4), and 12: ensure sustainable consumption and production patterns (i.e., SDG 12.3). |
1. Introduction
Growing global demand for rice consumption increased the rice processing byproduct production in the same proportion. Rice bran (∼8–10% of the total grain weight) is an underutilized rice processing byproduct, of which more than 50 MT is produced annually.1 To date, rice bran has been only commercialized for oil production, and the rest is used as animal feed, feedstock, and boiler fuel, and in biohydrogen production.2,3 Defatted rice bran, a great source of high-value starch (30–40%) and protein (13–14%), has recently gained a lot of attention due to its high-value essential amino acid content, gluten-free nature and potential health benefits, including antioxidant activities, and antiallergic and anticancer properties.4Starch and proteins from defatted rice bran are food-grade, low-cost, biodegradable, and renewable materials with high potential for food applications. The rice bran starch is composed of amylose and amylopectin, and proteins are composed of albumin, globulin, glutelin, and prolamin.1 Additionally, rice bran is a rich source of fiber that has several potential health benefits, including improving digestion, reducing cholesterol levels, and maintaining overall gut health.5 Even though there have been recent efforts to use rice bran in food applications (e.g., bakery products) in addition to its use as animal feed, they are still minimal.6 Owing to its high nutritional value, defatted rice bran is a great source to produce food-grade bio-based aerogels to convert rice processing byproducts into high-value materials and contribute to enhancing the sustainability of rice production.
Production of bio-based aerogels has increased in the past few decades due to their biodegradability, high surface area, high porosity, low thermal conductivity, low relative density, and open porous three-dimensional structure for numerous applications, such as bioactive compound/drug delivery, tissue engineering, disease diagnosis, and antibacterial materials.7–10 Aerogels are generated upon drying of gels with a network structure via SC-CO2. SC-CO2 eliminates surface tension and capillary forces during drying, resulting in high-surface-area, nanoporous materials. Compared to SC-CO2 drying, both air and freeze-drying lead to shrinkage during drying, creating materials with low surface areas.11–13 For example, SC-CO2 drying of high amylose corn starch gels resulted in a surface area of 175 m2 g−1, while freeze-drying of the same gel produced materials with a very low surface area of less than 1 m2 g−1.12 Furthermore, various studies have reported the formation of aerogels from different starches, including wheat,11 corn,12,14 and pea.15 In addition, protein-based aerogels have been generated from canola seed,16 whey protein,17 and soy protein.18 Even though there have been several studies on the generation of aerogels from various starch and protein sources, there is a need for novel, inexpensive sources to create aerogels with potential health benefits. We hypothesized that undervalued defatted rice bran fractions could create high surface area, nanoporous aerogels upon SC-CO2 drying. To the best of our knowledge, there is no report on aerogel formation from defatted rice bran starch and protein. Furthermore, the utilization of rice processing byproducts in the form of aerogels can be an innovative solution to address waste management and sustainability in the rice processing industry.
Therefore, the main objective of this study was to form starch- and protein-based aerogels from defatted rice bran using SC-CO2 drying. Specific objectives were to (i) extract crude starch-1, crude starch-2 with high fiber content, and protein from defatted rice bran and create aerogels from these fractions, and (ii) characterize the produced aerogels for their surface area, pore size, pore volume, density, porosity, emulsifying capacity, morphology, crystallinity, and chemical structure. Considering the low cost and nutritional value of defatted rice bran, the fabricated crude starch-1, crude starch-2, and protein aerogels can be used for the delivery of bioactive compounds/drugs in the food and pharmaceutical industries.
2. Materials and methods
2.1. Materials
Rice bran was kindly supplied by Riceland Foods (AR, USA). Sodium hydroxide, hydrochloric acid, potassium hydroxide, sodium acetate, and sodium phosphate were purchased from Sigma-Aldrich (MO, USA). Organic solvents, including ethanol, acetone, diethyl ether, and hexane, were purchased from Fisher Scientific (PA, USA), and carbon dioxide (>99.99%) was supplied by Airgas, Inc. (AR, USA). The total starch assays were purchased from Neogen (Lansing, MI).2.2. Defatting rice bran
The defatting of rice bran was performed using hexane according to Ju et al.19 Briefly, 100 g of the sample was mixed with 400 mL of hexane for 4 h, and then the filtered residue was kept for 24 h for drying under a hood at room temperature (23 °C). The extraction was repeated three times.2.3. Protein and crude starch extraction
Protein and crude starch extractions were conducted according to Ju et al.19,20 and Gnanasambandam and Hettiarachchy,19,20 respectively. In brief, the defatted rice bran sample was mixed with deionized water (1![[thin space (1/6-em)]](https://www.rsc.org/images/entities/char_2009.gif) :
:![[thin space (1/6-em)]](https://www.rsc.org/images/entities/char_2009.gif) 4, w/w), and the pH was adjusted to 9.5 using 1 M NaOH solution. The sample was then centrifuged for 30 min at 10
4, w/w), and the pH was adjusted to 9.5 using 1 M NaOH solution. The sample was then centrifuged for 30 min at 10![[thin space (1/6-em)]](https://www.rsc.org/images/entities/char_2009.gif) 000g. The supernatant was collected for protein extraction, and the residue was prepared for crude starch extraction. The pH of the collected supernatant was adjusted to 4.5 and kept for protein precipitation. The precipitate was centrifuged at 10
000g. The supernatant was collected for protein extraction, and the residue was prepared for crude starch extraction. The pH of the collected supernatant was adjusted to 4.5 and kept for protein precipitation. The precipitate was centrifuged at 10![[thin space (1/6-em)]](https://www.rsc.org/images/entities/char_2009.gif) 000g for 30 min. The protein precipitate was washed using deionized water at pH 7.0 and frozen at −80 °C for 24 h before freeze-drying (Labconco, MO, USA).
000g for 30 min. The protein precipitate was washed using deionized water at pH 7.0 and frozen at −80 °C for 24 h before freeze-drying (Labconco, MO, USA).
The spent rice bran obtained after protein extraction was either used as is and called “crude starch-2” or further purified to obtain the starch fraction. The purified starch fraction (hereafter called “crude starch-1”) was collected by passing crude starch-2 through a 263-mesh sieve with an opening size of 63 μm.21 The crude starch-1 fraction was washed using 600 mL of water, 300 mL of ethanol, 300 mL of acetone, and 300 mL of diethyl ether consecutively, where each washing step was repeated twice. Finally, the extracts of crude starch-1 and crude starch-2 were collected by centrifugation and dried overnight under a hood for 24 h at room temperature (23 °C). After complete drying, the samples were stored at −4 °C until further use.
2.4. Compositional analysis
The moisture content was determined according to the AACC 2000 method.22 The nitrogen content was determined according to AOAC 968.06-1969 and converted into crude protein content by using a conversion factor of 6.25.23 The ash content was determined according to AOAC 923.03.24 The starch content was quantified following the method of AOAC 996.11.252.5. Aerogel formation
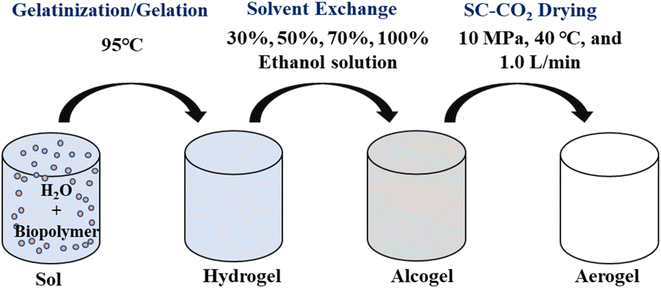
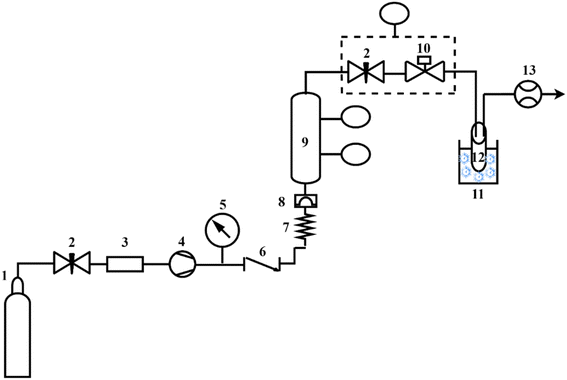
The formation of aerogels involved three main steps: hydrogel formation, solvent exchange, and SC-CO2 drying, as depicted in Fig. 1.2.6. Aerogel characterization
 | (1) |
The bulk density was measured by using the ratio of weight to volume, and the true density was determined using a gas pycnometer AccuPyc II 1340 (Micromeritics, GA, USA). The true density measurement was conducted at 25 °C using a cell with 10 cm3 volume, where both cycle and purge fill pressures were fixed at 19.5 psig.
The volumetric shrinkage of the aerogels during solvent exchange and drying was calculated using the following equation:
 | (2) |
 | (3) |
2.7. Statistical analysis
The statistical analysis was performed using ANOVA and Tukey's test at a 5% significance level with statistical software JMP Pro 16.0 (SAS Institute, NC, USA). The experiments were conducted in triplicate, and the results were expressed as the mean ± standard deviation.3. Results and discussion
3.1. Composition of rice bran
The composition of rice bran is illustrated in Table 1. The rice bran used for aerogel production contained 31.7% starch, 13.8% protein, 12.7% oil, and 14.6% ash, which were in agreement with the previously published composition data.31–33 The moisture content of the rice bran (2.5%, w/w) was relatively low compared to that in previous reports (8–11%, w/w).34 Vaitkeviciene et al. reported a resistant starch content of 11.5% in rice bran.35 According to the literature, the amylose content in rice bran starch is quite low (0.49–6%), and peptide fractionization from defatted rice bran showed 12.5% albumin, 13.9% globulin, 70.8% glutelin and 2.9% prolamin.36–38 As discussed by Kalpanadevi et al. the differences in the composition data could be due to many reasons, including different varieties of rice, environmental factors, and milling conditions.39| Rice bran | Composition (%, w/w) |
|---|---|
| a Means that do not share a common letter are significantly different (p < 0.05). | |
| Protein | 13.84 ± 0.11b |
| Starch | 31.66 ± 1.67a |
| Oil | 12.71 ± 0.53b |
| Moisture | 2.52 ± 0.15c |
| Ash | 14.60 ± 0.42b |
3.2. Fabrication of the aerogels
In this study, crude starch-1, crude starch-2, and protein hydrogels were fabricated using different concentrations (10, 15, and 20%) (Fig. 3). The starch contents of the crude starch-1 and crude starch-2 fractions were 66.1% and 51.4% (dry basis), respectively, while the protein fraction contained 60.0% (dry basis) proteins. The results showed that the minimum hydrogel concentration required to maintain the shape was 15%. However, below this concentration (10%), it was difficult to maintain the shape, and an increase in concentration to 20% led to a denser structure with higher viscosity. The reason for not being able to form strong gels with 10% crude starch-1 and -2 could be due to their low starch concentrations (66.1% and 51.4%, respectively). Forming hydrogels from the collected fractions (i.e., crude starch-1 and-2, and protein) without extensive purification steps could reduce the cost of the materials used for aerogel fabrication. Due to the higher solubility of ethanol in SC-CO2, the hydrogels were introduced to different ethanol concentration solutions to replace the water in the matrix with ethanol.40 The formed alcogels were dried using SC-CO2 drying, preserving the porous structure by reducing the capillary stress on the matrix and preventing shrinkage.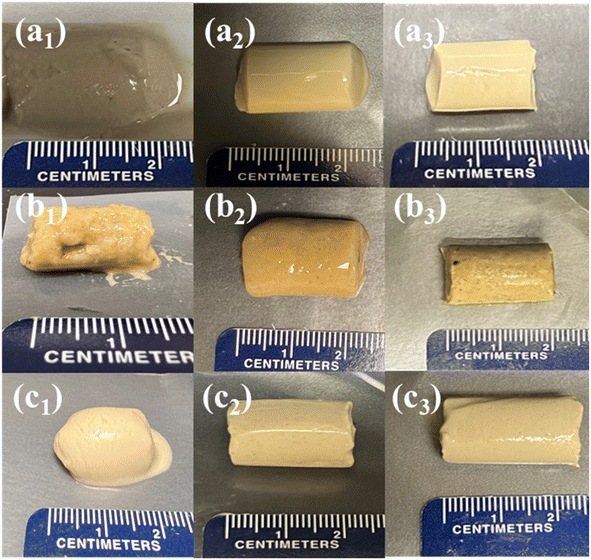 | ||
| Fig. 3 Pictures of crude starch-1, crude starch-2, and protein hydrogels at 10 (a1–a3), 15 (b1–b3), and 20% (c1–c3), respectively. | ||
3.3. Morphology
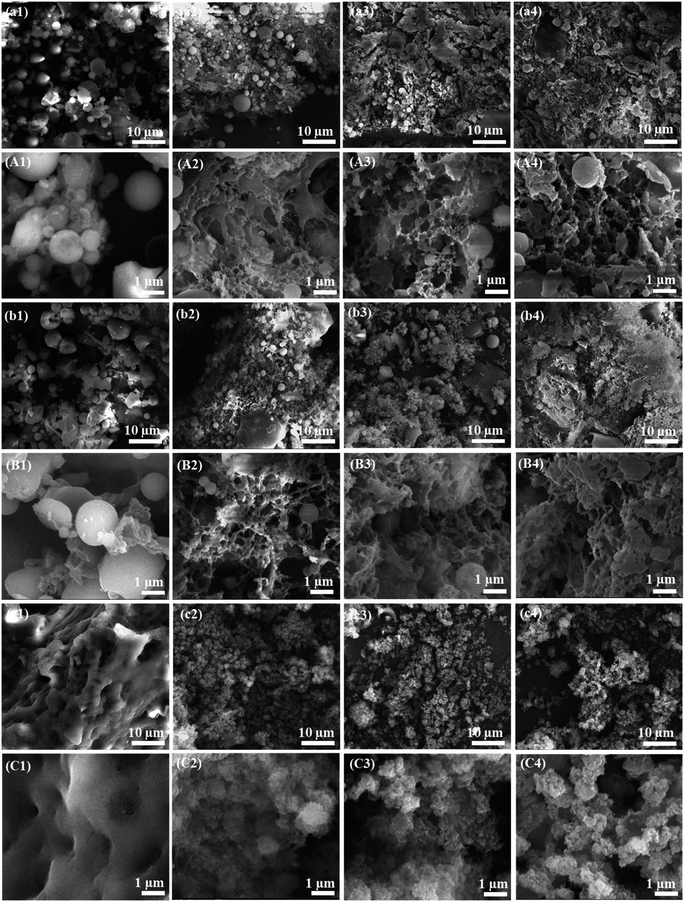
The three-dimensional open porous network structure was not observed in the crude starch-1 (Fig. 4a1 and A1), crude starch-2 (Fig. 4b1 and B1), and protein (Fig. 4c1 and C1) extracts. Additionally, the presence of globules in the crude starch-1 and crude starch-2 extracts indicated the presence of calcium carbonate in the samples.41 This was also confirmed by the high crystalline peaks observed in the XRD patterns (Fig. 5). Since calcium carbonate is not soluble in water, it was collected in crude starch-1 and crude starch-2 fractions, and was not present in the protein fraction after extraction. Calcium carbonate is commonly used to enhance the milling of rice at the industrial scale.42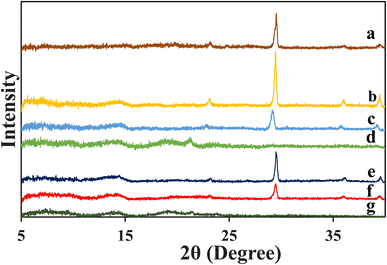 | ||
| Fig. 5 XRD patterns of (a) rice bran, (b) crude starch-1, (c) crude starch-2, and (d) protein extracts, and aerogels formed using 15% (w/w) (e) crude starch-1, (f) crude starch-2, and (g) protein. | ||
The crude starch-1, crude starch-2, and protein aerogels exhibit a three-dimensional open porous network with interconnected fibrils, which became denser as concentration increased from 10 to 20% (Fig. 4). The SEM images of protein aerogels at high magnifications (Fig. 4C2–4) revealed a more globular structure due to strong repulsive forces of protein molecules.16 The presence of fiber in the crude starch-2 aerogel revealed a significant difference in the macrostructure as compared to that of the crude starch-1 aerogel. The findings were further justified using surface area, pore size, density, and porosity, as discussed in Table 2. Likewise, aerogels from wheat, corn, and pea starches showed a similar three-dimensional open porous structure.11,15 FitzPatrick et al. revealed a porous network formed using canola seed protein aerogels.16 Therefore, gels with 15% concentration were further optimized based on their ability to maintain the gel structures better than the 10% gels and their lower densities compared to the 20% gels.
| Samples | Surface area (m2 g−1) | Pore size (nm) | Pore volume (cm3 g−1) | Density (g cm−3) | Porosity (%) | Shrinkage (%) |
|---|---|---|---|---|---|---|
| a Means in the same column that do not share a common letter are significantly different (p < 0.05). | ||||||
| Crude starch-1 | 19.72 ± 0.19c | 21.68 ± 1.37a | 0.103 ± 0.001b | 0.25 ± 0.01a | 86.43 ± 0.77a | 47.31 ± 2.72b |
| Crude starch-2 | 21.26 ± 0.89b | 18.01 ± 0.75b | 0.094 ± 0.001c | 0.22 ± 0.01b | 87.09 ± 0.39a | 26.17 ± 2.33c |
| Protein | 25.25 ± 0.83a | 21.56 ± 2.12a | 0.130 ± 0.001a | 0.26 ± 0.01a | 81.80 ± 0.16b | 57.62 ± 1.38a |
3.4. Surface area, pore size, pore volume, porosity, and shrinkage
As discussed above, 15% (w/w) crude starch-1, crude starch-2, and protein aerogels were used for further characterization. BET surface area, BJH pore size and pore volume of these aerogels are reported in Table 2. Among the aerogels, the protein aerogels showed the highest surface area of 25.25 ± 0.83 m2 g−1 and pore volume of 0.13 ± 0.01 cm3 g−1. However, crude starch-1 showed the lowest surface area (19.72 ± 0.19 m2 g−1), and lowest pore volume (0.09 ± 0.00 cm3 g−1). The textural properties depend on the starch type, amylose content, and amylose/amylopectin ratio. Ubeyitogullari and Ciftci generated wheat starch (15%) aerogels with a higher surface area (∼60 m2 g−1), which might be due to the different approach followed for hydrogel formation (e.g., gelatinization at 120 °C), and the use of a different type of starch.11,43 Wang et al. reported 17.3 m2 g−1 surface area in a corn starch aerogel.43 In a previous study, the egg white protein aerogel's surface area highly depended on the pH, where the lowest surface area (16 m2 g−1) was reported at pH values closer to the isoelectric point.44The surface areas of the aerogels obtained in this study were lower than the ones reported in the literature, which was mostly due to the differences in the gel formation step (magnetic stirrer vs. high-shear mixer), and type/source of the materials (i.e., rice bran starch and protein). For example, gel formation with a high-shear mixer resulted in a more porous structure compared to that with a magnetic stirrer in our previous study.12 In addition, the purities of the starch and protein extracts were relatively low as described in Section 3.2, which may have also negatively affected the gelatinization/gelation in forming a porous network.
The results indicated that crude starch-1 and protein aerogels have the highest densities of 0.25 and 0.26 g cm−3, respectively, compared to the crude starch-2 aerogel (0.22 g cm−3) (p < 0.05). Additionally, the crude starch-1 (86%) and crude starch-2 (87%) aerogels showed higher porosities than protein aerogels (82%). Similar densities were previously reported for aerogels from canola protein (∼0.2 g cm−3), whey protein (0.22 g cm−3), and egg white (∼0.3 g cm−3).16,17,44 Likewise, the densities of starch aerogels from wheat (0.23 g cm−3) and maize (0.24 g cm−3) were comparable to the data reported here for rice bran starch aerogels.15,45 The crude starch-1 and protein revealed higher shrinkages of 47 and 58%, respectively, compared to crude starch-2 (26%). The reduced shrinkage of crude starch-2 could be due to its higher fiber content, which might have supported the structure during solvent exchange and drying. This finding also supports the lower surface area of crude starch-1 in comparison with that of crude starch-2.
3.5. Crystallinity
XRD patterns of the extracts and aerogels (prepared with 15% concentration) are depicted in Fig. 5. The results indicated the presence of calcium carbonate in the rice bran sample, as evidenced by four major diffraction peaks at 2θ = 23.25°, 29.51°, 35.98°, and 39.44°.46 Similarly, calcium carbonate crystalline peaks were highly visible in the rice bran crude starch-1 and crude starch-2 extract and aerogels, which supported the data obtained by SEM (Fig. 4). In addition, the extracted crude starch-1 showed high-intensity crystalline peaks in the 2θ range of 15° to 23°, which corresponded to A-type and B-type patterns.47–49 Additionally, the protein samples showed diffraction peaks at 2θ = 7.24°, 9.64°, 13.78°, 14.38°, 18.88°, 21.2°, and 23.89°. Lu et al. revealed a high crystallinity of starch due to the formation of complexes between starch and hydrophobic peptides.48 However, gelatinization caused a transformation of A-type and B-type crystalline peaks, resulting in a decrease in the degree of crystallinity.11 A similar deformation of crystalline peaks was observed in wheat starch and corn starch aerogels.11,50 Therefore, the reduced crystallinity observed in aerogels was mainly due to structural changes that occurred during gelatinization/gelation and retrogradation. These findings are consistent with the previously reported studies related to the formation of starch and protein aerogels.26,513.6. Chemical interactions
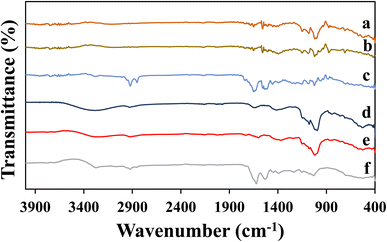
The functional groups of extracts and aerogels (15% concentration) were determined using ATR-FTIR (Fig. 6). The characteristic peaks at 1240 cm−1 and 1255 cm−1 revealed the strong C-N amide bonding, while the peak at 1720 cm−1 corresponded to the strong C![[double bond, length as m-dash]](https://www.rsc.org/images/entities/char_e001.gif) O bonding (Fig. 6a–c). Additionally, the peaks at 1060 cm−1 and 1120 cm−1 indicated strong bonding of C–O stretching in both extract and aerogels. Furthermore, the region at around 1200–1400 cm−1 in the FTIR spectrum of the protein extract (Fig. 6c) contributed strongly towards –OH deformation. Also, a strong contribution of aromatic bands at around 900–1250 cm−1 was observed in crude starch and protein extracts (Fig. 6a–c). For crude starch-1 and crude starch-2 extracts, C–H alkanes were observed at 2925 cm−1.52 The peaks at 1047 and 1022 cm−1 indicate the crystalline and amorphous region in crude starch-1, and the peak ratio of 1047 cm−1/1022 cm−1 indicates short-range molecular order where a lower ratio was observed in the aerogels after the gelatinization of native starch. This decrease in the 1047/1022 cm−1 ratio indicated a decrease in the order degree of the double helical structure.53 The N–H bond peaks at 1180 cm−1 in Fig. 6a and b justified the presence of some proteins in crude starch extracts. Moreover, the findings showed a more ordered short-range structure formation after gelatinization and shifting of peaks in crude starch to 3325 cm−1, indicating stronger hydrogen bonding interactions between protein and starch. Lu et al. revealed absorption peak shifting to 3389–3306 cm−1, indicating the strong interaction between rice protein and starch by hydrogen bonding during their co-gelatinization.48
O bonding (Fig. 6a–c). Additionally, the peaks at 1060 cm−1 and 1120 cm−1 indicated strong bonding of C–O stretching in both extract and aerogels. Furthermore, the region at around 1200–1400 cm−1 in the FTIR spectrum of the protein extract (Fig. 6c) contributed strongly towards –OH deformation. Also, a strong contribution of aromatic bands at around 900–1250 cm−1 was observed in crude starch and protein extracts (Fig. 6a–c). For crude starch-1 and crude starch-2 extracts, C–H alkanes were observed at 2925 cm−1.52 The peaks at 1047 and 1022 cm−1 indicate the crystalline and amorphous region in crude starch-1, and the peak ratio of 1047 cm−1/1022 cm−1 indicates short-range molecular order where a lower ratio was observed in the aerogels after the gelatinization of native starch. This decrease in the 1047/1022 cm−1 ratio indicated a decrease in the order degree of the double helical structure.53 The N–H bond peaks at 1180 cm−1 in Fig. 6a and b justified the presence of some proteins in crude starch extracts. Moreover, the findings showed a more ordered short-range structure formation after gelatinization and shifting of peaks in crude starch to 3325 cm−1, indicating stronger hydrogen bonding interactions between protein and starch. Lu et al. revealed absorption peak shifting to 3389–3306 cm−1, indicating the strong interaction between rice protein and starch by hydrogen bonding during their co-gelatinization.48
3.7. Thermal stability
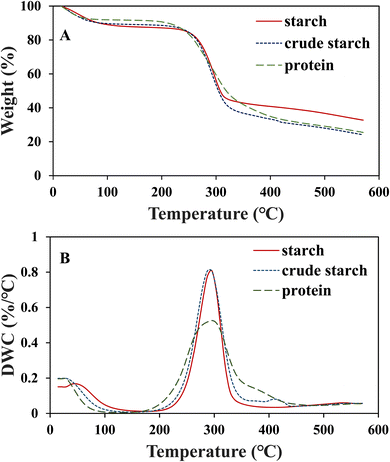
The thermal stabilities of 15% (w/w) crude starch-1, crude starch-2, and protein aerogels are shown in Fig. 7. The first weight loss was observed in the range of 21–120 °C for protein, crude starch-1, and crude starch-2 aerogels due to moisture loss. Major thermal degradation occurred at 295 °C for all the samples. While crude starch-1 and crude starch-2 aerogels were degraded in the range of 225–350 °C, the protein aerogel showed a wider range of 200–420 °C. At 295 °C, the percentage losses in weight were 42, 48, and 53% for crude starch-1, crude starch-2, and protein aerogels, respectively. After the weight loss, the remaining corresponds to the final char and ash content, resulting in 33% for crude starch-1, 24% for crude starch-2, 26% for protein aerogels, which are comparable to the values (∼22%) reported for rice bran.54 A similar weight loss of 45% in rice bran starch was reported by Fabian et al. at 302 °C, and Hasanvand and Rafe reported 62% weight loss in the rice bran protein at 316 °C.37,55 Overall, the developed aerogels' ability to maintain stability at high temperatures can broaden their potential applications where thermal treatment/processing is required.3.8. Water solubility
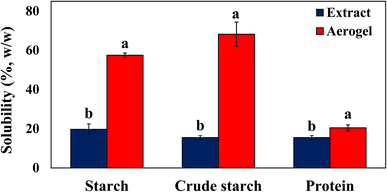
The water solubilities of crude starch-1, crude starch-2, and protein extracts and aerogels are depicted in Fig. 8. The crude starch-1 (57.47 ± 1.13%) and crude starch-2 (68.21 ± 6.22%) aerogels exhibited significantly higher solubilities in water as compared to their extracts (19.74 ± 2.71% for crude starch-1 and 15.53 ± 0.99% for crude starch 2) (p < 0.05), indicating an increase in the amorphous part in the aerogels (Fig. 5).56 Similarly, the solubility of proteins increased from 16 to 20% after the formation of aerogels. The increase in water solubility after forming the aerogels was mainly related to the gelatinization/gelation steps during aerogel formation, which resulted in reduced crystallinity.51 The amorphous structure has higher solubility due to its higher free energy.56 The hydrogen bonding interactions in Fig. 6 also justify the increases in the solubilities of aerogels. Previously, the solubility of rice bran was reported to be from 7.3–8% by Bhosale and Vijayalakshmi.57 Fabian et al. observed an increase in the solubility of starch from 8 to 15% as the temperature increases from 70 to 90 °C due to the leaching of branched molecules into linear molecules.37,58 Tang et al. observed that the solubility of rice bran protein is lower (∼10%) closer to the isoelectric point; however, as the pH increases from pH 6 to pH 12, the protein solubility increases to 66%.594. Conclusions
This study illustrated the results of compositional, textural, and morphological analyses of defatted rice bran for aerogel production using a green and sustainable approach based on SC-CO2 drying. The rice bran consisted of starch (32%), protein (14%), oil (13%), ash (15%), and a low moisture content (3%). The SEM images revealed the three-dimensional open porous structure network structure of the aerogels produced using 15% of crude starch-1, crude starch-2, and protein. Compared to crude starch-1 and crude starch-2 aerogels, protein aerogels showed a higher surface area of 25 m2 g−1, and pore volume of 0.13 cm3 g−1. Crude starch-1 (0.25 g cm−3 and 86%), crude starch-2 (0.22 g cm−3 and 87%), and protein (0.26 g cm−3 and 82%) aerogels exhibited low densities with high porosities, respectively. The solubilities of crude starch-1, crude starch-2, and protein increased after aerogel formation due to the gelatinization step. Overall, this study reveals a green approach for generating starch and protein aerogels, without extensive separation and purification steps to generate gel formation raw materials from defatted rice bran. The high surface area and porous structure, along with the high fiber content, make the generated aerogels great candidates for delivering bioactive compounds and developing functional foods. This is one of the first studies on the formation of aerogels from defatted rice bran, and therefore, the surface area of the aerogels can be further increased by investigating the gel formation step of aerogel formation.Author contributions
Sumanjot Kaur: data curation, formal analysis, methodology, investigation, visualization, writing-original draft; Jingyi Chen: methodology, formal analysis, resources, writing-review & editing; Ali Ubeyitogullari: conceptualization, methodology, investigation, resources, project administration, supervision, writing-review & editing.Conflicts of interest
The authors declare no conflict of interest.Acknowledgements
This project was supported in part by the USDA National Institute of Food and Agriculture, Multistate Project NC1023, Accession number 1025907, and the University of Arkansas Graduate Student Professional Congress (GPSC) research grant. We also thank Dr Chris Mazzanti for his help with ATR-FTIR measurements.References
- M. Friedman, J. Agric. Food Chem., 2013, 61, 10626–10641 CrossRef CAS.
- K. Tomita, S. Machmudah, Wahyudiono, R. Fukuzato, H. Kanda, A. T. Quitain, M. Sasaki and M. Goto, Sep. Purif. Technol., 2014, 125, 319–325 CrossRef CAS.
- B. Jha, R. Chandra, V. K. Vijay, P. M. V. Subbarao and A. Isha, Biomass Bioenergy, 2020, 140, 105674 CrossRef CAS.
- A. A. Mariod, H. A. Adamu, M. Ismail and N. Ismail, Grasas Aceites, 2010, 61, 409–415 CrossRef CAS.
- T. Jalili, R. E. C. Wildman and D. M. Medeiros, J. Nutraceuticals Funct. Med. Foods, 2000, 2, 19–34 CrossRef.
- I. Lima, H. Guraya and E. Champagne, Food/Nahrung, 2002, 46, 112–117 CrossRef.
- E. Malik, S. R. Dennison, F. Harris and D. A. Phoenix, Pharmaceuticals, 2016, 9(4), 67 CrossRef.
- M. E. El-Naggar, S. I. Othman, A. A. Allam and O. M. Morsy, Int. J. Biol. Macromol., 2020, 145, 1115–1128 CrossRef CAS.
- C. A. García-González, M. Alnaief and I. Smirnova, Carbohydr. Polym., 2011, 86, 1425–1438 CrossRef.
- M. Tudu and A. Samanta, Eur. Polym. J., 2023, 184, 111801 CrossRef CAS.
- A. Ubeyitogullari and O. N. Ciftci, Carbohydr. Polym., 2016, 147, 125–132 CrossRef CAS PubMed.
- S. Ahmadzadeh and A. Ubeyitogullari, Carbohydr. Polym., 2023, 301, 120296 CrossRef CAS.
- M. Guastaferro, E. Reverchon and L. Baldino, Front. Bioeng. Biotechnol., 2021, 9, 688477 CrossRef.
- C. A. García-González, M. C. Camino-Rey, M. Alnaief, C. Zetzl and I. Smirnova, J. Supercrit. Fluids, 2012, 66, 297–306 CrossRef.
- C. A. García-González and I. Smirnova, J. Supercrit. Fluids, 2013, 79, 152–158 CrossRef.
- S. E. FitzPatrick, S. Deb-Choudhury, S. Ranford and M. P. Staiger, Eur. Polym. J., 2022, 168, 111126 CrossRef CAS.
- L. Manzocco, S. Plazzotta, J. Powell, A. de Vries, D. Rousseau and S. Calligaris, Food Hydrocolloids, 2022, 122, 107117 CrossRef CAS.
- J. C. Arboleda, M. Hughes, L. A. Lucia, J. Laine, K. Ekman and O. J. Rojas, Cellulose, 2013, 20, 2417–2426 CrossRef CAS.
- Z. Y. Ju, N. S. Hettiarachchy and N. Rath, J. Food Sci., 2001, 66, 229–232 CrossRef CAS.
- R. Gnanasambandam and N. S. Hettiarachchy, J. Food Sci., 1995, 60, 1066–1069 CrossRef CAS.
- L. Wang and Y.-J. Wang, Cereal Chem., 2001, 78, 690–692 CrossRef CAS.
- R. He, Y. Wang, Y. Zou, Z. Wang, C. Ding, Y. Wu and X. Ju, J. Sci. Food Agric., 2020, 100, 2638–2647 CrossRef CAS.
- K. X. Zhang, K. Y. Zhang, T. J. Applegate, S. P. Bai, X. M. Ding, J. P. Wang, H. W. Peng, Y. Xuan, Z. W. Su and Q. F. Zeng, Poult. Sci., 2020, 99, 1001–1009 CrossRef CAS.
- D. Zhang, L. Wang, B. Tan and W. Zhang, Int. J. Food Sci. Technol., 2020, 55, 2188–2196 CrossRef CAS.
- F. Ye, L. Xiao, Y. N. Liang, Y. Zhou and G. Zhao, Carbohydr. Polym., 2019, 213, 79–88 CrossRef CAS.
- S. Ahmadzadeh and A. Ubeyitogullari, Carbohydr. Polym., 2023, 301, 120296 CrossRef CAS.
- S. Dey, N. Hettiarachchy, A. A. Bisly, K. Luthra, G. G. Atungulu, A. Ubeyitogullari and L. A. Mozzoni, J. Food Sci., 2022, 87, 4808–4819 CrossRef CAS PubMed.
- A. Ubeyitogullari and O. N. Ciftci, RSC Adv., 2016, 6, 108319–108327 RSC.
- Y. Sun, Z. Wu, B. Hu, W. Wang, H. Ye, Y. Sun, X. Wang and X. Zeng, Carbohydr. Polym., 2014, 108, 153–158 CrossRef CAS PubMed.
- T. Wang, J. D. Jones, I. I. Niyonshuti, S. Agrawal, R. K. Gundampati, T. K. S. Kumar, K. P. Quinn and J. Chen, Adv. Ther., 2019, 2, 1900092 CrossRef CAS.
- R. M. Saunders, Cereal Foods World, 1990, 35, 632–636 Search PubMed.
- C. Fabian and Y.-H. Ju, Crit. Rev. Food Sci. Nutr., 2011, 51, 816–827 CrossRef CAS.
- A. Abdul-Hamid and Y. S. Luan, Food Chem., 2000, 68, 15–19 CrossRef CAS.
- B. S. Luh, in Cereals Processing Technology, Elsevier, 2001, pp. 79–108 Search PubMed.
- R. Vaitkeviciene, J. Bendoraitiene, R. Degutyte, M. Svazas and D. Zadeike, Polymers, 2022, 14(17), 3662 CrossRef CAS PubMed.
- T. P. Singh and D. S. Sogi, Starch – Stärke, 2018, 70, 1700242 CrossRef.
- C. Fabian, A. Ayucitra, S. Ismadji and Y.-H. Ju, J. Taiwan Inst. Chem. Eng., 2011, 42, 86–91 CrossRef CAS.
- M. Alexandri, J. López-Gómez, A. Olszewska-Widdrat and J. Venus, Fermentation, 2020, 6(2), 42 CrossRef CAS.
- C. Kalpanadevi, V. Singh and R. Subramanian, J. Food Sci. Technol., 2018, 55, 2259–2269 CrossRef CAS PubMed.
- A. Ubeyitogullari and O. N. Ciftci, Food Hydrocolloids, 2020, 102, 105597 CrossRef CAS.
- M. Reis, M. Brito Sousa, F. Alobaid, C. Bertran and Y. Wang, Adv. Powder Technol., 2018, 29, 1571–1581 CrossRef CAS.
- R. M. Saunders, Food Rev. Int., 1985, 1, 465–495 CrossRef CAS.
- Y. Wang, M. He, Y. Wu, Y. Liu and J. Ouyang, Starch - Stärke, 2021, 73, 2000161 CrossRef CAS.
- I. Selmer, C. Kleemann, U. Kulozik, S. Heinrich and I. Smirnova, J. Supercrit. Fluids, 2015, 106, 42–49 CrossRef CAS.
- G. M. Glenn and D. W. Irving, Cereal Chem., 1995, 72, 155–161 CAS.
- A. Rahman and T. Oomori, J. Cryst. Growth, 2008, 310, 3528–3534 CrossRef.
- L. Niu, L. Wu and J. Xiao, Carbohydr. Polym., 2017, 175, 311–319 CrossRef CAS.
- X. Lu, R. Ma, J. Zhan, Z. Jin and Y. Tian, NPJ Sci. Food, 2022, 6, 37 CrossRef PubMed.
- H. F. Zobel, Starch – Stärke, 1988, 40, 1–7 CrossRef CAS.
- N. Abhari, A. Madadlou and A. Dini, Food Chem., 2017, 221, 147–152 CrossRef CAS.
- A. Ubeyitogullari and O. N. Ciftci, Carbohydr. Polym., 2016, 147, 125–132 CrossRef CAS.
- D. Muscat, R. Adhikari, M. J. Tobin, S. McKnight, L. Wakeling and B. Adhikari, Carbohydr. Polym., 2014, 111, 333–347 CrossRef CAS PubMed.
- A. Ubeyitogullari, S. Brahma, D. J. Rose and O. N. Ciftci, J. Agric. Food Chem., 2018, 66, 9490–9497 CrossRef CAS PubMed.
- E. Pereira, S. Einloft, M. Seferin, L. M. dos Santos, J. Lima and R. Ligabue, Waste Biomass Valorization, 2019, 10, 755–762 CrossRef CAS.
- E. Hasanvand and A. Rafe, Food Biophys., 2018, 13, 387–395 CrossRef.
- N. J. Babu and A. Nangia, Cryst. Growth Des., 2011, 11, 2662–2679 CrossRef CAS.
- S. Bhosale and D. Vijayalakshmi, Curr. Res. Nutr. Food Sci. J, 2015, 3, 74–80 Search PubMed.
- V. Singh, H. Okadome, H. Toyoshima, S. Isobe and K. I. Ohtsubo, J. Agric. Food Chem., 2000, 48, 2639–2647 CrossRef CAS PubMed.
- S. Tang, N. S. Hettiarachchy, R. Horax and S. Eswaranandam, J. Food Sci., 2003, 68, 152–157 CrossRef CAS.
| This journal is © The Royal Society of Chemistry 2024 |

