 Open Access Article
Creative Commons Attribution 3.0 Unported Licence
A facile coprecipitation approach for synthesizing LaNi0.5Co0.5O3 as the cathode for a molten-salt lithium–oxygen battery†
Qianyuan
Qiu
 a,
Jiaqi
Wang
ab,
Penghui
Yao
a and
Yongdan
Li
 *a
*a
aDepartment of Chemical and Metallurgical Engineering, Aalto University, Kemistintie 1, FI-00076 Aalto, Finland. E-mail: yongdan.li@aalto.fi
bFlexible Printed Electronic Technology Center and State Key Laboratory of Advanced Welding and Joining, Harbin Institute of Technology, Shenzhen 518055, China
First published on 19th June 2023
Abstract
The cathode of a lithium–oxygen battery (LOB) should be well designed to deliver high catalytic activity and long stability, and to provide sufficient space for accommodating the discharge product. Herein, a facile coprecipitation approach is employed to synthesize LaNi0.5Co0.5O3 (LNCO) perovskite oxide with a low annealing temperature. The assembled LOB exhibits superior electrochemical performance with a low charge overpotential of 0.03–0.05 V in the current density range of 0.1–0.5 mA cm−2. The battery ran stably for 119 cycles at a high coulombic efficiency. The superior performance is ascribed to (i) the high catalytic activity of LNCO towards oxygen reduction/evolution reactions; (ii) the increased temperature enabling fast kinetics; and (iii) the LiNO3–KNO3 molten salt enhancing the stability of the LOB operating at high temperature.
Introduction
Highly efficient and environmentally benign energy storage technologies are attractive because of the ever-growing energy demand.1,2 Lithium-ion batteries (LIBs) have played a significant role in mobile phone, portable electronic device, and electric vehicle propulsion markets.3 However, the energy density of LIBs is not high enough due to the nature of the intercalation chemistry. Therefore, tremendous efforts have been devoted to new energy storage technologies, e.g., redox flow batteries, Li–S batteries, and metal–air batteries.4–6 As typical metal–air batteries, rechargeable lithium–oxygen batteries (LOBs) have generated great interest since Ogasawara et al.7 demonstrated the reversible decomposition of Li2O2 in a LOB in 2006. A LOB is composed of a Li metal anode, a lithium-conducting separator, an electrolyte, and a porous catalytic cathode.8 Compared to LOBs with an organic electrolyte, LOBs with an inorganic LiNO3–KNO3 molten-salt electrolyte achieved enhanced stability.9 Due to the elevated operating temperature, a high rate and high energy density are enabled. In fact, the thermodynamically-favored discharge product at >150 °C is Li2O, instead of Li2O2 that is produced at ambient temperature (5.2 kW h kgcathode−1vs. 3.5 kW h kgcathode−1).The cathode reactions, involving the generation and decomposition of discharge product during the discharge and charge steps, are complex and sluggish since the corresponding oxygen reduction reaction (ORR) and oxygen evolution reaction (OER) take place at a triple-phase boundary.10–12 The sluggish kinetics result in a high overpotential, low round-trip efficiency, and poor cycle stability, and impede the practical application of LOBs.13,14
So far, several categories of cathode catalysts, for instance, doped carbon,15 metal–nanocarbon composites,16 noble metals,17 metal oxides,18 organometallic compounds,19 and perovskite materials20–22 have been developed for LOBs. Perovskite materials are supposed to be one of the most promising categories of catalysts for the cathode reaction in LOBs due to their unique electronic, ionic, catalytic, and eco-friendly properties. Perovskites have a general formula of ABO3, where the A site is an atom of a rare-earth or alkaline earth metal, and the B site is a transition metal atom.20 The LaNiO3 perovskite is one of the most widely investigated catalytic materials for various electrochemical applications.23 Porous LaNiO3 nanocubes were first employed as the cathode catalyst in a LOB in 2014.24 With this catalyst, the charge overpotential was reduced by up to 0.35 V at 0.08 mA cm−2. After that, sulfur, nitrogen and cobalt were doped to further enhance the catalytic activity.25–27 With such a B-site substitution, the hybridization between Ni 2d and O 2p orbitals is enhanced and more oxygen vacancies generated. The amount of Ni3+ is increased, which promotes the covalency of the B–O bonds.
LaNi0.5Co0.5O3 (LNCO) is an efficient bifunctional catalyst for the OER and ORR. Several approaches have been developed to synthesize LNCO, such as hydrothermal, sol–gel, and pyrolysis methods, and the synthesized materials have been employed for high-performance LOBs.28,29 However, the mentioned methods require high annealing temperature, high pressure, and special apparatus, as well as other harsh reaction conditions. In addition, these methods usually lead to large particle sizes (micron range), and limited productivity. In our previous work, we synthesized micron-sized LNCO through a sol–gel method and utilized it as the cathode catalyst in a molten-salt LOB, which delivered superior electrochemical performance and long-term stability. However, the loading weight of the LNCO catalyst was as high as 64 mg cm−2, leading to a relatively low mass energy density.28
Herein, a coprecipitation method is employed to synthesize nano-sized LNCO in order to reduce the loading weight of the catalyst and develop a facile approach to enhance productivity. With this method, the calcination temperature is greatly reduced so that the particle size of LNCO decreases to 35 nm. A binder-free LNCO composite cathode is prepared for a LOB with a loading mass as low as 1 mg cm−2. The battery exhibits a comparative performance to a high-LNCO-mass-loading LOB.
Experimental
A facile coprecipitation route was adopted to synthesize spherical LNCO perovskite oxide particles. 0.433 g of La(NO3)3·6H2O, 0.145 g Ni(NO3)2·6H2O and 0.145 g Co(NO3)2·6H2O were dispersed in 80 mL DI water with ultrasonication for 10 min. 0.3 g NaOH was dissolved in 20 mL DI water. Then the NaOH solution was added to the mixed La–Ni–Co solution, followed with stirring for 4 h at 60 °C. The resulting precipitate was centrifuged and washed 3 times. Then the obtained powder was dried and calcined at 650 °C for 2 h. Finally, a black powder LNCO sample was obtained.1 mg LNCO was mixed with 1 mg LiNO3–KNO3 (42![[thin space (1/6-em)]](https://www.rsc.org/images/entities/char_2009.gif) :
:![[thin space (1/6-em)]](https://www.rsc.org/images/entities/char_2009.gif) 58 molar ratio) and pressed between two stainless-steel meshes with a physical area of 1.13 cm2 at 200 MPa for 1 minute to make a sandwich-structured cathode. The composite cathode was further dried at 160 °C to remove water and form a thin molten nitrate layer on the LNCO nanoparticles before transferring into a glove box.
58 molar ratio) and pressed between two stainless-steel meshes with a physical area of 1.13 cm2 at 200 MPa for 1 minute to make a sandwich-structured cathode. The composite cathode was further dried at 160 °C to remove water and form a thin molten nitrate layer on the LNCO nanoparticles before transferring into a glove box.
500 μL of a LiNO3–KNO3 (42![[thin space (1/6-em)]](https://www.rsc.org/images/entities/char_2009.gif) :
:![[thin space (1/6-em)]](https://www.rsc.org/images/entities/char_2009.gif) 58 molar ratio) aqueous solution with a concentration of 0.25 g mL−1 was dropped onto a glass-fiber separator (Grade GF/A, Whatman). The glass fiber was dried at 160 °C under vacuum and transferred into the glove box. The mass loading of the molten salt was 125 ± 10 mg per disc.
58 molar ratio) aqueous solution with a concentration of 0.25 g mL−1 was dropped onto a glass-fiber separator (Grade GF/A, Whatman). The glass fiber was dried at 160 °C under vacuum and transferred into the glove box. The mass loading of the molten salt was 125 ± 10 mg per disc.
A homemade cell apparatus was assembled with a Li metal foil, a glass fiber filled with nitrate salts and LNCO, as the anode, separator, and cathode, respectively. Oxygen was pumped into the cell and sealed at around 2 bars. Then the cell was transferred into an oven and heated to 160 °C. A LANHE testing station was used to measure the electrochemical performance at current densities in a range of 0.1–0.5 mA cm−2 within a potential range of 2.6–3.5 V. The electrochemical impedance spectra of the cell were measured with a multichannel potentiostat (AMETEK, USA). The frequency range was 0.01–105 Hz with an amplitude of 10 mV.
The battery after the test was disassembled in the glove box. The detached cathode was rinsed with N-methylacetamide solvent to remove the nitrate salts. The treated LNCO was then dried under vacuum at 60 °C to remove the solvent completely.
The morphologies of LNCO at different discharge states were confirmed with a Hitachi S-3700 scanning electron microscope (SEM). Powder X-ray diffraction (XRD) patterns were acquired with an X’PERT PRO MPD Alpha1 instrument equipped with a PIXcel1D detector with Cu-Kα radiation. An analytical transmission electron microscope (TEM) EOL JEM-2800 was used at 200 kV to record the micrographs. An X-ray photoelectron spectrometer (XPS; Omicron Nanotechnology GmbH surface analysis system) was applied to analyze the elemental composition with a photon energy of 1486.7 eV, Al Kα X-ray source. All the binding energies were corrected with the C 1s peak located at 284.6 eV.
Results
As shown in Fig. 1a, a facile coprecipitation method was applied to synthesize the nano-LNCO. Once NaOH solution was added to the precursor solution, a greenish-white precipitate formed. After centrifugation and calcination, well-crystallized LNCO was obtained. The XRD results in Fig. 1b show that LNCO has a perovskite structure, with no impurity phase. The XRD pattern is in good agreement with JCPDS No. 01-073-2813. The as-synthesized LNCO exhibits high crystallinity and well-defined symmetry. Fig. 1c clearly shows the morphology of the as-synthesized LNCO. The LNCO catalyst has a relatively smooth surface. All the particles are uniformally nano-sized with a spherical shape.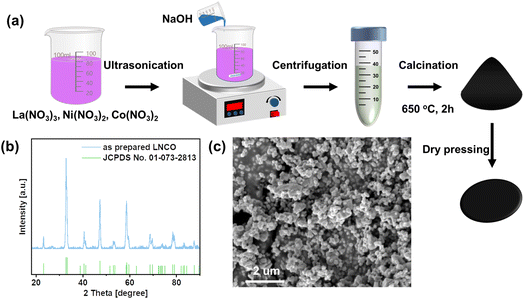 | ||
| Fig. 1 (a) Synthesis steps for nano-LNCO cathode through the coprecipitation route. (b) XRD pattern of LNCO. (c) SEM micrograph of LNCO. | ||
The TEM images of LNCO also revealed that this perovskite oxide was prepared successfully. In Fig. 2a, grains of the parent LNCO material are observed with a diameter of around 35 nm. Fig. 2b features a high-resolution TEM micrograph of a typical LNCO nanoparticle, highlighting an ordered arrangement of the crystallites. These crystallites consist of well-defined planes, which correlates with the expected LNCO (110) plane, characterized by a measured d-spacing of 0.27 nm. This value is within the experimental error of the theoretical d-spacing for the (110) plane, which is 0.272 nm (JCPDS 01-073-2813). Although these planes are pronounced, the overall monocrystalline continuity was hindered by the grain growth of the neighboring crystallites, indicating polycrystallinity of the LNCO particles. Fig. 2c is the image of LNCO nanoparticles at a larger scale, and its corresponding EDS spectrum is provided in Fig. S2.† Elements existing in the sample are La, Ni, Co, while the Cu signal emanates from the underlying wafer. Fig. 2d–g are the corresponding elemental mapping images, indicating a homogenous distribution of La, Ni, Co and O in the sample.
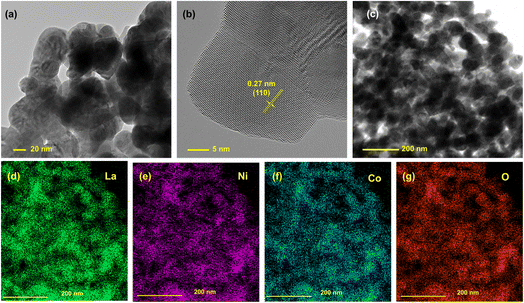 | ||
| Fig. 2 (a) TEM image, (b) HR-TEM image, (c) area used for measuring the element distribution spectrum (EDS) and (d–g) corresponding EDS mapping images of the LNCO sample. | ||
The elemental composition of LNCO was identified with XPS. The survey spectrum indicates the presence of La, Ni, Co and O on the surface (Fig. 3a). La 3d5/2 can be assigned to the peaks at 834.1 eV and 837.3 eV, and La 3d3/2 to the peak at 850.3 eV. Ni 2p3/2 and Ni 2p1/2 can be assigned to the two peaks at 854.2 eV and 873.9 eV, respectively (Fig. 3b). These two peaks of Ni 2p are further deconvoluted to show a bimodal feature, indicating the existence of Ni3+/Ni2+ species. Similarly, Co 2p3/2 and Co 2p1/2 can be assigned to the peaks at 778.4 eV and 793.7 eV, respectively (Fig. 3c). These two peaks of Ni 2p are further deconvoluted to show a bimodal feature, indicating the existence of Co3+/Co2+ species.
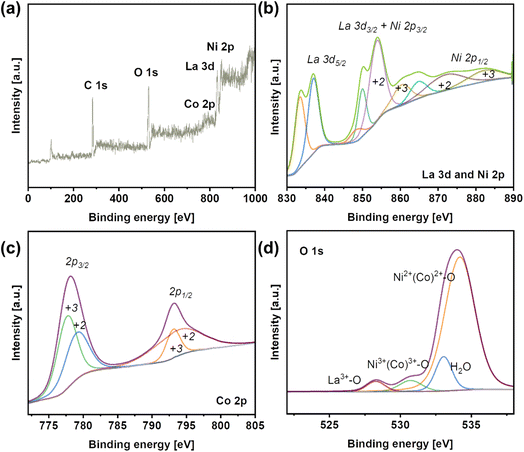 | ||
| Fig. 3 (a) X-ray photoelectron spectroscopy (XPS) survey spectrum of LNCO. (b) XPS spectra of La 3d and Ni 2p in LNCO. (c) XPS spectra of Co 2p in LNCO. (d) XPS spectra of O 1s. | ||
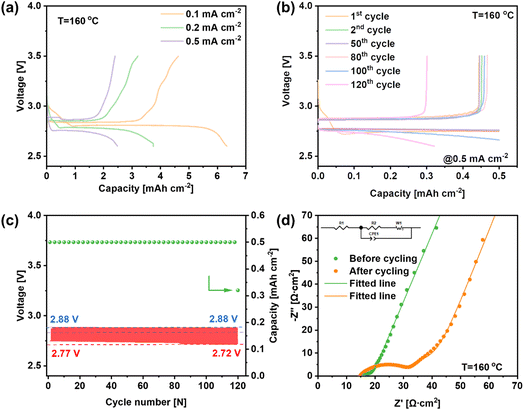
The electrochemical testing of LNCO was carried out in a molten-salt LOB using a homemade cell mold, assembled with a Li metal anode, a glass fiber containing LiNO3–KNO3 electrolyte, and a LNCO composite cathode. Fig. 4a shows the discharge and recharge profiles of the LOB at constant current in a potential range of 2.6–3.5 V, and the current densities are 0.1, 0.2 and 0.5 mA cm−2. The discharge capacities of the battery are 6.33, 3.75 and 2.48 mA h cmcathode−2 at 0.1, 0.2 and 0.5 mA cm−2, respectively. The discharge plateaus are quite stable, which were maintained at 2.81, 2.78 and 2.75 V. As the current density increases, the discharge plateaus decrease slightly and the discharge overpotentials were 20, 50 and 80 mV, respectively (the theoretical open-circuit voltage of this LOB is 2.83 V at 160 °C). During the recharge step, the recharge plateaus initially remain stable with a low potential, followed by a rapid increase of the potential during the final recharge stage. The recharge potentials are 2.86, 2.87 and 2.88 V at the mid-recharge stage, resulting in charge overpotentials of 30, 40 and 50 mV at 0.1, 0.2 and 0.5 mA cm−2, respectively. The battery exhibited coulombic efficiencies (CEs) of 73.0%, 85.3% and 96.8% for 0.1, 0.2 and 0.5 mA cm−2, respectively, indicating a higher reversibility of the LOB along with the increase of current density. Fig. 4b reveals the discharge and charge profiles of the LOB during the stability test. During the whole stability test, the limited discharge capacity was set as 0.5 mA h cm−2, and the potential range was set from 2.6 to 3.5 V. During the cycling test, the discharge performance was stable without obvious degradation for the first 119 cycles. The discharge curves almost overlap with each other, revealing the high stability of the LOB with the LNCO-catalyst cathode. However, the battery deteriorated suddenly on the 120th cycle. The discharge capacity dropped to 0.32 mA h cmcathode−2 and the recharge capacity was 0.30 mA h cmcathode−2. Fig. 4c reveals that the mid-discharge voltage decreases from 2.77 V to 2.72 V, while the mid-charge voltage remains stable at 2.88 V. Thus, the overall potential increases from 110 mV to 150 mV during the cycling test. Furthermore, electrochemical impedance spectroscopy (EIS) was carried out before and after the cycling test, as shown in Fig. 4d. As can be seen, the equivalent series resistance was relatively small. After the cycling test, the ohmic resistance of the battery almost remained the same compared with the pristine one, indicating that the whole setup stayed stable. The diameter of the semicircle corresponds to the charge-transfer resistance (R2). After cycling, R2 increased remarkably from 7.27 Ω cm2 to 16.44 Ω cm2, indicating an incomplete decomposition of the discharge products formed and accumulated during the cycling.30
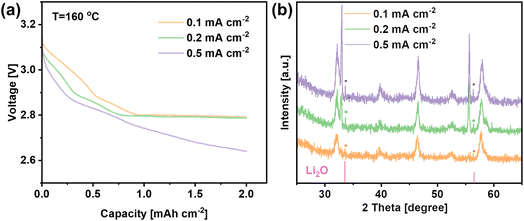
In order to identify the discharge products, the LNCO cathode was discharged to 2 mA h cmcathode−2 with different current densities as shown in Fig. 5a, and the corresponding XRD patterns of the cathode are plotted in Fig. 5b. The XRD results show peaks at 33.7° and 56.5° corresponding to the (111) and (113) crystal planes of Li2O (JCPDS 98-018-2025), which is the expected discharge product of a molten-salt LOB operating at 160 °C. Interestingly, Fig. 5b shows that the intensity of the peaks for the Li2O phase increases when the discharge current density increased.
To observe the morphology of the Li2O discharge product, SEM analysis was carried out on the same cathodes. Fig. 6a–c show that Li2O was formed on the surface of the cathode despite different current densities being applied. In Fig. 6a, Li2O with a flocky and flocculent appearance was generated at 0.1 mA cm−2. When the current density increased, the discharge product became disc-shaped at 0.2 mA cm−2 and became thinner, but denser, when the current density was further increased to 0.5 mA cm−2 (Fig. 6b and c). Fig. 6d reveals that the LNCO remained stable during cycling, and the morphology of the LNCO catalyst remained unchanged after 120 cycles.
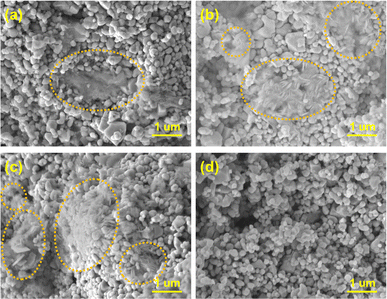 | ||
| Fig. 6 SEM images of LNCO and the corresponding morphologies of the discharge product discharged at (a) 0.1 mA cm−2, (b) 0.2 mA cm−2, (c) 0.5 mA cm−2, and (d) after the cycling test at 0.5 mA cm−2. | ||
Discussion
The reasons for superior electrochemical performance
The battery exhibits superior electrochemical performance, delivering a large discharge capacity, high reversibility, and long cycling life. The mentioned performance is attributed to the following reasons:(i) The good catalytic activities of LNCO nanoparticles. LNCO is one of the promising candidates in oxide electrodes because of its high electrical conductivity and thermal stability. Notably, the electrical conductivity is as high as 1.9 × 10³ S cm−1.31,32 This high electric conductivity allows fast electric and ionic transfer on its surface during the ORR and OER processes. Celorrio et al.33 proposed that the key chemical properties of a La-based perovskite (LaBO3) are mainly affected by the B-site atom instead of La. On the LNCO surface, Ni3+/Ni2+ and Co3+/Co2+ redox couples coexist and promote charge transfer between surface cations and adsorbates (Fig. 3).28 There are a few works that reveal that LNCO is a bifunctional catalyst in LOBs. The electrochemical properties of the as-prepared LNCO are compared and summarized in Table 1. LNCO synthesized by the facile coprecipitation method delivers a similar electrochemical performance to the other LNCO samples that were synthesized with other, more complex, synthesis methods. One-step calcination can greatly reduce the energy loss during the synthesis process. Furthermore, the as-prepared LNCO with nano-sized particles delivers more active sites for catalytic reactions compared with the micro-sized LNCO.28 Through this facile method, the loading weight of the catalyst is greatly reduced, which is conducive to the practical application of this perovskite oxide in LOBs.
| Material | Calcination temperature (°C) | Structure | Specific capacity (mA h cm−2 @ mA cm−2) | Discharge overpotential (mV @ mA cmcathode−2) | Charge overpotential (mV @ mA cmcathode−2) | Cycling life | Ref. |
|---|---|---|---|---|---|---|---|
| LNCO, 1 mg cm−2 | 650 | Spherical particles with size of 35 nm | 6.33 @ 0.1 | 20 @ 0.1 | 30 @ 0.1 | 120 | This work |
| 80 @ 0.5 | 50 @ 0.5 | ||||||
| LNCO, 64 mg cm−2 | 1100 | Spherical particles with size of 825 nm | 7.96 @ 0.1 | 20 @ 0.1 | 30 @ 0.1 | 100 | 28 |
| 100 @ 0.5 | 40 @ 0.5 | ||||||
| LNCO, 0.4 mg cm−2 | 900 | Yolk–shell structured microspheres | 9.02 @ 0.08 | 210 @ 0.08 | 360 @ 0.08 | 150 | 29 |
(ii) The battery system was operated at an elevated temperature 160 °C. According to the Arrhenius equation, the increase of the temperature from 20 to 160 °C leads to a significant increase of the reaction rate. It is one of the reasons that the battery can be operated at a high current density with low overpotential during the discharge and charge steps. Another benefit is that Li2O instead of Li2O2 is the discharge product at this temperature. An LOB based on Li2O as the product theoretically delivers a higher energy density than that of a LOB based on Li2O2 (5.2 kW h kgcathode−1vs. 3.5 kW h kgcathode−1).34
(iii) The battery utilised an inorganic electrolyte instead of an organic one. The reaction steps involving oxygen in LOBs containing a Li+-conducting organic liquid electrolyte have been intensively investigated. With an organic electrolyte, electrolyte decomposition, and side reactions between the electrolyte, cathode and discharge product, often occur.35 The side reactions generate side products, like the insoluble and insulating product Li2CO3, which therefore passivate the battery during cycling. Tailoring the charge potential to oxidize Li2CO3 may alleviate the passivation, but a high charge potential is necessary, resulting in low round-trip efficiency.36 Even worse, highly reactive product singlet oxygen forms and the organic electrolyte seriously decomposes, which also limits the battery stability.37 Replacing the unstable organic electrolyte with LiNO3–KNO3 electrolyte solves the mentioned problems.9 Furthermore, the Li+ transference number of LiNO3–KNO3 above the eutectic melting point (125 °C) is 0.68, much larger than the Li+ transference number of LiTFSi in tetraethylene glycol dimethyl ether (TEGDME) electrolyte, as 0.47.38 With a higher Li+ transference number, the energy density and charging rate of LOBs can be improved.
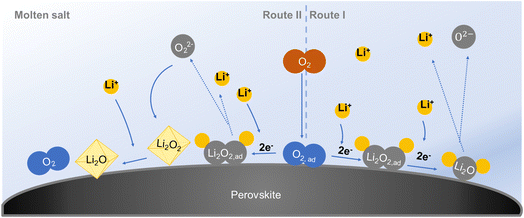
Reaction pathways
Two reaction pathways to the formation of Li2O in a 4e− transfer redox process at elevated temperature with a molten-salt electrolyte are proposed, as shown in Fig. 7. On the right side is route I, where the adsorbed oxygen reacts with Li+ and gains electrons to form Li2O2. Then the Li2O2 continuously generates and reduces to Li2O with a consecutive electron acceptance from the surface of the cathode.28 This 4e− reaction pathway is based only on the gas and solid phase, and sufficient Li+ and electrons are needed.8 On the left side is route II, where adsorbed oxygen first reacts with Li+ and accepts electrons to form Li2O2. Part of the Li2O2 cannot be converted to Li2O in time but dissolves in the electrolyte. It grows to form Li2O2 crystals after supersaturation in the electrolyte. At the working temperature, crystalline Li2O2 converts to crystalline Li2O through disproportionation.34 A critical point is that the formed Li2O2 should have enough ionic/electronic conductivity for the further formation of Li2O.39,40The morphologies of the discharge products are different when the current density changes (Fig. 6). It is assumed that the two reaction pathways both exist in the battery system and which pathway dominates the discharge step depends on the discharge current density. When the battery discharges at a low current, there is a sufficient supply of Li+ and electrons. This battery is based on fast surface reaction kinetics.41 All the discharge product Li2O will be formed in situ on the surface of the LNCO with continuous Li+ and electron acceptance via route I (eqn (1) and (2)). The generated Li2O moderately bonds to the LNCO, and free growth of Li2O is prohibited.28 Some of the Li2O is dissolved in the electrolyte as time goes by (eqn (3)), but the major part is flocky and flocculent-like Li2O, which covers the surface of the cathode (Fig. 6a). This porous discharge product tends to decompose at a low potential and provides abundant pathways for “O2 breathing”, resulting in a low overpotential, consistent with the electrochemical performance in Fig. 4a. As the current density increases, the Li+ and electrons may be insufficient to continuously realize the surface reaction, and the disproportionation occurs through route II.34 Generated Li2O2 in eqn (1) might not be converted to Li2O in time, and the concentration of Li2O2 increases. Some of the Li2O2 is dissolved in the electrolyte (eqn (4)), and supersaturation of Li2O2 results in the formation of Li2O2 nuclei, which triggers nucleation and growth of Li2O2 crystals (eqn (5)).42Eqn (6) tends to move to the right side according to Le Chatelier’s principle and thus disproportionation takes place. Crystalline Li2O2 converts into crystalline Li2O, which results in disc-like Li2O (Fig. 6b and c). Higher crystallinity Li2O easily blocks the void space between LNCO particles, leading to a decreased capacity (Fig. 4a). In the charge step, the decomposition of the highly crystalline Li2O needs a higher potential, resulting in a higher overpotential.
| 2Li+ + 2e− + O2 → Li2O2,ad | (1) |
Route 1:
| Li2O2,ad + 2Li+ + 2e− → Li2Oad | (2) |
| Li2Oad ↔ Li2Oelectrolyte | (3) |
Route 2:
| Li2O2,ad ↔ Li2O2,electrolyte | (4) |
| Li2O2,electrolyte → Li2O2,crystal | (5) |
| 2Li2O2,crystal → 2Li2O + O2 | (6) |
Conclusions
In summary, lithium–oxygen batteries (LOBs) are promising devices for next-generation energy storage systems. A facile coprecipitation route was adopted to synthesize LaNi0.5Co0.5O3 nanoparticles for the cathode of a LOB. With this material and a much reduced mass loading of LNCO catalyst, the battery delivers a comparative performance to that of our previous high-mass-loading LNCO catalyst, which was prepared via a sol–gel method. The LOB with this LNCO cathode operates at 160 °C and delivers a high discharge capacity of 6.33 mA h cmcathode−2 with a low overall overpotential of 50 mV at 0.1 mA cm−2. Furthermore, a correlation between the morphology of discharge product Li2O and the current density is observed. The porous and thin-film-like discharge product generates at low current density, while a thinner, but denser, discharge product with higher crystallinity forms at high current density. Thus, a continuous surface reaction dominates at low current density and a disproportionation pathway might play the major role at high current density.Data availability
The datasets generated and/or analyzed during the current work are available in this article and the ESI.†Author contributions
Qianyuan Qiu: conceptualization, methodology, investigation, writing – original draft. Jiaqi Wang: conceptualization, methodology. Penghui Yao: formal analysis. Yongdan Li: supervision, writing – review & editing, funding acquisition.Conflicts of interest
There are no conflicts to declare.Acknowledgements
This work was supported with an Academy of Finland project MEMBAT on 348403 and the start-up package of T10108 professorship offered by Aalto University. Q. Qiu, J. Wang and P. Yao acknowledge the financial support from the China Scholarship Council (Grant No. 201906150134, 202106120279 and 202006120046).References
- H. Kang, S. Jung, M. Lee and T. Hong, Renewable Sustainable Energy Rev., 2022, 157, 112113 CrossRef.
- A. Kalair, N. Abas, M. S. Saleem, A. R. Kalair and N. Khan, Energy Storage, 2021, 3, e135 CrossRef.
- X. Zhang, Z. Li, L. Luo, Y. Fan and Z. Du, Energy, 2022, 238, 121652 CrossRef CAS.
- D. Cao, X. Shen, A. Wang, F. Yu, Y. Wu, S. Shi, S. A. Freunberger and Y. Chen, Nat. Catal., 2022, 5, 193–201 CrossRef CAS.
- J. Yuan, C. Zhang, Q. Qiu, Z.-Z. Pan, L. Fan, Y. Zhao and Y. Li, Chem. Eng. J., 2022, 433, 133564 CrossRef CAS.
- J. Yuan, Z.-Z. Pan, Y. Jin, Q. Qiu, C. Zhang, Y. Zhao and Y. Li, J. Power Sources, 2021, 500, 229983 CrossRef CAS.
- T. Ogasawara, A. l. Débart, M. Holzapfel, P. Novák and P. G. Bruce, J. Am. Chem. Soc., 2006, 128, 1390–1393 CrossRef CAS.
- A. Kondori, M. Esmaeilirad, A. M. Harzandi, R. Amine, M. T. Saray, L. Yu, T. Liu, J. Wen, N. Shan and H.-H. Wang, Science, 2023, 379, 499–505 CrossRef CAS PubMed.
- V. Giordani, D. Tozier, H. Tan, C. M. Burke, B. M. Gallant, J. Uddin, J. R. Greer, B. D. McCloskey, G. V. Chase and D. Addison, J. Am. Chem. Soc., 2016, 138, 2656–2663 CrossRef CAS.
- C. Tan, D. Cao, L. Zheng, Y. Shen, L. Chen and Y. Chen, J. Am. Chem. Soc., 2022, 144, 807–815 CrossRef CAS.
- Q. Xia, D. Li, L. Zhao, J. Wang, Y. Long, X. Han, Z. Zhou, Y. Liu, Y. Zhang, Y. Li, A. A. A. Adam and S. Chou, Chem. Sci., 2022, 13, 2841–2856 RSC.
- W. J. Kwak, Rosy, D. Sharon, C. Xia, H. Kim, L. R. Johnson, P. G. Bruce, L. F. Nazar, Y. K. Sun, A. A. Frimer, M. Noked, S. A. Freunberger and D. Aurbach, Chem. Rev., 2020, 120, 6626–6683 CrossRef CAS.
- K. Chen, D. Y. Yang, G. Huang and X. B. Zhang, Acc. Chem. Res., 2021, 54, 632–641 CrossRef CAS PubMed.
- D. Cao, Y. Bai, J. Zhang, G. Tan and C. Wu, Nano Energy, 2021, 89, 106464 CrossRef CAS.
- H. Li, T. A. Ha, S. Jiang, C. Pozo-Gonzalo, X. Wang, J. Fang, P. C. Howlett and X. Wang, Electrochim. Acta, 2021, 377, 138089 CrossRef CAS.
- Y. Zhan, S. Z. Yu, S. H. Luo, J. Feng and Q. Wang, ACS Appl. Mater. Interfaces, 2021, 13, 17658–17667 CrossRef CAS.
- K. Song, J. Jung, M. Park, H. Park, H.-J. Kim, S.-I. Choi, J. Yang, K. Kang, Y.-K. Han and Y.-M. Kang, ACS Catal., 2018, 8, 9006–9015 CrossRef CAS.
- Y. Zhang, L. Feng, W. Zhan, S. Li, Y. Li, X. Ren, P. Zhang and L. Sun, ACS Appl. Energy Mater., 2020, 3, 4014–4022 CrossRef CAS.
- Z. Lyu, G. J. H. Lim, R. Guo, Z. Kou, T. Wang, C. Guan, J. Ding, W. Chen and J. Wang, Adv. Funct. Mater., 2019, 29, 1806658 CrossRef.
- P. Tan, M. Liu, Z. Shao and M. Ni, Adv. Energy Mater., 2017, 7, 1602674 CrossRef.
- X. Li, Z. Qian, G. Han, B. Sun, P. Zuo, C. Du, Y. Ma, H. Huo, S. Lou and G. Yin, ACS Appl. Mater. Interfaces, 2020, 12, 10452–10460 CrossRef CAS PubMed.
- H. Hou, Y. Cong, Q. Zhu, Z. Geng, X. Wang, Z. Shao, X. Wu, K. Huang and S. Feng, Chem. Eng. J., 2022, 448, 137684 CrossRef CAS.
- L. Lyu, S. Cho and Y.-M. Kang, EES Catal., 2023, 1, 230–249 RSC.
- J. Zhang, Y. Zhao, X. Zhao, Z. Liu and W. Chen, Sci. Rep., 2014, 4, 6005 CrossRef CAS PubMed.
- R. Li, J. Long, M. Li, D. Du, L. Ren, B. Zhou, C. Zhao, H. Xu, X. Wen, T. Zeng and C. Shu, Mater. Today Chem., 2022, 24, 100889 CrossRef CAS.
- H. Wang, W. Xu, S. Richins, K. Liaw, L. Yan, M. Zhou and H. Luo, Electrochim. Acta, 2019, 296, 945–953 CrossRef CAS.
- J. Zhang, C. Zhang, W. Li, Q. Guo, H. Gao, Y. You, Y. Li, Z. Cui, K. C. Jiang, H. Long, D. Zhang and S. Xin, ACS Appl. Mater. Interfaces, 2018, 10, 5543–5550 CrossRef CAS.
- Q. Qiu, Z.-Z. Pan, P. Yao, J. Yuan, C. Xia, Y. Zhao and Y. Li, Chem. Eng. J., 2023, 452, 139608 CrossRef CAS.
- J. Kim, H. Kim, S. Shin, H. W. Lee and J. H. Kim, Electrochim. Acta, 2022, 412, 140097 CrossRef CAS.
- J. Zhang, X. Chen, Y. Lei, H. Lu, J. Xu, S. Wang, M. Yan, F. Xiao and J. Xu, Chem. Eng. J., 2022, 428, 131025 CrossRef CAS.
- H. Kozuka, K. Ohbayashi and K. Koumoto, Sci. Technol. Adv. Mater., 2015, 16, 026001 CrossRef PubMed.
- H. Kozuka, K. Ohbayashi and K. Koumoto, Inorg. Chem., 2012, 51, 9259–9264 CrossRef CAS PubMed.
- V. Celorrio, E. Dann, L. Calvillo, D. J. Morgan, S. R. Hall and D. J. Fermin, ChemElectroChem, 2016, 3, 283–291 CrossRef CAS.
- C. Xia, C. Kwok and L. Nazar, Science, 2018, 361, 777–781 CrossRef CAS.
- Y. Wang and Y.-C. Lu, Energy Storage Mater., 2020, 28, 235–246 CrossRef.
- B. D. McCloskey, A. Speidel, R. Scheffler, D. C. Miller, V. Viswanathan, J. S. Hummelshoj, J. K. Norskov and A. C. Luntz, J. Phys. Chem. Lett., 2012, 3, 997–1001 CrossRef CAS PubMed.
- S. Dong, S. Yang, Y. Chen, C. Kuss, G. Cui, L. R. Johnson, X. Gao and P. G. Bruce, Joule, 2022, 6, 185–192 CrossRef CAS.
- K. M. Diederichsen, E. J. McShane and B. D. McCloskey, ACS Energy Lett., 2017, 2, 2563–2575 CrossRef CAS.
- F. Tian, M. D. Radin and D. J. Siegel, Chem. Mater., 2014, 26, 2952–2959 CrossRef CAS.
- R. Gao, X. Liang, P. Yin, J. Wang, Y. L. Lee, Z. Hu and X. Liu, Nano Energy, 2017, 41, 535–542 CrossRef CAS.
- C. Zhao, Y. Zhu, Q. Sun, C. Wang, J. Luo, X. Lin, X. Yang, Y. Zhao, R. Li, S. Zhao, H. Huang, L. Zhang, S. Lu, M. Gu and X. Sun, Angew. Chem., Int. Ed., 2021, 60, 5821–5826 CrossRef CAS.
- M. J. Welland, K. C. Lau, P. C. Redfern, L. Liang, D. Zhai, D. Wolf and L. A. Curtiss, J. Chem. Phys., 2015, 143, 224113 CrossRef PubMed.
Footnote |
| † Electronic supplementary information (ESI) available. See DOI: https://doi.org/10.1039/d3fd00078h |
| This journal is © The Royal Society of Chemistry 2024 |

