 Open Access Article
Valorization of cheese whey: closing the loop from protein extraction to whey protein film composting
Maialen
Uribarrena
a,
Eric
Rovira-Cal
bc,
Leire
Urbina
d,
Maria Jose
Suárez
d,
Enrique
Aymerich
bc,
Pedro
Guerrero
 ae,
Koro
de la Caba
 *ae and
Alaitz
Etxabide
*a
aBIOMAT Research Group, University of the Basque Country (UPV/EHU), Engineering College of Gipuzkoa, Plaza de Europa 1, 20018, Donostia-San Sebastián, Spain. E-mail: koro.delacaba@ehu.es; alaitz.etxabide@ehu.eus
bCEIT Basque Research and Technology Alliance (BRTA), Manuel Lardizabal 15, 20018 Donostia-San Sebastián, Spain
cUniversidad de Navarra, Tecnun, Manuel Lardizabal 13, 20018 Donostia-San Sebastián, Spain
dGaiker Basque Research and Technology Alliance (BRTA), Parque Tecnológico, Ed. 202, 48170 Zamudio, Spain
eBCMaterials, Basque Center for Materials, Applications and Nanostructures, UPV/EHU Science Park, 48940, Leioa, Spain
First published on 22nd February 2024
Abstract
Whey protein extracted from cheese-making by-products was analysed as a potential alternative for both food waste valorisation and food packaging waste reduction. Whey protein was ultrafiltered from local cheese whey and used for film manufacture via compression moulding. The physicochemical characterization of the extracted protein showed that the purity of the extracted protein was 91.6% wt. FTIR and XRD analyses, as well as SEM images, revealed the presence of lactose in the extracted protein. The solubility of the films made in water indicated that whey protein films would be suitable for packaging fatty foods, e.g. cheese, thus following the circular economy strategy. Furthermore, since the biodegradability of the films was higher than 70% after 48 h under composting conditions, it can be concluded that whey protein films are rapidly compostable in any industrial composting facility, highlighting the more sustainable character of these films. Finally, the environmental assessment confirmed that the film manufacturing process was the stage contributing the most to the environmental impact and, thus, this step should be optimised to reduce the environmental footprint of the films developed.
1. Introduction
As the Earth's population grows, food industry production is increasing to meet the demands in the market, leading at the same time to a drastic rise in the amount of food waste. The dairy industry is a clear example of this. Owing to the continuous manufacturing of this kind of product, plenty of by-products are produced, especially whey, a watery product obtained in cheese-making and casein-based dairy processes.1 Of all the milk required for cheese manufacture, around 80–90% of it becomes whey, producing approximately 180–190 million tonnes every year worldwide.2,3 Because of the requests of consumers for coagulated milk products, the generation of whey has increased by 1–2% annually,4,5 reaching amounts of 187–206 million tonnes of waste per year.6 The discharges of cheese production are disposed directly into the land or water and are hazardous for the environment as whey can cause an excess of oxygen consumption, impermeabilization, eutrophication and toxicity in the area where it is disposed.7 Thus, treatment prior to effluent discharge is recommended. To reduce the whey concentration in the effluents, some industries stored the cheese waste in tanks and discharged it into the municipal sewage system. However, it was discovered that even diluted, waste could affect biological process even after being stored in wastewater treatment plants.7 Since the main problem of whey is its massive quantity, an effort must be made to reduce the waste damage to nature, and new appealing possibilities need to be explored to decrease its release, giving a second valuable life to this by-product and minimizing its impact.The cheese industry produces about 145 Mt of whey annually, of which 54% is re-used in the food system, 60 Mt are used as feed, fertilizer or waste, and 6 Mt are destined for non-food uses.8 Whey contains a lot of nutrients and whey powder can be used as an additive or supplement in many food products and diets.9 However, this option is not enough to considerably reduce the waste volume. Therefore, more innovative studies were required. Among them, some have shown the potential of whey digestion to obtain biogas for power and the capacity of its protein to be used as bioplastics.9 This last application has gained much attention in recent years, as it can also arise as an alternative to tackle the problem of packaging. In this context, whey protein-based edible films have been prepared for food and drug packaging.10,11 Zhang et al.12 developed a composite film using seed gum along with whey protein to modify physical and mechanical properties. For the preservation of chestnuts, the development of chitosan/whey protein composite films was carried out.13 Nevertheless, these studies are just focused on one part of the whole process, with no further examination of the method employed for the extraction of the protein or the impact that these new procedures could have on the environment. These aspects are essential to prove the sustainability of the new material. With this aim, a complete study of whey protein-based films, from the extraction of the protein to the biodegradation of the film, considering the film manufacture, was carried out in this work. The environmental analysis of the whole process was also assessed. For that, the films were prepared using the whey protein extracted from whey obtained from a local farm. To the best of our knowledge, no similar study has been conducted to study the environmental impact of the whole process, including protein extraction, protein-based film processing, and the end of life of the film after disposal with the aim of identifying those steps that could be improved from an environmental point of view. Therefore, this work could provide further knowledge for decision-making to reduce the environmental impacts associated with both food waste and packaging waste, being crucial towards more sustainable alternatives in the food chain in line with the circular bioeconomy.
2. Materials and methods
2.1 Materials
The whey (W) used in this study to extract local whey protein (L-WP) was collected from the Urruela SC farm in the Basque Country. This biowaste was selected for its accessibility and availability. Specifically, whey was collected by NEIKER from the Soloitza cheese factory, located in Respaldiza (Álava). As provided by NEIKER, whey has a pH of 6.4 and a density of 1.0363 g cm−3. In addition, commercial whey protein (C-WP), provided by Nutrition Chefs (Spain) and with a purity of 99.6%, was used to compare the amino acid composition.For film preparation, glycerol and NaOH 1 M were purchased from Panreac (Spain) and applied as a plasticizer and a pH modifier, respectively. Type II water (Wasserlab, Spain) was used as a solvent.
For aerobic biodegradation determination, ripe compost (no more than 3 months old) from composted horse manure (BioLurra brand) was sieved at 5 mm to be used as inoculum, as well as microcrystalline cellulose (MCC) powder, with a particle size >20 μm (Sigma Aldrich, Spain), as a reference material.
2.2 Whey protein extraction and physicochemical characterization
For whey protein separation, Amicon® Stirred Cell 400 mL – Millipore was used for ultrafiltration with a 5 kDa cellulosic membrane (Ultracel® 5 kDa Ultrafiltration discs, Regenerated Cellulose 76 mm diameter – Millipore), operating at 3.75 bar of pressure. Proteins were recovered from the cell with distilled water trying to recover the remains in the cell walls and on the membrane surface to minimise protein losses.The amino acid analysis of the whey used in this study, the extracted whey protein and the commercial whey protein was performed with a Biochrom 30+ amino acid analyser physio-logical system (Biochrom, UK), which has a reproducibility with a coefficient of variation lower than 0.5%.
An ALPHA II FTIR spectrometer (Bruker, Spain) equipped with attenuated total reflectance (ATR) crystal (ZnSe) was used to obtain FTIR spectra in the infrared absorption frequency range from 4000 to 800 cm−1. A total of 32 spectral scans were conducted and the resolution was set to 4 cm−1.
2.3 Film preparation
Films were prepared using a compression moulding technique. Local whey protein (10 g) was dissolved in Type II water (100 mL) at 80 °C for 30 min under magnetic stirring (200 rpm) and then, glycerol was added (50 wt% on whey protein dry basis). The pH was adjusted to 10 with 1 M NaOH to avoid the isoelectric point (pI ∼ 5) and so, to prevent the aggregation of whey protein.14,15 The solution was heated at 80 °C for other 30 min under stirring for homogenization and then freeze-dried (Alpha 1–4 LDplus, CHRIST, Germany) for 48 h. The powder obtained was thermally compressed at 3 MPa for 2 min, using a hydraulic press (Specac, Spain), previously heated up to 105 °C. The obtained films were conditioned at 25 °C and 50% relative humidity for 48 h in a controlled bio-chamber (ACS Sunrise 700 V, Spain) before testing.2.4 Film characterization
The film thickness was measured to the nearest 0.001 mm with a hand-held QuantuMike digital micrometer (Mitutoyo Spain, Spain).The colour parameters (L*, a* and b* of the CIELAB colour space) of the films were measured using a CR-400 Minolta Chroma Meter (Konica Minolta, Spain) colourimeter: L* = 0 (black) to L* = 100 (white), −a* (greenness) to +a* (redness), and –b* (blueness) to +b* (yellowness).
A PANalytic Xpert Pro (PANalytical, The Netherlands) instrument was employed to collect XRD patterns at 40 kV, 40 mA, and an X-ray wavelength of 1.5418 Å in the 2θ range from 2.5° to 50.0°.
A Hitachi S-4800 scanning electron microscope (SEM, Hitachi High-Technologies Corporation, Japan) was used to visualize the surface and cross-sectional morphologies of the films. First, the samples were placed in a metallic stub and coated with gold under vacuum under an argon atmosphere. Then, an acceleration voltage of 15 kV was used for SEM analysis.
Mechanical properties of the films (4.75 mm × 22.25 mm, bone shape) were measured with a TA.XT plusC (Stable microsystems) texturometer, according to ASTM D882-02. Tensile tests were conducted with a load cell of 50 N and a crosshead rate of 1 mm min−1.
The water contact angle (WCA) of the films was measured using a Dataphysics contact angle OCA (DataPhysics, Spain) instrument. 3 μL distilled water was added dropwise onto the film surface and the drop image was captured using SCA20 software.
Water vapour permeability (WVP) measurements were carried out in a controlled humidity environment chamber PERME™ W3/0120 (Labthink Instruments Co. Ltd, China). Each film was cut into samples of 7.4 cm diameter (test area of 33 cm2). The films were maintained at a temperature of 38 °C and relative humidity of 90%, according to ASTM E96-00, and the WVP was determined gravimetrically until constant weight.
Thermogravimetric analysis, TGA (Mettler Toledo TGA/SDTA 851, Madrid, Spain), was performed from 25 to 800 °C and differential scanning calorimetry, DSC (Mettler Toledo DSC 822) was conducted from 5 to 180 °C. Both assays were carried out at 10 °C min−1 under an inert atmosphere to avoid oxidation reactions.
Film solubility was analysed in a simulant for hydrophilic foods (Type II water) and in a simulant for lipophilic foods (95% v/v ethanol).16 The films were weighed (W0) and immersed into 30 mL of the simulant at 22 °C for 24 h. After that, the specimens were taken off simulants and left to dry before reweighing (Wt). The solubility of the films was calculated from the weight loss (W0 − Wt) with reference to the initial mass (W0).
2.5 Film biodegradation
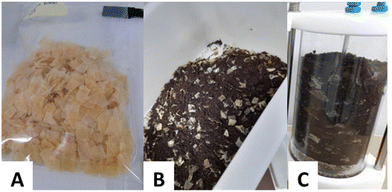
The moisture content (MC) and total organic carbon (TOC) values for the film samples, cellulose and compost were determined before the test. For TOC characterization, a Shimadzu SSS-500 coupled with a solid sample module was used. TOC results were expressed as a percentage of the total organic carbon of the sample dried after correction with the percentage of moisture content.Duplicate bioreactors of 2 L capacity were prepared with the mixture of the compost and the film sample (previously cut at 2 mm2). A total of 53.8 g of the film was put into each bioreactor to achieve the minimum of 20 g TOC, as recommended by the ISO 14855 standard. Additionally, deionized water was added to the bioreactor to ensure the correct humidity level during the test (100% relative humidity). The total volume of the mixture of the compost and the film sample was around two-thirds of the bioreactor vessels to allow manual stirring of the mixture during the incubation period (Fig. 1).
Duplicates of blank bioreactors containing only compost and containing a mixture of compost and MCC (6![[thin space (1/6-em)]](https://www.rsc.org/images/entities/char_2009.gif) :
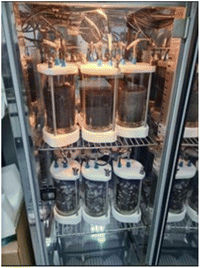
:![[thin space (1/6-em)]](https://www.rsc.org/images/entities/char_2009.gif) 1) were also prepared. The 6 bioreactor vessels were closed and incubated with additional samples of bioplastic films at 58 ± 2 °C under a continuous flow of humidified air in the corresponding cabinet of the ECHO analyzer system (ECHO instruments, Slovenia) (Fig. 2). The humidity of the bioreactor vessel was checked during that period and water was added when required. Additional stirring was also carried out within the first weeks.
1) were also prepared. The 6 bioreactor vessels were closed and incubated with additional samples of bioplastic films at 58 ± 2 °C under a continuous flow of humidified air in the corresponding cabinet of the ECHO analyzer system (ECHO instruments, Slovenia) (Fig. 2). The humidity of the bioreactor vessel was checked during that period and water was added when required. Additional stirring was also carried out within the first weeks.
Biodegradability was determined by measuring the carbon dioxide (CO2) produced by the sample under controlled composting conditions according to modified ISO 14855-1:2012. The percentage of CO2 generated inside the reactors was measured in duplicate using an ER12 respirometer (ECHO instruments, Slovenia). The theoretical amount of CO2 that could be generated from the sample (CO2Th) was estimated from its carbon content as follows:
The percentage of biodegradation was calculated assuming that all the carbon in the sample was converted into CO2:
2.6 Environmental analysis
The environmental impacts of the films were assessed considering the whey protein extraction, film manufacturing and film industrial composting stages. SimaPro 9.2.0.1 software (Barcelona, Spain) was used following the ISO 14040 guidelines and recommendations. For that, the Ecoinvent v3 database was used to obtain the data on energy production, transport, and production of chemicals. The Hierarchist version of ReCiPe 2016, midpoint (H) v1.05, was used to calculate the environmental impacts associated with the whey protein extraction, film manufacturing and composting processes. First, the functional unit was selected as 10 g of film. Then, in the inventory stage, the materials used (whey, whey protein, NaOH, glycerol, and water) and the energy (electricity) consumed were considered.3. Results and discussion
3.1. Physicochemical characterization of whey and whey protein
Ultrafiltration is a process able to separate compounds from a liquid stream depending on their molecular weight when passing through a membrane with a certain Molecular Weight Cut-Off (MWCO).17 The lower the MWCO is, the more selective the process can be, but the pressure needed increases, making it more energy-consuming and slower. When aiming to separate proteins from cheese whey, it is important to know the molecular weight of the most abundant proteins of cheese whey. β-Lactoglobulin (18–37 kDa), α-lactalbumin (14 kDa) and proteose-peptone (4–80 kDa) account for 87% of the total cheese whey proteins.18 Therefore, a 5 kDa MWCO membrane was chosen to ensure a maximum recovery yield of 87%.Two fractions were obtained from the ultrafiltration process. A filtered cheese whey with a content reduced in protein and a purified fraction mainly composed of protein. The results can be seen in Table 1. The initial macromolecular composition of cheese whey was 10.3% (w/w) proteins and 89.7% (w/w) sugars. The protein recovery in the purified fraction was 83.3%, while the lactose was reduced by 92.4%. Protein purity increased from 10.3% (w/w) to 55.5% (w/w) during the ultrafiltration step. Even though cheese whey contained a great amount of sugar, the concentration of lactose after the first filtration step was 5.72 g L−1, which was still high and could interfere with the posterior process of film formation. For this reason, a second step of ultrafiltration was applied to further increase the protein purity. The second filtration showed similar yields of protein recovery (82.5%) and sugar removal (90.6%) to the first step, being able to increase the protein content up to 91.6% (w/w), which is a very high purity, similar to commercial whey protein isolates.19
| Cheese whey (W) | First permeate | Second permeate (L-WP) | |
|---|---|---|---|
| Proteins (g L−1) | 8.57 | 7.15 | 5.90 |
| Sugars (g L−1) | 75.00 | 5.72 | 0.54 |
| Protein recovery (%) | — | 83.3 | 82.5 |
| Protein content (%) | 10.3 | 55.5 | 91.6 |
| Sugars elimination (%) | — | 92.4 | 90.6 |
The amino acid composition of whey and whey protein depends mainly on the original composition of the starting milk and the processing techniques used in cheese production.20–22 Taking the above into consideration, the amino acid composition of the whey (W) used in this study, as well as that of the local whey protein (L-WP) extracted from cheese whey, were analyzed and compared to that of a commercial whey protein (C-WP). As can be seen in Table 2, the amino acids with the highest presence were glutamic acid, aspartic acid, alanine and leucine, while arginine, histidine and cysteine were present in the lowest amounts in all the analysed samples.
| Amino acid | % in W | % in L-WP | % in C-WP |
|---|---|---|---|
| Aspartic acid | 11.55 | 11.35 | 11.58 |
| Threonine | 5.79 | 6.47 | 6.71 |
| Serine | 6.79 | 7.03 | 7.16 |
| Glutamic acid | 17.67 | 16.78 | 16.59 |
| Proline | 7.42 | 7.66 | 7.50 |
| Glycine | 5.53 | 3.71 | 3.41 |
| Alanine | 9.39 | 8.90 | 9.51 |
| Cysteine | 1.34 | 1.43 | 1.43 |
| Valine | 5.06 | 5.65 | 5.62 |
| Methionine | 1.08 | 1.86 | 1.70 |
| Isoleucine | 4.17 | 4.63 | 4.75 |
| Leucine | 8.62 | 9.21 | 9.07 |
| Tyrosine | 1.82 | 2.25 | 2.46 |
| Phenylalanine | 2.86 | 2.83 | 2.64 |
| Histidine | 1.53 | 1.47 | 1.39 |
| Lysine | 8.48 | 7.56 | 7.54 |
| Arginine | 0.90 | 1.20 | 0.92 |
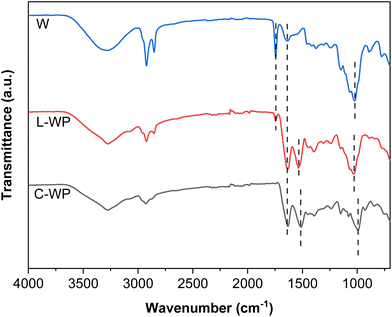
Regarding FTIR analysis (Fig. 3), C-WP showed the characteristic bands of proteins associated with the peptide bonds: amide I at 1640 cm−1, corresponding to the carbonyl (C![[double bond, length as m-dash]](https://www.rsc.org/images/entities/char_e001.gif) O) stretching; amide II at 1540 cm−1, associated with the N–H bond bending; and amide III at 1240 cm−1, associated with the C–N bond stretching; additionally, the band centred around 1000 cm−1 was related to the presence of sugars in commercial whey proteins. In the case of whey (W), the characteristic protein bands were also observed, with a lower intensity, and an additional band at around 1740 cm−1, associated with the ester groups of the whey fats was observed,23,24 indicating the need for a separation process to obtain the whey protein. L-WP extracted from cheese whey (W) showed the characteristic bands of the protein: amide I (1630 cm−1) and amide II (1545 cm−1), as well as the presence of lactose (1090 cm−1), as also observed for C-WP.
O) stretching; amide II at 1540 cm−1, associated with the N–H bond bending; and amide III at 1240 cm−1, associated with the C–N bond stretching; additionally, the band centred around 1000 cm−1 was related to the presence of sugars in commercial whey proteins. In the case of whey (W), the characteristic protein bands were also observed, with a lower intensity, and an additional band at around 1740 cm−1, associated with the ester groups of the whey fats was observed,23,24 indicating the need for a separation process to obtain the whey protein. L-WP extracted from cheese whey (W) showed the characteristic bands of the protein: amide I (1630 cm−1) and amide II (1545 cm−1), as well as the presence of lactose (1090 cm−1), as also observed for C-WP.
3.2. Optical and morphological properties of L-WP films
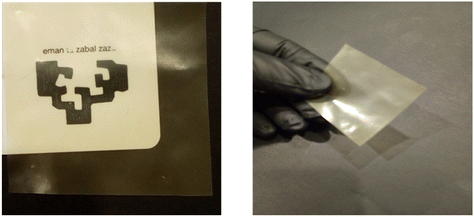
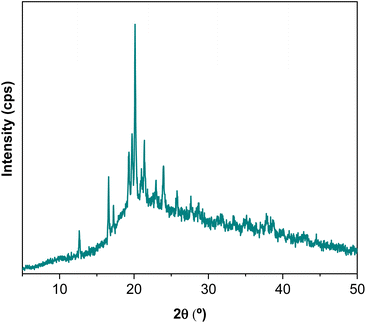
The films obtained with L-WP were transparent, flexible and easy to handle, as can be seen in the photographs shown in Fig. 4. The films had 143.8 ± 39.7 μm thickness and a pale yellow colour, as indicated by the b* colour parameter (22.5 ± 4.6). Additionally, films showed high brightness values (88.9 ± 2.2) and negative a* values (−1.3 ± 0.6).As for the XRD pattern of whey protein films (Fig. 5), a broad weak peak at around 2θ = 10° and a more-intense less-broad peak at around 2θ = 20° confirmed the amorphous structure of L-WP films. In addition, XRD results showed the presence of carbohydrates since the characteristic peaks for different crystal types of lactose could be observed through the sharp and intense band around 2θ = 20°.25
Regarding SEM analysis, the films exhibited a homogeneous surface without cracks and pores (Fig. 6A). Some material agglomerates were spotted, reflecting uneven regions, which were related to the presence of lactose in whey protein (Fig. 6B), as also shown by FTIR and XRD results. As for the internal structure (Fig. 6C), the cross-section exhibited heterogeneous bulk. These results can be related to the protein composition26 since different compounds, such as lipids and carbohydrates, were present in whey protein, as seen in FTIR spectra.
 | ||
| Fig. 6 SEM images of (A) the surface with a 1.00 mm scale bar, (B) the surface with a 10 μm scale bar, and (C) the cross-section of L-WP films. | ||
3.3. Mechanical and barrier properties of the films
Mechanical properties of the films are shown in Table 3, where the values of tensile strength (TS) and elongation at break (EB) are specified. It is worth noting that the films were flexible and easy to handle due to the physical interactions between whey protein and the plasticizer, glycerol, by hydrogen bonding, which facilitates the film processing by compression and provides the film with flexibility. L-WP films showed similar EB values to some commercial PHA plastics27 while TS values are lower, probably due to the heterogeneous structure observed by SEM (Fig. 6C). This property could be improved by different treatments, such as inducing crosslinking or adding natural fillers as reinforcement.28,29| Film | Mechanical properties | Barrier properties | ||
|---|---|---|---|---|
| L-WP | TS (MPa) | EB (%) | WCA (°) | WVP ×107 (kg (m s Pa)−1) |
| 1.0 ± 0.1 | 16.3 ± 3.4 | 95.0 ± 2.8 | 4.8 ± 1.3 | |
Regarding barrier properties, also shown in Table 3, the water contact angle of the films determines the hydrophobic or hydrophilic characteristics of the films. Contact angle values greater than 90° are characteristic of hydrophobic surfaces, whereas WCA values lower than 90° are characteristic of hydrophilic surfaces.30 L-WP films exhibited water contact angles of 95°, indicating the hydrophobic character of the film surface. Despite the hydrophobic surface of the films, the water vapour permeability value was similar to those observed for other biopolymeric films.31 Taking into account that the diffusion process must be considered in the permeability behaviour, this result would confirm the presence of polar groups in the inner structure of the film.
3.4. Thermal properties and film solubility
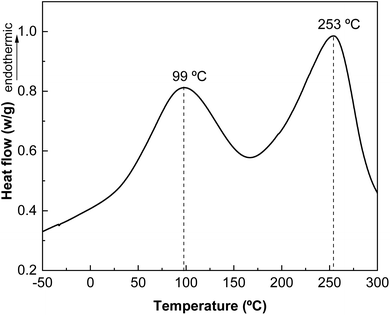
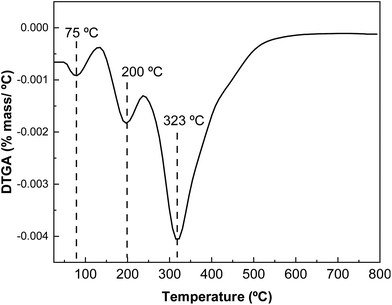
The results obtained by differential scanning calorimetry (DSC) analysis are shown in Fig. 7. Changes in intra- and intermolecular interactions between protein chains are responsible for protein denaturation, which is related to the peaks observed by DSC. As shown in Fig. 7, there are two endothermic peaks corresponding to the denaturation of the most abundant protein fractions in whey protein: β-lactoglobulin and α-lactoalbumin. The denaturation peak of the lower molecular weight protein fraction appears at 99 °C and that associated with the thermal denaturation of the higher molecular weight protein fraction at 253 °C.The derivative curve of the thermogravimetric analysis (DTGA) shows different thermal degradation zones (Fig. 8). The first thermal degradation zone, near 100 °C, corresponds to the moisture in the samples; the second degradation zone, at 180 °C, is associated with carbohydrates present in the protein; and the highest degradation temperature at 325 °C, corresponds to the protein, indicating the high thermal stability of L-WP.
Finally, in relation to a potential application of the films for food packaging, the films were tested in two food simulants. The films were soluble in water, while partially soluble (48.2 ± 1.6%) in ethanol at 22 °C, as shown in Table 4. These solubility outcomes were related to the high content of polar amino acids (e.g., glutamic and aspartic acids) in whey protein,32,33 as shown in Table 1. A possible way to decrease the solubility of these films could be via a sugar (lactose) and protein (whey) crosslinking reaction, known as the Maillard reaction,34 which could be promoted by heating. The current results indicate that films would be suitable for packaging lipophilic foods such as cheese. In that case, a circular economy strategy could be followed since the whey protein used in this work was extracted from the whey obtained as biowaste from cheese production.
| Food simulant | Type of food | Solubility (%) |
|---|---|---|
| Water | Hydrophilic | 100 |
| 95% EtOH | Lipophilic | 48.2 ± 1.6 |
3.5. Biodegradation analysis
With regards to sustainability criteria, the analysis of film biodegradation is a key issue to confirm the suitability of these whey protein films as greener food packaging alternatives. As mentioned above, moisture content (MC) and total organic carbon (TOC) were determined for film samples, cellulose and compost before the biodegradation test and values are shown in Table 5. Additionally, the pH of the compost was measured by preparing a mixture of compost and deionized water (1![[thin space (1/6-em)]](https://www.rsc.org/images/entities/char_2009.gif) :
:![[thin space (1/6-em)]](https://www.rsc.org/images/entities/char_2009.gif) 5) with continuous agitation and the value obtained was 8. The content of solid volatiles in the compost was also determined by calculating the percentage of the total weight loss of the dried samples after being heated at 550 °C for 24 h and the result was 58.08%. These results confirm that the compost used complied with the requirements of the ISO 14855 standard.
5) with continuous agitation and the value obtained was 8. The content of solid volatiles in the compost was also determined by calculating the percentage of the total weight loss of the dried samples after being heated at 550 °C for 24 h and the result was 58.08%. These results confirm that the compost used complied with the requirements of the ISO 14855 standard.
| Material | MC (%) | TOC (%) |
|---|---|---|
| Compost | 47.24 ± 5.50 | 28.94 ± 1.10 |
| MCC | 0.05 ± 0.01 | 45.50 ± 1.33 |
| L-WP film | 9.03 ± 0.35 | 45.80 ± 0.08 |
The biodegradation kinetics of the films in comparison to MCC used as a reference is shown in Fig. 9. As can be seen, the biodegradation rate of the whey protein films at industrial composting conditions increased rapidly after 8 h of incubation, achieving percentages higher than 50% in less than 40 h after the test was initiated. A shorter initial delay period was observed in comparison with the majority of bioplastics, which show an induction period that can be extended up to 10–20 days, depending on the composition and thickness.35 The degree of biodegradation observed in this study under thermophilic conditions (58 ± 2 °C) for this type of protein film is expected to be reduced if tested under mesophilic composting conditions.11 Since ISO 14855 establishes that the degree of biodegradation must be 70% after 45 days, it can be concluded that the whey protein films tested can be considered compostable.
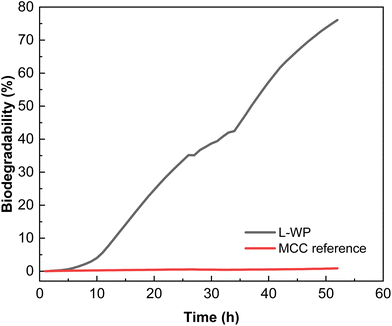 | ||
| Fig. 9 Biodegradability of local whey protein (L-WP) films in comparison with microcrystalline cellulose (MCC). | ||
The results obtained showed a superior biodegradability rate of protein films at composting in comparison with other bioplastics.36 Among the compostable bioplastics used nowadays in commercial packaging applications, PLA, PBAT and starch-based plastics can be found. Ruggero et al.37 studied the degradation of these materials by the simulation of industrial composting conditions following modified guidelines in ISO 14855-2:2018 during tests of 20 days at the thermophilic phase followed by 40 days of maturation phase. They found a degradation rate, in terms of weight loss, of 45 ± 5%, 8 ± 2% and 3 ± 1% after 60 days for starch, PBAT and PLA, respectively. Brdlík et al.38 also studied the biodegradation during the thermophilic composting (ISO 14855-1) of PLA films. The neat PLA films achieved about 4% biodegradation after 28 days of composting. The results obtained for L-WP films in this work are indicative of a more rapid biodegradability in comparison with other materials. These results are of great interest considering the Circular Economy Package adopted by the EU and the associated legislative measures with a common target on recycling, especially on the packaging, and reduction of municipal solid wastes going to landfilling. In this context, easily compostable packaging materials, collected together with organic waste, may help to achieve the challenging recycling targets recently established.39
3.6. Environmental analysis
Unlike whey protein extraction and industrial composting stages, the film manufacturing stage contributed the most to the environmental load related to the life cycle of whey protein films (Fig. 10). In particular, processes such as freezing and freeze-drying were the main contributors to the impact load, regardless of the impact category. In addition, the use of glycerol represented around 5% of the environmental impact in both marine eutrophication and land use categories since glycerol is a co-product in the esterification process of soybean oil production to obtain biodiesel. Thus, when glycerol was used in the film manufacturing stage, the impacts of soybean cultivation (e.g., use of diesel, machines, fertilisers, and pesticides) were considered, increasing the environmental impact on marine eutrophication and land use. Considering the three stages taken into account in the environmental assessment, it can be concluded that further analyses should be performed to optimise the transformation of whey protein into films or even to find alternative processing methods that could help reduce the environmental impact associated with this stage.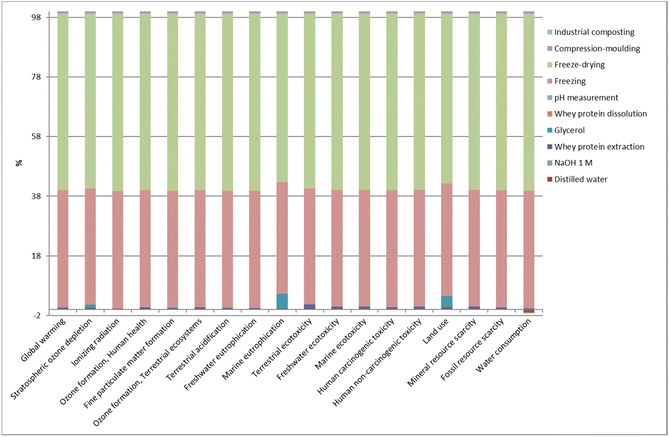 | ||
| Fig. 10 Relative contributions in each impact category for the most relevant processes involved in the entire life cycle of L-WP films. | ||
4. Conclusions
To ensure the maximum recovery of the whey protein from whey, two ultrafiltration processes were performed using a 5 kDa MWCO membrane, achieving a final protein content of 91.6 wt%, with the presence of some carbohydrates, such as lactose, as shown by FTIR, XRD and SEM analyses. The whey protein extracted was successfully used to prepare films by compression, resulting in transparent and easy-to-handle films, which could be employed as a greener food packaging alternative since the manufactured films were compostable. Regarding the environmental assessment, the film manufacturing process was the stage that contributed the most to the environmental impact during the whole life cycle of whey protein. Hence, an effort should be made to optimize this process and make whey protein films promising candidates to replace the current plastic packages towards more sustainable materials.Conflicts of interest
There are no conflicts to declare.Acknowledgements
The authors would like to thank the Basque Government (KK-2021/00131, IT1658-22, PA23/05) for the financial support. A. E. thanks the State Research Agency of Spain within the Juan de la Cierva – Incorporation action (IJC2019-039697I). M. U. thanks the Basque Government (Ikertalent program). E. R. C. thanks the Bio Based Industries Joint Undertaking (BBI-JU) for the European Union's Horizon 2020 Research and Innovation Program (grant agreement no. 887191). The authors thank the Soloitza cheese factory from Urruela SC farm, located in Respaldiza (Álava), and NEIKER for providing the whey used in this work.References
- A. Panghal, R. Patidar, S. Jaglan, N. Chhikara, S. K. Khatkar, Y. Gat and N. Sindhu, NFS J., 2018, 48, 520–535 CrossRef.
- J. Chandrapala, M. C. Duke, S. R. Gray, B. Zisu, M. Weeks, M. Palmer and T. Vasiljevic, J. Dairy Sci., 2015, 98, 4352–4363 CrossRef CAS PubMed.
- J. Camacho Flinois, R. Dando and O. I. Padilla-Zakour, J. Dairy Sci., 2019, 102, 7874–7883 CrossRef PubMed.
- D. Sharma, M. Manzoor, P. Yadav, J. S. Sohal, G. K. Aseri and N. Khare, in Fungi and their Role in Sustainable Development: Current Perspectives, ed. P. Gehlot and J. Singh, Springer, Singapore, 2018, pp. 349–366 Search PubMed.
- J. Mano, N. Liu, J. H. Hammond, D. H. Currie and G. Stephanopoulos, Metab. Eng., 2020, 57, 43–50 CrossRef CAS PubMed.
- D. Buchanan, W. Martindale, E. Romeih and E. Hebishy, Int. J. Dairy Technol., 2023, 76, 291–312 CrossRef CAS.
- A. R. Prazeres, F. Carvalho and J. Rivas, J. Environ. Manage., 2012, 110, 48–68 CrossRef CAS PubMed.
- V. Lavelli and M. P. Beccalli, Trends Food Sci. Technol., 2022, 126, 86–98 CrossRef CAS.
- E. Zandona, M. Blažić and A. Režek Jambrak, Food Technol. Biotechnol. (Online), 2021, 59, 147–161 CAS.
- V. G. Kontogianni, I. Kosma, M. Mataragas, E. Pappa, A. V. Badeka and L. Bosnea, Sustainability, 2023, 15, 13909 CrossRef CAS.
- J. Li and H. Chen, J. Polym. Environ., 2000, 8, 135–143 CrossRef CAS.
- X. Zhang, Y. Zhao, Y. Li, L. Zhu, Z. Fang and Q. Shi, Int. J. Biol. Macromol., 2020, 153, 892–901 CrossRef CAS PubMed.
- Y. Huang, C. Gu, S. He, D. Zhu, X. Liu and Z. Chen, J. Food Sci., 2020, 85, 2114–2123 CrossRef CAS PubMed.
- T. Janjarasskul, K. Tananuwong and J. M. Krochta, J. Food Sci., 2011, 76, E561–E568 CrossRef CAS PubMed.
- A. Papadaki, V. Kachrimanidou, I. K. Lappa, H. Andriotis, E. Eriotou, I. Mandala and N. Kopsahelis, Sustainable Chem. Pharm., 2022, 27, 100700 CrossRef CAS.
- Commission Regulation (EU) No 10/2011 of 14 January 2011 on plastic materials and articles intended to come into contact with food Text with EEA relevance, 2011, vol. 012.
- C. Baldasso, T. C. Barros and I. C. Tessaro, Desalination, 2011, 278, 381–386 CrossRef CAS.
- A. L. Zydney, Int. Dairy J., 1998, 8, 243–250 CrossRef CAS.
- A. F. Pires, N. G. Marnotes, O. D. Rubio, A. C. Garcia and C. D. Pereira, Foods, 2021, 10, 1067 CrossRef CAS.
- K. K. S. Borba, T. S. Gadelha, A. M. S. Sant'Ana, M. T. B. Pacheco, L. S. Pinto, M. S. Madruga, A. N. Medeiros, R. J. B. Bessa, S. P. A. Alves, M. Magnani, T. C. Pimentel and R. de C. R. do E. Queiroga, Small Rumin. Res., 2022, 217, 106842 CrossRef.
- Y. Feng, D. Yuan, B. Kong, F. Sun, M. Wang, H. Wang and Q. Liu, Curr. Res. Food Sci., 2022, 5, 1386–1394 CrossRef CAS PubMed.
- A. Rako, M. Tudor Kalit, S. Kalit, B. Soldo and I. Ljubenkov, LWT–Food Sci. Technol., 2018, 96, 657–662 CrossRef CAS.
- F. Liu, B.-S. Chiou, R. J. Avena-Bustillos, Y. Zhang, Y. Li, T. H. McHugh and F. Zhong, Food Hydrocolloids, 2017, 65, 1–9 CrossRef CAS.
- R. Saxton and O. M. McDougal, Foods, 2021, 10, 1033 CrossRef CAS PubMed.
- F. Fan and Y. H. Roos, Food Res. Int., 2015, 67, 1–11 CrossRef CAS.
- V. M. Azevedo, S. V. Borges, J. M. Marconcini, M. I. Yoshida, A. R. S. Neto, T. C. Pereira and C. F. G. Pereira, Carbohydr. Polym., 2017, 157, 971–980 CrossRef CAS PubMed.
- H. de Beukelaer, M. Hilhorst, Y. Workala, E. Maaskant and W. Post, Polym. Test., 2022, 116, 107803 CrossRef CAS.
- Y. A. Shah, S. Bhatia, A. Al-Harrasi, M. Afzaal, F. Saeed, M. K. Anwer, M. R. Khan, M. Jawad, N. Akram and Z. Faisal, Polymers, 2023, 15, 1724 CrossRef CAS PubMed.
- A. Etxabide, D. Mojío, P. Guerrero, K. de la Caba and J. Gómez-Estaca, Food Hydrocolloids, 2024, 147, 109371 CrossRef CAS.
- P. Guerrero, T. Garrido, I. Leceta and K. de la Caba, Eur. Polym. J., 2013, 49, 3713–3721 CrossRef CAS.
- T. Garrido, M. Peñalba, K. de la Caba and P. Guerrero, Composites, Part B, 2016, 86, 197–202 CrossRef CAS.
- K. Cruz-Diaz, Á. Cobos, M. E. Fernández-Valle, O. Díaz and M. I. Cambero, Food Packag. Shelf Life, 2019, 22, 100397 CrossRef.
- A. Pluta-Kubica, E. Jamróz, L. Juszczak, P. Krzyściak and M. Zimowska, Food Bioprocess Technol., 2021, 14, 78–92 CrossRef CAS.
- A. Etxabide, M. Urdanpilleta, P. Guerrero and K. de la Caba, React. Funct. Polym., 2015, 94, 55–62 CrossRef CAS.
- E. Hernández-García, M. Vargas, A. Chiralt and C. González-Martínez, Foods, 2022, 11, 243 CrossRef PubMed.
- O. García-Depraect, R. Lebrero, S. Rodriguez-Vega, S. Bordel, F. Santos-Beneit, L. J. Martínez-Mendoza, R. Aragão Börner, T. Börner and R. Muñoz, Bioresour. Technol., 2022, 344, 126265 CrossRef PubMed.
- F. Ruggero, R. C. A. Onderwater, E. Carretti, S. Roosa, S. Benali, J.-M. Raquez, R. Gori, C. Lubello and R. Wattiez, J. Polym. Environ., 2021, 29, 3015–3028 CrossRef CAS.
- P. Brdlík, J. Novák, M. Borůvka, L. Běhálek and P. Lenfeld, Polymers, 2023, 15, 140 CrossRef PubMed.
- C. Bruni, Ç. Akyol, G. Cipolletta, A. L. Eusebi, D. Caniani, S. Masi, J. Colón and F. Fatone, Sustainability, 2020, 12, 3319 CrossRef.
| This journal is © The Royal Society of Chemistry 2024 |

