 Open Access Article
Preparation of inorganic molten salt composite phase change materials and study on their electrothermal conversion properties†
Jiandong
Zuo
a,
Hongjie
Luo
a,
Ziye
Ling
*ab,
Zhengguo
Zhang
 *ab,
Xiaoming
Fang
 ab and
Weiwei
Zhang
c
aKey Laboratory of Enhanced Heat Transfer and Energy Conservation, The Ministry of Education, School of Chemistry and Chemical Engineering, South China University of Technology, Guangzhou 510640, China. E-mail: zyling@scut.edu.cn; cezhang@scut.edu.cn
bGuangdong Engineering Technology Research Center of Efficient Heat Storage and Application, South China University of Technology, Guangzhou 510640, China
cGmerit Holdings Ltd., Foshan 528000, China
First published on 7th May 2024
Abstract
Due to their limitations in conductivity and shape stability, molten salt phase change materials have encountered obstacles to effectively integrating into electric heating conversion technologies, which are crucial in energy storage and conversion fields. In this study, we synthesized an inorganic molten salt composite phase change material (CPCM) with enhanced conductivity and shape stability using a gas-phase silica adsorption method. Our findings revealed the regularities in thermal properties modulation by expanded graphite (EG) within CPCM and delved into its characteristics of electric heating conversion. The study elucidated that a conductive network is essentially formed when the EG content exceeds 3 wt%. Following the fabrication of CPCM into electric heating conversion modules, we observed a correlation between the uniformity of module temperature and the quantity of EG, as well as the distribution of electrode resistance and external voltage magnitude. Building upon this observation, we proposed a strategy to adjust the module temperature field with an electric field. Comparing the proposed direct electrical heating energy storage method with traditional indirect electrical heating methods, the energy storage rate increases by 93.8%, with an improved temperature uniformity. This research offers valuable insights for the application of molten salt electric heating conversion CPCMs.
Keywords: Thermal energy storage materials; Inorganic molten salts; Composite phase transition materials; Electrothermal conversion; Physical property regulation.
1 Introduction
In recent years, solar energy, wind energy, and other green renewable energy sources have emerged as the preferred options for clean power generation.1 However, the intermittency of wind and solar energy has resulted in a serious issue of surplus electricity that cannot be effectively utilized.2,3 To address this challenge, one solution is to convert the electricity generated by intermittent renewable energy sources into thermal energy for storage, which can then be supplied to users when needed.4,5 This effectively resolves the uneven distribution of electrical energy over time and space, thereby enhancing energy utilization. Phase change energy storage technology utilizes latent heat during phase transitions of phase change materials (PCMs) for thermal storage, offering advantages such as high energy storage density and stable phase change temperatures, making it an effective method for heat storage.6Molten salt PCM have significant application prospects in the field of latent heat energy storage, due to their wide range of phase change temperatures, high density, and low cost. The authors of the paper synthesized LiNO3–KCl/SiO2 composite PCM, achieving an energy storage density during the phase change stage of 3.4 × 10⁸ J m−3, which is 2.5 to 4 times higher than that reported in previous studies.7–9 Qi et al. proposed a hydroxylation method, resulting in a phase change enthalpy of the molten salt composite PCM reaching 355.52 J g−1.10 Shuai et al. utilized porous silicon carbide ceramics and solar salt to form a composite PCM, resulting in a more uniform temperature distribution during phase change, with the maximum temperature difference reduced from 148 °C to 130 °C, and an overall phase change rate increased by 42.9%.11 However, due to the limitations in electrical conductivity and shape stability of molten salt PCM, heat storage is typically achieved through indirect electrical heating (IEH). This involves converting electrical energy into thermal energy using external devices such as electric heaters, which is then transferred to the PCM for storage. Chuan et al. investigated the charging performance of shell-and-tube devices containing molten salt-based PCMs. Compared to devices containing pure salt, the melting process in devices containing salt composite materials can be shortened by approximately 79%.12 Li et al. further established a high-temperature packed bed heat storage system encapsulating molten salt PCM, which exhibited an overall efficiency 1.9–2.4 times higher than shell-and-tube thermal storage systems.13 However, the longer energy transfer path in IEH leads to increased energy losses due to intermediate heat exchange processes. In contrast, direct electrical heating (DEH) enables energy storage by directly heating the phase change material through electric current. This transition eliminates intermediate heat transfer processes, thereby improving system efficiency.
Currently, some researchers have explored the electrothermal conversion performance of PCM under DEH. Maleki et al. prepared multilevel porous carbon foams (CFs) as conductive frameworks, achieving an energy conversion-storage efficiency of up to 74% during the phase change.14 Xue et al. fabricated hybrid aerogels composed of melamine foam (MF) and graphene oxide (GO)/graphene nanoplatelets (GNPs), with a phase change enthalpy of 161.7 J g−1 and a thermal conductivity of 1.46 W m−1 K−1, achieving an energy conversion-storage efficiency of 62.5%.15 Zhang et al. found that by adding 20 wt% carbon black to polyethylene glycol–calcium chloride PCM, an energy conversion-storage efficiency of 64.7% could be achieved.16 Due to the poor thermal conductivity of most PCMs, PCM and framework materials alone cannot meet the high thermal conductivity requirements of materials, so the addition of conductive fillers can improve the thermal conductivity of composite PCMs.17 Sun et al. employed carbon nanotubes as thermal conductive fillers, resulting in a reduction of electrical resistivity from 9500 Ω m to 90 Ω m and an increase in thermal conductivity to 0.91 W m−1 K−1 in the composite PCM. As a result, the energy conversion-storage efficiency reached 70.2%.18 Aftab et al. infiltrated polyethylene glycol PCM into carbon nanotube arrays, achieving an energy conversion-storage efficiency as high as 94%, with the capability of rapid response to electrical heating under low voltage conditions.19 It is evident that these studies all use organic substances as PCM. However, organic PCMs usually have phase-change temperatures below 100 °C, lower density, higher costs, and a certain level of flammability. These factors result in issues such as low heat storage density, a narrow application temperature range, and poor safety, thereby restricting their practical use. Furthermore, the dimensions of the composite PCM samples prepared in the mentioned studies are relatively small, with a volume of approximately 5 cm3. Due to the small sample size, the material often shows good temperature uniformity in the electric heating process, but in the large-scale heat storage system, the amount of electric heating conversion material may reach tens of kilograms or even higher, and the size of the system will also be an order of magnitude difference. This may lead to local overheating of the system. If the temperature monitoring device fails to accurately monitor the overall temperature of the system, there is a risk of local melting of the heat exchange tube and chemical decomposition failure of the material. However, the uniformity of temperature in larger-sized PCMs during the electrothermal conversion process has not been validated.
This paper utilizes a mixed molten salt of LiNO3 and KCl as the PCM and employs hydrophilic gas-phase silica (SiO2) as a porous adsorption carrier. Through the molten adsorption method, a shaped molten salt/SiO2 composite phase-change material (CPCM) is prepared. We added expanded graphite (EG) to the CPCM to provide a conductive and thermally conductive network, thereby imparting electrical conductivity and high thermal performance to the CPCM. Subsequently, we investigated the relationship between the added amount of EG and the thermal conductivity, enthalpy, and apparent specific heat capacity of the CPCM. This exploration aimed to uncover how EG regulates the thermal properties of the CPCM. Finally, we established an electrothermal conversion testing system for a CPCM device with dimensions of 170 mm in length, 35 mm in width, and 80 mm in height. The system allowed us to conduct comprehensive tests on the electrothermal conversion performance of the CPCM, covering both sensible heat storage and latent heat storage stages. Throughout our study, we identified key factors influencing the temperature uniformity of the electrothermal conversion device incorporating the CPCM. Moreover, by combining experimental research with numerical simulation, we effectively evaluated the electrothermal conversion capability of the CPCM within the device. This integrated approach contributes valuable insights and guidance for the practical application of molten salt electrothermal conversion PCMs.
2 Results and discussion
2.1 Experimental results analysis
2.1.1.1 SEM. From Fig. S1,† it can be observed that the microstructure of EG exhibits a lamellar morphology, with relatively large pores between the layers, making it suitable for adsorbing phase change materials. After compounding EG with LiNO3–KCl/SiO2, LiNO3–KCl/SiO2 adheres to the layers of EG, as illustrated in Fig. S1d.†
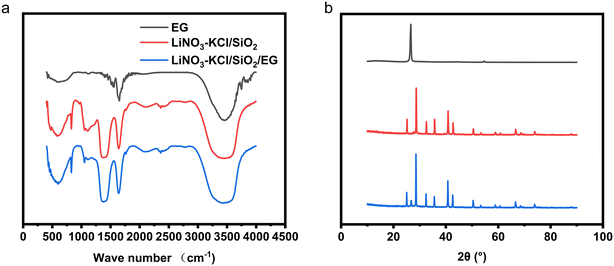
2.1.1.2 FT-IR and XRD. From Fig. 1a, it can be inferred that, in EG, the absorption peak within the 1558 cm−1 region is typically associated with the C
![[double bond, length as m-dash]](https://www.rsc.org/images/entities/char_e001.gif) C stretching vibration peak. The absorption peaks at 1650 cm−1 and 3450 cm−1 correspond to the –OH characteristic peaks. Possible reasons for this may include the introduction of trace amounts of moisture during the sample pressing process, and the presence of a small amount of hydroxyl groups on the surface of EG, which contribute to the existence of this peak.
C stretching vibration peak. The absorption peaks at 1650 cm−1 and 3450 cm−1 correspond to the –OH characteristic peaks. Possible reasons for this may include the introduction of trace amounts of moisture during the sample pressing process, and the presence of a small amount of hydroxyl groups on the surface of EG, which contribute to the existence of this peak.
In LiNO3–KCl/SiO2, the absorption peak in the 595 cm−1 region is typically associated with Li–O vibrations. The absorption peak in the 809 cm−1 region is usually attributed to the symmetric stretching vibration of Si–O–Si bonds, a significant characteristic of the silica sample. The absorption peak in the 1091 cm−1 region corresponds to the antisymmetric stretching vibration of Si–O–Si bonds. The absorption peak in the 1450 cm−1 region is induced by the stretching vibration of N–O bonds. The absorption peak at 1650 cm−1 is attributed to water adsorbed by LiNO3, and the strong absorption peak at 3400 cm−1 corresponds to the stretching vibration of O–H bonds in physically adsorbed water in the sample.
In the XRD spectrum, EG exhibits a diffraction peak at 26.59°, corresponding to the (002) crystal plane of standard graphite (JCPDS no. 41-1487), which is consistent with the results reported in literature.20–22 The relatively strong intensity of this diffraction peak indicates that the atomic arrangement on this crystal plane is ordered and dense. However, in the XRD spectrum of LiNO3–KCl/SiO2/EG composite phase change material (CPCM), the intensity of the corresponding EG diffraction peak is weaker. This is attributed to the disruption of EG morphology during the preparation process of the CPCM, where EG and LiNO3–KCl/SiO2 undergo stirring and crushing. As a result, the atomic spacing on the crystal plane of EG increases, and the structure becomes looser.
Compared to LiNO3–KCl/SiO2 and EG, the FT-IR and XRD spectra of LiNO3–KCl/SiO2/EG CPCM do not exhibit new signal peaks. This observation suggests that the composite process involves physical blending, and no new substances are formed.
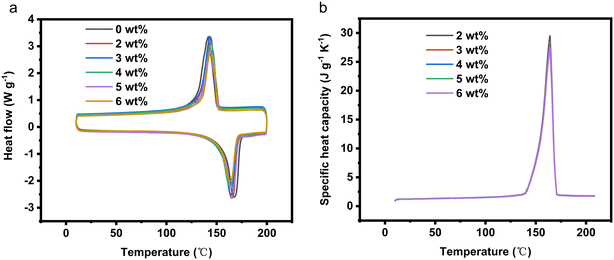
2.1.2.1 DSC and apparent specific heat capacity testing. The DSC curves of CPCMx under different amounts of EG are depicted in Fig. 2a. As per my previous work, the melting enthalpy of LiNO3–KCl/SiO2 is established as 188.9 J g−1, with a phase transition temperature of 159.8 °C. Upon the addition of EG, the melting enthalpy of CPCMx gradually decreases. This reduction is attributed to the fact that EG does not contribute latent heat to the composite phase change material. As shown in Table 1, the relative error between the actual enthalpy values and the theoretical enthalpy values of CPCMx is less than 2%, falling within a reasonable range. The specific heat capacity of a material is an important parameter for measuring its thermal storage capacity. The apparent specific heat capacity curve of LiNO3–KCl/SiO2/EG CPCM is shown in Fig. 2b. The peak shapes of the apparent specific heat capacity curves for CPCMs with different EG content are similar. The apparent specific heat capacity of the material, both before and after phase transition, represents the specific heat capacity of the material during sensible heat. During the phase transition of the material, the value of the apparent specific heat capacity can be calculated using an equivalent method. It can be observed from the figure that the addition of EG reduces the specific heat capacity of the material. This is because the specific heat capacity of the eutectic molten salt is greater than 1 J g−1 K−1, while the specific heat capacity of EG at room temperature is only 0.71 J g−1 K−1.
| Concentration of EG (wt%) | Enthalpy of fusion (J g−1) | Discrepancy from the theoretical value (%) | Enthalpy of solidification (J g−1) | Melting temperature (°C) | Freezing temperature (°C) |
|---|---|---|---|---|---|
| 0 | 188.9 | — | 188.3 | 156.8 | 170.5 |
| 2 | 186.5 | 0.28 | 182.6 | 155.7 | 174.6 |
| 3 | 184.6 | 0.34 | 185.8 | 154.1 | 175.8 |
| 4 | 182.8 | 0.46 | 188.5 | 155.0 | 173.5 |
| 5 | 181.9 | 1.1 | 179.9 | 153.6 | 175.9 |
| 6 | 176.7 | 0.77 | 181 | 152.4 | 170.0 |
2.1.2.2 Volume resistivity and thermal conductivity. As shown in Fig. 3a, with the increase in the amount of EG, the thermal conductivity of the composite block shows an increasing trend, while the volume resistivity exhibits a decreasing trend. The opposite trends in volume resistivity and thermal conductivity are attributed to the high electrical and thermal conductivity of EG. EG is composed of layered carbon atoms, with each layer of carbon atoms bonded together by covalent bonds into hexagonal rings. This layered structure enables rapid conduction of electrons and heat along the plane direction in EG. Additionally, the porous microstructure of EG provides additional conduction pathways, facilitating the transfer of electrons and heat within the material.
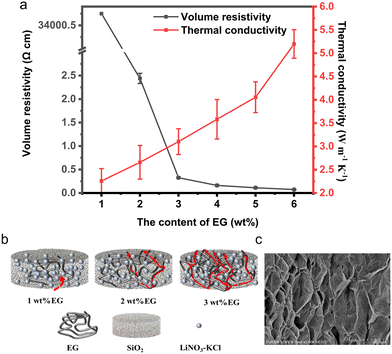 | ||
| Fig. 3 (a) Analysis of volume resistivity and thermal conductivity of CPCM; (b) schematic diagram of conductive network formation; (c) SEM diagram of porous microstructure of EG. | ||
The change in volume resistivity of the CPCM block with EG content exhibits a nonlinear relationship. This is attributed to the presence of the percolation effect of EG. As shown in Fig. 3b, when the amount of EG exceeds a critical value, a complete conductive network forms within the material,23,24 leading to a sharp decrease in the material's resistivity. With the increase in EG content, the CPCM block undergoes a rapid transition from electrical insulator to conductor, and the electrical percolation threshold of EG is around 2 wt%. This is in close agreement with the results reported in literature.25
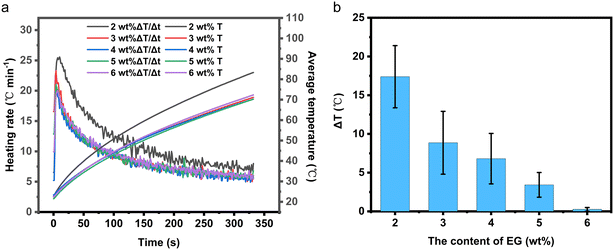 | ||
| Fig. 4 (a) Temperature rise and temperature rise rate curve of EThCMx; (b) temperature difference statistics at T1 and T3 of EThCMx. | ||
The calculation results of energy conversion-storage efficiency are shown in Table 2. It can be observed that the energy conversion-storage efficiency of EThCM2 is significantly higher than that of other EThCMs. This discrepancy is likely due to the fact that the temperatures measured by the thermocouples cannot accurately reflect the average temperature of EThCM2, leading to calculated energy conversion-storage efficiency values deviating from normal values.
| Concentration of EG (wt%) | Initial average temperature (°C) | Final average temperature (°C) | Energy conversion and storage efficiency (%) | Heating rate (°C min−1) |
|---|---|---|---|---|
| 2 | 22.63 | 86.01 | 95.2 | 11.52 |
| 3 | 22.37 | 71.12 | 76.1 | 8.86 |
| 4 | 22.44 | 70.33 | 74.7 | 8.71 |
| 5 | 21.5 | 70.27 | 75.1 | 8.87 |
| 6 | 22.48 | 72.31 | 77.1 | 9.06 |
2.1.4.1 Temperature uniformity analysis of EthCMx. From Fig. 4b, it can be observed that, for EThCM2, there is a significant temperature difference of up to 17.6 °C between the temperatures measured at points T1 and T3, while for EThCM6, this temperature difference is only 0.2 °C. This discrepancy is attributed to the highly thermally conductive and porous structure of EG. When the amount of EG is low, the main part of the CPCM is still formed by the insulating and low thermally conductive SiO2 skeleton network, and EG serves as a conductive and thermal filling material inside the CPCM. During sample preparation, uneven mixing of materials may lead to temperature anomalies during the electric heating process. When the amount of EG is high, the main part of the CPCM becomes the conductive and thermally conductive EG, while the insulating and low thermally conductive LiNO3–KCl/SiO2 is filled in the interlayer gaps of EG. At this point, the conductive and thermally conductive network of the CPCM has been established.
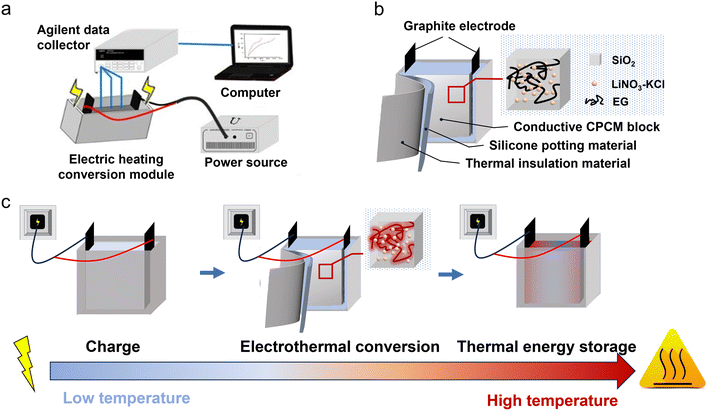
2.1.4.2 Analysis of the impact of electrode resistance distribution on temperature uniformity of the EThCM. During the experimental process, it was observed that the temperature in the middle part (T2) of EThCM is slightly lower than the temperatures on both sides (T1 and T3) in most cases. To investigate the cause of this phenomenon, this section includes a comparative experiment. As shown in Table 3, all graphite electrodes have the same specifications. In the experimental group, the resistivity of one pair of graphite electrodes differs by a factor of two, while in the control group, it is equal. To control variables, CPCM6 was selected, and the electric heating power was set to 80 W.
| Experimental group | Control group | |||
|---|---|---|---|---|
| The electrode near the T1 region | The electrode near the T3 region | The electrode near the T1 region | The electrode near the T3 region | |
| Mass (g) | 9.12 | 9.08 | 8.90 | 9.15 |
| Total resistance (mΩ) | 31.63 | 16.00 | 16.80 | 16.40 |
| Resistivity (×10−3 Ω cm) | 1.52 | 0.77 | 0.81 | 0.79 |
| Specifications (mm3) | 100 × 16 × 3 | |||
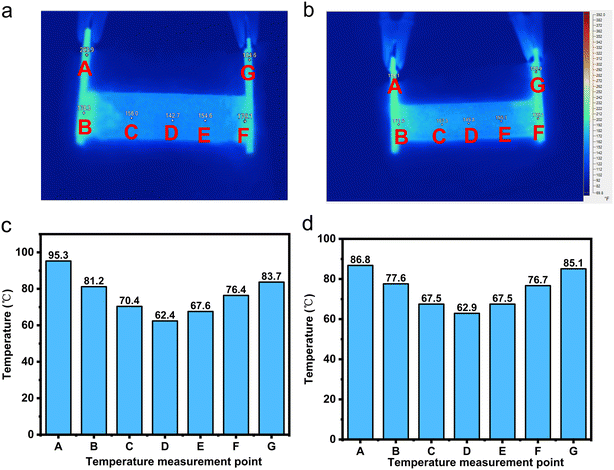
From Fig. 5, it can be observed that the temperature distribution of the electrothermal conversion module varies gradually, first decreasing and then increasing, as the positions of points A, B, C, D, E, F, and G change. This phenomenon arises due to the inconsistent temperature rise rates between the graphite electrode and the CPCM block. The temperature rise rates of the graphite electrode and CPCM block can be calculated using the following formula:
| I2Rt = CPmΔT | (1) |
Upon conversion, the following results can be obtained:
 | (2) |
Where v is the heating rate, ΔT is the temperature rise, t is the duration of electric heating, I is the current passing through the material, R is the resistance of the material, c is the specific heat capacity of the material, and m is the mass of the material.
As the graphite electrode and CPCM block are connected in series, the ratio of the temperature rise rates between the graphite electrode and the CPCM block can be utilized to eliminate the common term I2 in the formula.
 | (3) |
Where the subscript 1 represents the parameters of the graphite electrode, and subscript 2 represents the parameters of the CPCM block. The specific heat capacity of graphite CP,1 is approximately 0.71 J g−1 K−1, and within the temperature rise range, the specific heat capacity of CPCM CP,2 is 1.45 J g−1 K−1. The mass of a single graphite electrode m1 is approximately 9.5 g, and the mass of the CPCM block m2 is 138 g. The experimentally measured resistance of the CPCM block R2 is 216 mΩ. From these parameters, the following conclusions can be drawn:
(1) When the resistance of the graphite electrode is 7.28 mΩ, v1 equals v2. The temperature rise rate of the graphite electrode is equal to that of the CPCM block, resulting in uniform temperatures throughout the electrothermal conversion module.
(2) When the resistance of the graphite electrode exceeds 7.28 mΩ, v1 is greater than v2. At this point, the temperature rise rate of the graphite electrode is higher than that of the CPCM block.
(3) When the resistance of the graphite electrode is less than 7.28 mΩ, v1 is less than v2. In this case, the temperature rise rate of the graphite electrode is lower than that of the CPCM block.
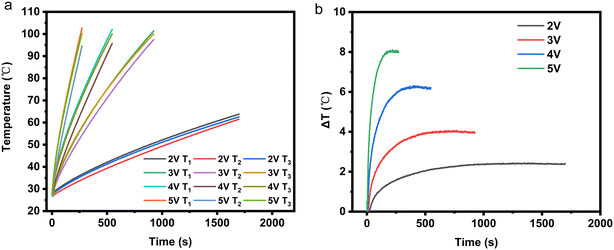
2.1.4.3 Analysis of the influence of applied voltage magnitude on temperature uniformity of the electrothermal conversion module. As shown in Fig. 6, as the externally applied voltage increases, the temperature difference inside EThCM becomes larger. This is because a higher voltage results in greater heating power in the graphite electrode, leading to a larger difference in heating power between the graphite electrode and the CPCM block, causing an increase in the temperature difference between them. Additionally, due to the presence of contact resistance between the graphite electrode and the CPCM block, as the input voltage increases, the heating power at the contact interface also sharply increases, resulting in a larger temperature difference between the average temperatures at T1 and T3 and the temperature at T2 within the EThCM. After heating for a certain period, the temperature difference in EThCM tends to stabilize. This is because the graphite electrode is exposed to the environment, and as the temperature increases, its heat dissipation power also increases. When the heat dissipation power balances with the electric heating power, the temperature difference also tends to balance.
Through an exploration of the above influencing factors, the optimal experimental conditions for EThCM can be summarized as follows:
(1) The amount of EG in LiNO3–KCl/SiO2/EG composite phase change material is 6 wt% (CPCM6). At this point, the conductive and thermally conductive network of the composite phase change material has been established, resulting in relatively uniform heating throughout EThCM.
(2) The resistivity of the graphite electrodes on both sides of EThCM is equal. In this scenario, the heating power and heat transfer power of the graphite electrodes at both ends of EThCM are equal, and the temperature gradient exhibits a symmetric distribution with the module's central axis as the reference.
(3) When the graphite electrodes and CPCM block form EThCM, there exists a critical resistance value for the graphite electrodes. When the resistance of the graphite electrode is at the critical value, the temperature distribution throughout EThCM is uniform during the electric heating process.
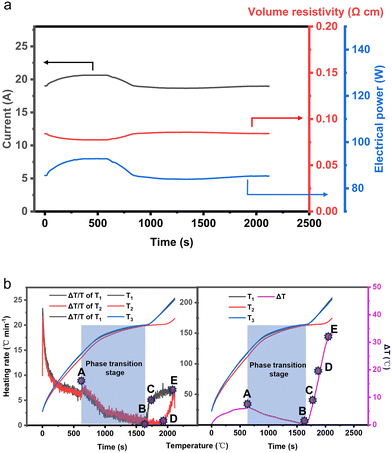
As shown in Fig. 7b, with the progression of the heating process, the electrothermal conversion module undergoes both sensible and latent heat storage phases. The module's heating rate exhibits a trend of initially decreasing and then increasing, while the temperature difference shows a pattern of initially increasing, followed by a decrease with a peak value.
When the electric heating progresses to 630 s (point A), the heating rate exhibits a small plateau, followed by a sharp decrease. This is because EThCM enters the phase change stage at this point. The apparent specific heat capacity of the material sharply increases, and the heat obtained from electrothermal conversion is stored in the material in the form of latent heat storage. Similarly, in the temperature difference–time relationship graph, at 630 s, the internal temperature difference within EThCM reaches its maximum value. Subsequently, as the material enters the latent heat storage phase, the internal temperature difference within EThCM decreases.
When electric heating progresses to 1676 s (point B), due to the position at T1 being closer to the graphite electrode than T2, the material at T1 completes the phase transition process first. At this point, the apparent specific heat capacity of the material at this position sharply decreases, and the heating rate rapidly increases, reaching 5.78 °C min−1. The apparent temperature of the material also rises, while the material at T2 is still in the phase change stage. The internal temperature difference within EThCM gradually increases.
When electric heating progresses to 1712 s (point C), the rate of change of the heating rate at T1 decreases. This is because there is a temperature difference between T1 and T2, and the heat absorbed at T1 is not only used to raise its own temperature but is also conducted in the form of heat transfer to the lower temperature at T2.
When electric heating progresses to 1922 s (point D), the material at T2 completes the phase transition, and the heating rate of the material in the central part of EThCM also increases. At this point, the entire EThCM completes latent heat storage and enters the sensible heat storage phase. The heat absorbed by the material at T2 is entirely used to raise its own temperature, without the need to conduct to a lower temperature, so the rate of change of the heating rate at T2 remains constant and is greater than the rate of change of the heating rate at T1.
When electric heating progresses to 2110 s (point E), the heating rate at T2 exceeds that at T1 for the first time, and a plateau appears in the temperature difference between T1 and T2.
2.2 Simulation results analysis
2.2.1.1 Setting of monitoring positions and simulation parameters. The monitoring point positions of EThCM are shown in Fig. S2.† Through the analysis of grid independence, the final calculation model adopts a total number of grids of 1447, and the time step is set to 0.1 s.
In the simulation process, it is necessary to determine the heating density of the material. The physical properties of the materials are listed in Table S1.† Since in the EThCM, the “electrode AB-block CDE-electrode GF” forms a series system, the current is equal everywhere. According to the power formula I2 = P/R, it is known that the heating power of the material is proportional to the resistance of the material. Therefore, by setting the total input power to 80 W, the heating power of each part can be calculated, and thus the heating density of each part can be calculated. To verify the calculation results of the critical resistance of the graphite electrode and the correctness of the conclusions in the previous text, four operating conditions are set as shown in Table 4. Among them, in conditions 1 and 2, the resistance of the graphite electrode is higher than the critical resistance of the graphite electrode, 7.28 mΩ. In condition 3, the resistance of the graphite electrode is lower than this value, and in condition 4, the resistance of the graphite electrode is equal to this value.
| Operating condition | Parameter | Left-side graphite electrode | Right-side graphite electrode | CPCM block |
|---|---|---|---|---|
| 1 | Resistance (Ω) | 0.032 | 0.016 | 0.216 |
| Heat density (W m−3) | 2.12 × 10⁶ | 1.06 × 10⁶ | 8.58 × 10⁵ | |
| 2 | Resistance (Ω) | 0.016 | 0.016 | 0.216 |
| Heat density (W m−3) | 1.13 × 10⁶ | 1.13 × 10⁶ | 9.13 × 10⁵ | |
| 3 | Resistance (Ω) | 0 | 0 | 0.216 |
| Heat density (W m−3) | 0 | 0 | 1.05 × 10⁶ | |
| 4 | Resistance (Ω) | 0.00728 | 0.00728 | 0.216 |
| Heat density (W m−3) | 5.62 × 10⁵ | 5.62 × 10⁵ | 9.79 × 10⁵ |
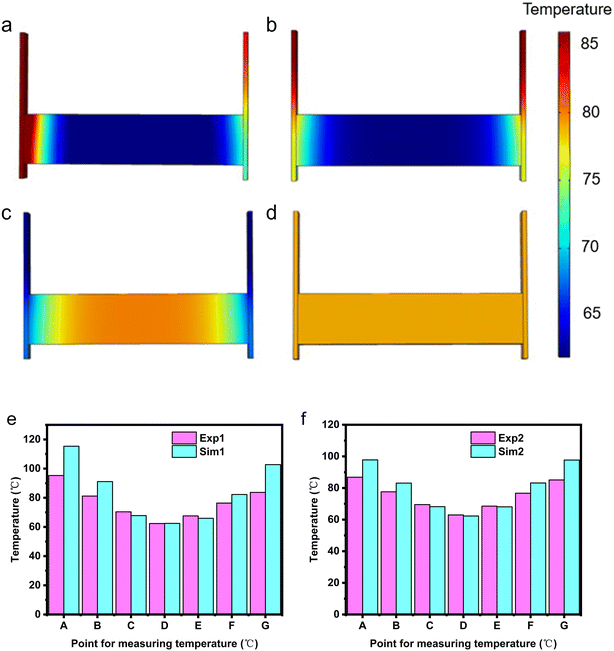
2.2.1.2 Analysis of simulation results. Numerical simulations were conducted for 120 seconds on the unsealed EThCM under different operating conditions. The temperature contour map and the temperatures at various monitoring points obtained from the simulation are shown in Fig. 8a–d. As shown in Fig. 8d, under the conditions of condition 4, when the resistance of the graphite electrode is at the critical value, the heating of the graphite electrode and the CPCM block is uniform, and the temperature differences at various monitoring points are small. This confirms the existence of the critical resistance of the graphite electrode, and the calculation results are consistent with theoretical values.
From Fig. 8e and f, it can be observed that the temperature contour maps for conditions 1 and 2 generally match the infrared thermal images in Fig. 8a and b, showing a trend of lower temperature in the middle and higher temperatures on both sides. However, through the comparison between simulation and experiment, there are still some differences. Specifically, the simulated temperatures are higher than the actual temperatures. This is attributed to convective heat transfer between the graphite electrode and the air in actual conditions, causing the graphite electrode's heating rate to be lower than the theoretical value. Additionally, due to the longer heating time in actual conditions, the temperatures at points C and E are slightly higher than the simulated values.
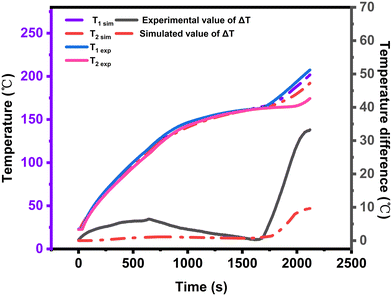
To verify the accuracy of the simulation results, a comparison is made between the simulated and experimental results. As shown in Fig. 9, the temperatures of T1 and T2 are calculated using the apparent specific heat model. The simulated temperature trends closely resemble the observed temperature trends. Additionally, the relative errors for T1 and T2 are within reasonable limits, with T1's relative error not exceeding 1.3% and T2's relative error not exceeding 4%. This indicates that the model established in this section is capable of accurately calculating the heating process of EThCM.
At the end of the electrical heating process, the parameters of each component of EThCM are summarized Table 5. From the table, it can be observed that despite the larger volume of the sealing gel and its lower energy storage density, it still stores a considerable amount of energy. The heat generated during electrical heating is stored by both the CPCM block in the form of sensible and latent heat storage and the sealing gel through sensible heat storage. The table also indicates that, compared to sensible heat storage materials, CPCM offers the advantage of higher energy storage density with a smaller volume, further highlighting the promising prospects of applying CPCM in the field of electrothermal conversion.
| Object | Average temperature (°C) | Heating rate (°C min−1) | Volume (cm3) | Stored energy (J) | Energy density (×109 J m−3) |
|---|---|---|---|---|---|
| Graphite | 225.9 | 5.8 | 4.95 | 1302.9 | 0.263 |
| CPCM block | 201.8 | 5.14 | 76.5 | 109![[thin space (1/6-em)]](https://www.rsc.org/images/entities/char_2009.gif) 063 063 |
1.425 |
| Sealing adhesive | 170.3 | 4.25 | 393.7 | 105![[thin space (1/6-em)]](https://www.rsc.org/images/entities/char_2009.gif) 384 384 |
0.267 |
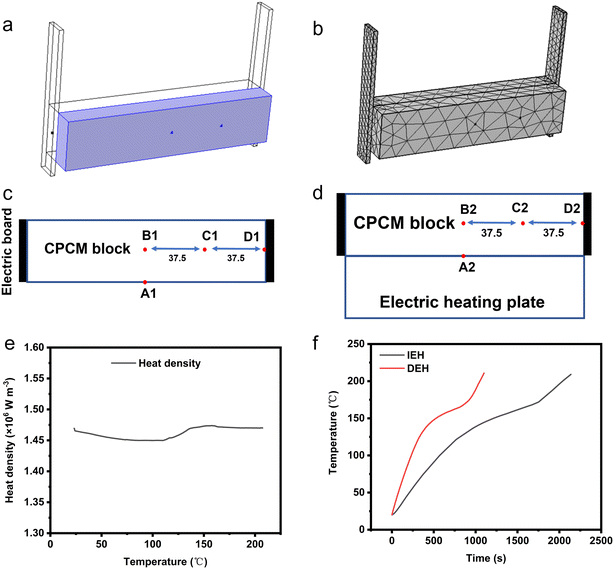
2.2.3.1 Model and mesh partitioning. Numerical simulation and analysis were conducted using COMSOL software. The position of the electrical heating plate and the mesh model for the indirect heating scenario are illustrated in Fig. 10a and b. The parameter settings for each component under the two simulated operating conditions are presented in Table 6.
| IEH | DEH | |
|---|---|---|
| Indirectly heated electric heating plate | Directly heating composite phase transition material | |
| Specific heat capacity (J g−1 K−1) | 0.5 | Apparent specific heat capacity function |
| Density (g cm−3) | 7.98 | 1.8 |
| Thermal conductivity (W m−1 K−1) | 16.2 | 5.2 |
| Heat generation density (W m−3) | 1.465 × 10⁶ ± 1% | |
During the simulation, it is crucial to monitor the temperature of various parts of EThCM. The locations of monitoring points are depicted in Fig. 10c and d. For comparison purposes, the input power of the direct heating model was set to 130 W. The curves depicting the variation of the heat generation density of the CPCM with temperature in both the direct heating and indirect heating models are illustrated in Fig. 10e. This curve was computed based on the apparent specific heat capacity function of the composite phase-change material block (CPCM6). As indicated in the figure. The heating process remained stable, with the heat generation density around 1.465 × 10⁶ W m−3, and the overall deviation was less than 1%. Furthermore, the dimensions and volumes of the CPCM and the electric heating plate were consistent between the two conditions, indicating that their heat generation powers were identical. In the indirect heating model, the electric heating plate was in full contact with the CPCM, with the thermal resistance within it being neglected.
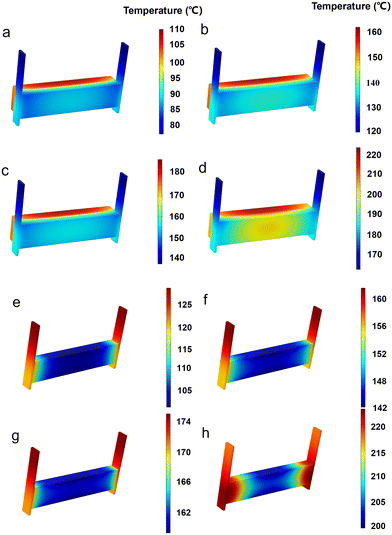
2.2.3.2 Comparative simulation results and discussion. From Fig. 10f, it is evident that under the condition of consistent heating density–temperature curves, the material's heating rate is higher in the DEH model compared to the IEH model. In the IEH model, the time required for the material to reach 200 °C is 2038 s, with a heating rate of 5.3 °C min−1. In the DEH model, the time required for the material to reach 200 °C is 1051 s, with a heating rate of 10.27 °C min−1. Adopting direct electrical heating shortens the material's energy storage time by 48.4%, and the energy storage rate nearly doubles. This improvement is attributed to the real-time nature of direct electrical heating, where electrical energy is instantly converted into material thermal energy, unlike the IEH model, where heat transfer rate is limited by temperature differentials.
From Fig. 11d, it is evident that when the IEH model operates for 2050 s, certain local positions within the CPCM block have not reached 200 °C. Conversely, as depicted in Fig. 11h, when the DEH model operates for 1100 s, the entire CPCM block has already reached 200 °C, providing further evidence that the heat storage rate of DEH is significantly higher than that of IEH. Additionally, as illustrated in Fig. 11b, the temperature scale range for the IEH model at 1000 s ranges from 120 °C to 160 °C, with a temperature difference of 40 °C. In comparison, Fig. 11h shows that when the DEH model operates for 1100 s, the temperature range is 200 °C to 220 °C, with a reduced temperature difference of 20 °C. This indicates that the temperature uniformity of the DEH model is superior to that of the IEH model. Moreover, as discussed in the previous section, by controlling the electric field, it is possible to effectively regulate the temperature field of the material. Therefore, through optimization, the temperature difference of the DEH model can be further reduced, improving its temperature uniformity.
3 Conclusion
This study employed physical blending to create LiNO3–KCl/SiO2/EG composite phase-change materials (CPCMx) with varied EG content. EG modulation influenced CPCM's electrical resistivity and thermal conductivity, providing electric-thermal conversion properties. CPCM2 formed a preliminary conductive network, while CPCM3 established a substantial network. CPCM6 exhibited a high melting enthalpy of 176 J g−1 and a phase transition temperature of 152 °C. Following this, the establishment of a CPCM electrothermal conversion system (EThCM) revealed through electric heating experiments that temperature uniformity in EThCM is influenced by EG content, electrode resistance distribution, and external applied voltage. Higher EG content, smaller differences in resistance between electrodes, closer electrode resistance to the critical value, and lower external voltage result in improved temperature uniformity in EThCM.Through the establishment of relevant models and simulation analysis, we analyzed the electric heating process in EThCM, validating the existence of the critical resistance value in the graphite electrode and revealing the circuit's regulation on the temperature field. Experimental verification led to strategies for regulating temperature uniformity. Additionally, simulations showed that direct heating significantly improves energy storage, reducing storage time by 48.4%, doubling the storage rate compared to indirect heating, and achieving better temperature uniformity. The error between simulation and experimentation is within 4%, confirming the model's accuracy. Simulation suggests further improvements in temperature uniformity through electric field regulation.
4 Experiment
4.1 Materials
Lithium nitrate (LiNO3, analytical grade) was purchased from Shanghai Macklin Biochemical Technology Co., Ltd.; potassium chloride (KCl, analytical grade) was obtained from Guangzhou Chemical Reagent Factory; hydrophilic gas-phase silica (SiO2, 99.8%) was purchased from Hubei Huifu Nanomaterials Co., Ltd.; expanded graphite (EG, industrial grade, 50 mesh) was obtained from Qingdao Furuite Graphite Co., Ltd.4.2 Preparation of CPCM
The material preparation process is illustrated in Fig. S4.† Materials were weighed according to a mass ratio of 6![[thin space (1/6-em)]](https://www.rsc.org/images/entities/char_2009.gif) :
:![[thin space (1/6-em)]](https://www.rsc.org/images/entities/char_2009.gif) 4 for LiNO3 and KCl, and heated at a constant temperature of 220 °C for 1 hour to achieve co-melting. Subsequently, SiO2 was added in a mass ratio of 9
4 for LiNO3 and KCl, and heated at a constant temperature of 220 °C for 1 hour to achieve co-melting. Subsequently, SiO2 was added in a mass ratio of 9![[thin space (1/6-em)]](https://www.rsc.org/images/entities/char_2009.gif) :
:![[thin space (1/6-em)]](https://www.rsc.org/images/entities/char_2009.gif) 1 to the eutectic salt to prepare the LiNO3–KCl/SiO2 composite phase-change material. To regulate its electrothermal performance, LiNO3–KCl/SiO2/EG composite phase-change material (CPCM) was prepared with mass fractions of expanded graphite (EG) ranging from 2% to 6%. The specific steps are as follows: the LiNO3–KCl/SiO2 composite phase-change material was heated for 1 hour above the phase-change temperature. Different mass fractions of EG were separately weighed and added to a beaker, and the two components were stirred with a glass rod until they were uniformly mixed, resulting in LiNO3–KCl/SiO2/EG composite phase-change materials with varying EG ratios. As shown in Table 7, when distinguishing between different EG addition amounts, they were denoted as CPCMx, where x represents the mass fraction of EG. While still hot, a certain amount of powdered material was weighed into a mold, and a flat vulcanizing machine was used to press the composite phase-change material into blocks (150 mm in length, 15 mm in width, and 34 mm in height) at a temperature of 150 °C.
1 to the eutectic salt to prepare the LiNO3–KCl/SiO2 composite phase-change material. To regulate its electrothermal performance, LiNO3–KCl/SiO2/EG composite phase-change material (CPCM) was prepared with mass fractions of expanded graphite (EG) ranging from 2% to 6%. The specific steps are as follows: the LiNO3–KCl/SiO2 composite phase-change material was heated for 1 hour above the phase-change temperature. Different mass fractions of EG were separately weighed and added to a beaker, and the two components were stirred with a glass rod until they were uniformly mixed, resulting in LiNO3–KCl/SiO2/EG composite phase-change materials with varying EG ratios. As shown in Table 7, when distinguishing between different EG addition amounts, they were denoted as CPCMx, where x represents the mass fraction of EG. While still hot, a certain amount of powdered material was weighed into a mold, and a flat vulcanizing machine was used to press the composite phase-change material into blocks (150 mm in length, 15 mm in width, and 34 mm in height) at a temperature of 150 °C.
| Concentration of LiNO3–KCl (wt%) | Concentration of SiO2 (wt%) | Concentration of EG (wt%) | |
|---|---|---|---|
| CPCM2 | 88.2 | 9.8 | 2 |
| CPCM3 | 87.3 | 9.7 | 3 |
| CPCM4 | 86.4 | 9.6 | 4 |
| CPCM5 | 85.5 | 9.5 | 5 |
| CPCM6 | 84.6 | 9.4 | 6 |
4.3 Characterization
The experimental raw materials and the CPCM were characterized using the X'pert Powder X-ray diffractometer to analyze their crystalline phases.
Using the three-step method with a Differential Scanning Calorimeter (DSC), the apparent specific heat capacity of the LiNO3–KCl/SiO2/EG composite phase change material was measured within the temperature range of 10 °C to 200 °C. The calculation formula is expressed as eqn (4).
 | (4) |
Where CP,PCM is the measured apparent specific heat capacity of the sample, CP,SP is the specific heat capacity of sapphire, measured in J g−1 K−1; P represents the heat flux density, and m is the mass. Subscripts PCM denote the LiNO3–KCl/SiO2/EG composite phase change material, SP represents the sapphire reference sample, and bas indicates the baseline.
The samples were prepared as rectangular prisms with dimensions of 150 mm × 15 mm × 34 mm. The electrical performance was tested using the TH2511A DC low-resistance tester. The formula for calculating resistivity is given by  , where R is the measured resistance of the material, and S and L represent the cross-sectional area and length of the electrothermal conversion module (EThCM), respectively.
 | (5) |
In the expressions, CP represents the apparent specific heat capacity, and  denotes the integral of the apparent specific heat capacity with respect to temperature. The numerical value of this integral reflects the energy stored as the material's temperature increases from T0 to T1, measured in joules (J). The variable m denotes the mass of the material, measured in grams (g). The symbol P represents electrical power, and
  represents the integral of electrical power with respect to time. The numerical value of this integral indicates the energy output from the external power source during the time interval from t0 to t1, equivalent to the energy absorbed by the test material.
4.4 Numerical simulation
By conducting simulation and analysis of the EThCM, we aim to validate experimental results and simulate conditions that are currently impractical to achieve in reality. Additionally, utilizing simulation software for EThCM allows for high accuracy, ease of operation, quick data processing, and resource-saving under the premise of a well-designed simulation. In this study, the EThCM model was designed using Solidworks software, and numerical simulation and analysis calculations were performed using COMSOL software. This approach provides a reliable means to supplement experimental findings and explore scenarios that may be challenging or impossible to implement physically.This paper involves simulation content in three parts: electric heating simulation before and after sealing of the EThCM, and thermal simulation of indirect heating. Since the focus of simulation varies for these three parts, there are differences in the description of the physical models. Additionally, throughout the entire experimental process, heat conduction, convective heat transfer, and thermal radiation coexist. To simplify the calculation process, a series of assumptions need to be made for the computational model, and there are variations in the assumptions made for the three parts.
(1) Radiation heat transfer is neglected, and only conduction heat transfer is considered. (2) Contact thermal resistance and contact electrical resistance between the graphite electrodes and the composite phase-change material are ignored. (3) The physical properties of the graphite electrode are constant and do not change with an increase in temperature. (4) The graphite electrode and the composite phase-change material are assumed to be uniform and isotropic.
For the electrothermal conversion module model before sealing, the additional assumptions are as follows:
(1) Convective heat transfer is neglected, and the boundary condition for the outer wall of the module is adiabatic. (2) The physical properties of the composite phase-change material block are constant and do not change with an increase in temperature.
For the electrothermal conversion module model after sealing, the additional assumptions are as follows:
(1) Convective heat transfer is considered, and the outer wall of the module is subject to a heat flux boundary condition with a specified heat transfer coefficient of 4 W m−2 K−1. (2) The physical properties of the sealing compound are constant and do not change with an increase in temperature. The apparent specific heat capacity of the composite phase-change material block is considered a function of temperature. (3) Contact thermal resistance between the sealing compound and the composite phase-change material, as well as between the sealing compound and the electrodes, is neglected.
For the model of indirect heating, the additional assumptions are as follows:
(1) The electric heating plate is made of 316 stainless steel and is uniform and isotropic. (2) Contact thermal resistance between the electric heating plate and the composite phase-change material is neglected. (3) Convective heat transfer is considered, and a convective heat flux boundary condition is applied with a specified heat transfer coefficient of 10 W m−2 K−1.
(1) Material energy conservation equation
 | (6) |
In the equation, H represents the energy stored in the material, T0 denotes the initial temperature, and CP is the material's specific heat capacity at constant pressure.
(2) System energy conservation equation
 | (7) |
In the equation, ρ represents the material density, k denotes the material's thermal conductivity, T and t represent temperature and time, and ![[q with combining dot above]](https://www.rsc.org/images/entities/i_char_0071_0307.gif) is the heat generation density of the material.
is the heat generation density of the material.
(3) Initial conditions
Under the initial conditions, it is assumed that the temperature of the electrothermal conversion module is uniform, with an initial temperature T0 = 20 °C
| T(x, y, z) = T0 | (8) |
(4) Boundary conditions at the interface between graphite electrode and composite phase change materials
 | (9) |
In the expressions, kg represents the thermal conductivity of the graphite electrode, and kPCM represents the thermal conductivity of the CPCM block.
For the pre-encapsulation electrothermal conversion module, its supplementary governing equation is as follows:
Boundary conditions: during the simulation process, it is assumed that the outer wall of the electrothermal conversion module is adiabatic.
 | (10) |
For the post-encapsulation electrothermal conversion module, its supplementary governing equation is as follows:
Boundary conditions: the wall adopts a heat flux boundary condition with a specified heat transfer coefficient of 4 W m−2 K−1.
Boundary conditions at the interface between the graphite electrode and the encapsulation material are as follows:
 | (11) |
Boundary conditions at the interface between the CPCM and the encapsulation material are as follows:
 | (12) |
Where kP represents the thermal conductivity of the encapsulation material.
For the module incorporating the bonded heating element, its supplementary governing equation is as follows:
Boundary conditions: the wall adopts a heat flux boundary condition with a specified heat transfer coefficient of 10 W m−2 K−1.
Boundary conditions at the interface between the CPCM and the electric heating element are as follows:
 | (13) |
Where kE represents the thermal conductivity of the electric heating element.
Data availability
Data will be made available on request.Author contributions
Jiandong Zuo: data curation, investigation, writing – original draft. Hongjie Luo: investigation, validation, visualization. Ziye Ling: writing – review & editing, supervision. Zhengguo Zhang: conceptualization, project administration. Xiaoming Fang: methodology, supervision. Weiwei Zhang: funding acquisition, resources.Conflicts of interest
The authors declare that they have no known competing financial interests or personal relationships that could have appeared to influence the work reported in this paper.Acknowledgements
This work is supported by National Key R&D Program of China (No. 2022YFB2405204).References
- J. Markard, The next phase of the energy transition and its implications for research and policy, Nat. Energy, 2018, 3, 628–633 CrossRef.
- J. Wang, L. Chen, Z. Tan, E. Du, N. Liu, J. Ma, M. Sun, C. Li, J. Song, X. Lu, C.-W. Tan and G. He, Inherent spatiotemporal uncertainty of renewable power in China, Nat. Commun., 2023, 14, 5379 CrossRef CAS PubMed.
- H. Wang, E. Ci, X. Li, Y. Zhang, Z. Zhang and J. Li, Mg(NO3)2·6H2O-LiNO3 eutectic/expanded graphite composite phase change material for thermal energy storage applications, J. Energy Storage, 2022, 48, 103979 CrossRef.
- S. Wang, J. Zhang and Z. Zhu, Wind-thermal-energy storage system optimization: Evidence from simulations of the economical consumption of wind energy, Math. Probl. Eng., 2022, 2022, 7949419 Search PubMed.
- H. Ebrahimi, M. Abapour, B. Mohammadi-Ivatloo, S. Golshannavaz and A. Yazdaninejadi, Decentralized approach for security enhancement of wind-integrated energy systems coordinated with energy storages, Int. J. Energy Res., 2022, 46, 5006–5027 CrossRef.
- X. Li, X. Sheng, Y. Guo, X. Lu, H. Wu, Y. Chen, L. Zhang and J. Gu, Multifunctional HDPE/CNTs/PW composite phase change materials with excellent thermal and electrical conductivities, J. Mater. Sci. Technol., 2021, 86, 171–179 CrossRef CAS.
- Y. Fang, J. Su, Y. Tang, X. Liang, S. Wang, X. Gao and Z. Zhang, Form-stable Na2SO4·10H2O-Na2HPO4·12H2O eutectic/hydrophilic fumed silica composite phase change material with low supercooling and low thermal conductivity for indoor thermal comfort improvement, Int. J. Energy Res., 2020, 44, 3171–3182 CrossRef CAS.
- Z. Ling, J. Liu, Q. Wang, W. Lin, X. Fang and Z. Zhang, MgCl2·6H2O-Mg(NO3)2·6H2O eutectic/SiO2 composite phase change material with improved thermal reliability and enhanced thermal conductivity, Sol. Energy Mater. Sol. Cells, 2017, 172, 195–201 CrossRef CAS.
- R.-A. Mitran, D. Lincu, L. Buhălţeanu, D. Berger and C. Matei, Shape-stabilized phase change materials using molten NaNO3 – KNO3 eutectic and mesoporous silica matrices, Sol. Energy Mater. Sol. Cells, 2020, 215, 110644 CrossRef CAS.
- M. Qi, Z. Yelong, D. Hongliang, Y. Sa, W. Xuemeng, L. Li, L. Weiwei, J. Yi and T. Linghua, Interlayer spacing control strategy to construct the rapid thermal conductivity channel in the molten salt phase change materials, J. Energy Storage, 2023, 74, 109419 CrossRef.
- Z. Shuai, L. Ziyuan, Y. Yuanpeng, T. Limei and Y. Yuying, Heat transfer characteristics and compatibility of molten salt/ceramic porous composite phase change material, Nano Energy, 2022, 100, 107476 CrossRef.
- L. Chuan, L. Qi and G. Ruihuan, Comparative investigation of charging performance in shell and tube device containing molten salt based phase change materials for thermal energy storage, Case Stud. Therm. Eng., 2023, 43, 102804 CrossRef.
- M.-J. Li, B. Jin, Z. Ma and F. Yuan, Experimental and numerical study on the performance of a new high-temperature packed-bed thermal energy storage system with macroencapsulation of molten salt phase change material, Appl. Energy, 2018, 221, 1–15 CrossRef CAS.
- M. Maleki, H. Karimian, M. Shokouhimehr, R. Ahmadi, A. Valanezhad and A. Beitollahi, Development of graphitic domains in carbon foams for high efficient electro/photo-to-thermal energy conversion phase change composites, Chem. Eng. J., 2019, 362, 469–481 CrossRef CAS.
- F. Xue, Y. Lu, X.-d. Qi, J.-h. Yang and Y. Wang, Melamine foam-templated graphene nanoplatelet framework toward phase change materials with multiple energy conversion abilities, Chem. Eng. J., 2019, 365, 20–29 CrossRef CAS.
- H. Zhang, Q. Sun, Y. Yuan, Z. Zhang and X. Cao, A novel form-stable phase change composite with excellent thermal and electrical conductivities, Chem. Eng. J., 2018, 336, 342–351 CrossRef CAS.
- C. Xu, H. Zhang and G. Fang, Review on thermal conductivity improvement of phase change materials with enhanced additives for thermal energy storage, J. Energy Storage, 2022, 51, 104568 CrossRef.
- Q. Sun, N. Zhang, H. Zhang, X. Yu, Y. Ding and Y. Yuan, Functional phase change composites with highly efficient electrical to thermal energy conversion, Renewable Energy, 2020, 145, 2629–2636 CrossRef CAS.
- W. Aftab, A. Mahmood, W. Guo, M. Yousaf, H. Tabassum, X. Huang, Z. Liang, A. Cao and R. Zou, Polyurethane-based flexible and conductive phase change composites for energy conversion and storage, Energy Storage Mater., 2019, 20, 401–409 CrossRef.
- K. Yuan, Q. Chen, J. R. Ishengoma and W. Cao, An orthogonal investigation in pore size effect of EG on thermal properties and crystallinity of EG/CaCl2·6H2O composite, Sol. Energy Mater. Sol. Cells, 2022, 248, 111980 CrossRef CAS.
- W. Aftab, A. Usman, J. Shi, K. Yuan, M. Qin and R. Zou, Phase change material-integrated latent heat storage systems for sustainable energy solutions, Energy Environ. Sci., 2021, 14, 42684291 RSC.
- K. Yuan, Q. Chen, A. Zhang, N. Xiao, X. Zou and Z. Lin, Efficient thermal energy conversion and storage enabled by hybrid graphite nanoparticles/silica-encapsulated phase-change microcapsules, J. Mater. Chem. A, 2024, 12, 2456–2464 RSC.
- S. Y. Mun, H. M. Lim and S.-H. Lee, Thermal and electrical properties of epoxy composite with expanded graphite-ceramic core-shell hybrids, Mater. Res. Bull., 2018, 97, 19–23 CrossRef CAS.
- Q. Wang, D. Zhou, Y. Chen, P. Eames and Z. Wu, Characterization and effects of thermal cycling on the properties of paraffin/expanded graphite composites, Renewable Energy, 2020, 147, 1131–1138 CrossRef CAS.
- S. Gantayat, G. Prusty, D. R. Rout and S. K. Swain, Expanded graphite as a filler for epoxy matrix composites to improve their thermal, mechanical and electrical properties, New Carbon Mater., 2015, 30, 432–437 CrossRef CAS.
- R. Zheng, J. Gao, J. Wang and G. Chen, Reversible temperature regulation of electrical and thermal conductivity using liquid–solid phase transitions, Nat. Commun., 2011, 2, 289 CrossRef PubMed.
Footnote |
| † Electronic supplementary information (ESI) available. See DOI: https://doi.org/10.1039/d4im00009a |
| This journal is © Institute of Process Engineering of CAS 2024 |

