A single-column separation procedure for Sr, Nd, and Sm in small-size samples and high-precision isotope measurements using a TIMS with 1013 and 1012 Ω amplifiers†
Yu-Ming
Xu
 ab,
Gui-Qin
Wang
 *ac,
Zhen
Yang
ab,
Yu-Ling
Zeng
 ab and
Feng
Guo
a
aState Key Laboratory of Isotope Geochemistry, Guangzhou Institute of Geochemistry, Chinese Academy of Sciences, Guangzhou 510640, China. E-mail: xuyuming@gig.ac.cn; guiqinwang@gig.ac.cn; Tel: +86 02085290110
bUniversity of Chinese Academy of Sciences, Beijing 100049, China
cCAS Center for Excellence in Comparative Planetology, Hefei 230026, China
First published on 31st October 2023
Abstract
High-precision measurements of Sr, Nd, and Sm isotopes in precious and single mineral samples are significant in geochemistry and cosmochemistry. It is also a challenge for analytical techniques. In this study, a single-column separation procedure was developed using TODGA-normal resin to purify Sr, Nd, and Sm from microgeological samples (∼3 mg). The total chemical procedural blank for Sr, Nd, and Sm is less than 80, 7, and 3 pg, respectively; the recoveries are all greater than 91%. Methods have also been developed for the static measurement of Sr, Nd, and Sm isotopes in small size samples using a TIMS with Faraday cups and 1012 and 1013 Ω amplifiers. The accuracy and precision of Sr, Nd, and Sm isotope ratios were analyzed using TIMS with three single-element calibration solutions, SRM 987 Sr, La Jolla Nd, and Alfa Aesar Sm, respectively. The results show that the repeatability of 87Sr/86Sr, 142Nd/144Nd, 143Nd/144Nd, 149Sm/152Sm and 150Sm/152Sm ratios at 30 ng each of Sr, Nd, and Sm is 0.710248 ± 11, 141![[thin space (1/6-em)]](https://www.rsc.org/images/entities/char_2009.gif) 846 ± 25, 0.511852 ± 13, 0.516845 ± 17, and 0.275998 ± 9 (2 SD), respectively. Five geological rock reference materials and one meteorite sample were used to validate the developed chemical procedure and TIMS measurement methods for Sr, Nd, and Sm. The results indicate that Sr, Nd, and Sm isotope ratios of all samples are in agreement with the published data with a precision of 11–25 ppm (2 RSD). These methods are suitable for geochemistry and cosmochemistry studies for scarce samples.
846 ± 25, 0.511852 ± 13, 0.516845 ± 17, and 0.275998 ± 9 (2 SD), respectively. Five geological rock reference materials and one meteorite sample were used to validate the developed chemical procedure and TIMS measurement methods for Sr, Nd, and Sm. The results indicate that Sr, Nd, and Sm isotope ratios of all samples are in agreement with the published data with a precision of 11–25 ppm (2 RSD). These methods are suitable for geochemistry and cosmochemistry studies for scarce samples.
1 Introduction
The 87Rb–86Sr, 147Sm-143Nd, and 146Sm-142Nd isotope systems are important tools for dating and geochemical tracing, which have been widely used in the field of geochemistry and cosmochemistry.1–7 As long-lived radioisotope systems, both 87Rb–86Sr and 147Sm-143Nd can be applied to the chronological study of the whole history of planetary formation and evolution. On one hand, Rb, Sr, Sm, and Nd are all incompatible elements, but Rb is more incompatible than Sr, and Nd is more incompatible than Sm. Therefore, 87Rb–86Sr and 147Sm-143Nd isotope systems can be complementarily applied to date and trace geological processes such as magmatic activity, mantle–crust interaction, and high-grade metamorphism. On the other hand, the Rb–Sr isotope system is more easily disturbed by weathering or metamorphism, but the Sm–Nd system is not easily affected by these processes, making it a good complement for 87Rb–86Sr dating on the samples that experienced postcrystallization heating.3,8–11 In addition, 146Sm is a short-lived extinct nuclide, and the half-life of 146Sm decay to 142Nd is 103 Ma12 (or 68 Ma13), providing a good time constraint for geological events during the first 500 Ma after solar system formation.3,6,7,10,14 Extraterrestrial samples that are exposed to galactic cosmic rays may show alterations in Sm and Nd isotopic composition due to neutron capture. In particular, 149Sm with large neutron capture cross sections is commonly treated as a sensitive monitor for this process.10,15–19 Therefore, simultaneous high-precision analyses of Sr, Nd, and Sm isotopic ratios in the same sample are crucial for 87Rb–86Sr and 146, 147Sm-142, 143Nd isotopic system research in extraterrestrial samples.For conventional Sr and Nd isotope analyses, the sample weight is typically more than 50 mg.20–23 To eliminate matrix elements and isobaric interference elements for high-precision isotopic analysis, the purification of Sr and Nd commonly employed two-step,23–26 three-step,21,27–29 or four-step30 chromatography methods, which are tedious and time-consuming. Furthermore, the complex separation scheme may introduce higher total procedural blanks. Li et al.22,31 also reported a one-step separation scheme for Sr and Nd isotope analyses using a two-layered mixed-resin column. However, during their chemical procedure, the recovery of Sr was only 82%, and Nd was incompletely separated from other rare earth elements (REEs). Obviously, these methods are not suitable for Sr, Nd, and Sm isotope analyses of micro or scarce samples, such as meteorites, lunar and Martian rocks, and other scarce earth and extraterrestrial single minerals.
To effectively separate Sr and Nd of microgeological samples (<5 mg), one-step or two-step separation methods have been developed in recent years.32–34 Nevertheless, four problems remain: (1) Nd was not separated from other REEs, such as Ce and Sm, which may cause serious isobaric interference of 142Ce on 142Nd and 144Sm on 144Nd during the measurement of 142Nd/144Nd and 143Nd/144Nd;32 (2) the recovery of Nd was only ∼40%;34 (3) the total procedural blanks of Sr and Nd were high, making it difficult to obtain reliable analytical results;33 and (4) Sr, Nd, and Sm were not simultaneously separated from the same aliquot.32–34 Recently, a novel TODGA resin has been widely used to separate Nd,24,33,35–38 or Sr-Nd33,37 from geological samples in the field of geochemistry, and it also has great potential for simultaneous separation of Sr, Nd, and Sm.
Both thermal ionization mass spectrometry (TIMS) and multiple collector inductively coupled plasma mass spectrometry (MC-ICP-MS) are commonly used to analyze Sr, Nd, and Sm isotopes.22,23,26,27,31 Although MC-ICP MS has the advantages of high ionization efficiency and short analysis time, TIMS is more suitable for high-precision isotope measurements due to its better stability, less molecular interference, and absence of the memory effect of the transmission tube. The analytical precisions of 87Sr/86Sr, 143Nd/144Nd, 142Nd/144Nd, 149Sm/152Sm, and 150Sm/152Sm were improved to 3 ppm,39 6 ppm,40 6 ppm,40 8 ppm,17 and 18 ppm,17 (2 RSD), respectively, when Faraday cups (FCs) were connected with conventional 1011 Ω amplifiers on a TIMS. However, the sample loading amounts required are more than 500 ng for Sr, 500 ng for Nd, and 100 ng for Sm. Compared to the 1011 Ω current amplifiers, the signal/noise ratios of a TIMS equipped with the 1012 Ω and 1013 Ω amplifiers have been significantly improved by a factor of three to ten.41–44 Theoretically, the enhanced TIMS configuration can obtain high-precision isotopic compositions even for much smaller sample loadings.
In this study, we use the TODGA resin to develop a single-column separation method for separating Sr, Nd, and Sm from microgeological samples (<3 mg). During the chemical procedure, Sr, Nd, and Sm are sequentially and completely separated from the sample matrices and isobaric interferences (such as Rb, Ce, and Gd). The single-column separation can be finished within 5 hours, significantly simplifying the chemical procedure and shortening the separation time. We also establish a high-precision isotope determination method on very small samples (30 ng of Sr, Nd, and Sm) employing static FCs with 1012 and 1013 Ω amplifiers. To confirm the validity and repeatability of the presented method, five geological reference materials and a Jilin meteorite are analyzed. The results show that the ratios of 87Sr/86Sr, 142,143Nd/144Nd, and 149,150Sm/152Sm are consistent with the published data in the error range. Even if the sample size is less than one-tenth that of the conventional method, accurate and high-precision data can still be obtained by the developed methods.
2 Experimental section
The chemical procedures and the element content analyses are performed at the Guangxi Key Laboratory of Exploration for Hidden Metallic Ore Deposits, Guilin University of Technology. The major elements are measured by inductively coupled plasma-optical emission spectrometry (ICP-OES) (Avio 200, PerkinElmer, USA), and the trace elements are measured by inductively coupled plasma mass spectrometry (ICP-MS) (Agilent 7500cx, Agilent Technologies, USA). The isotopic compositions of Sr, Nd, and Sm are measured by TIMS (Triton Plus, Thermo Scientific, Germany) at the Guangzhou Institute of Geochemistry, Chinese Academy of Sciences (GIG, CAS).High-purity reagents during the chemical separation include (1) G4 grade (trace elements < 100 pg g−1) concentrated hydrochloric acid (HCl), nitric acid (HNO3), and hydrofluoric acid (HF) made in Shanghai Aoban Technology Company Limited, China; (2) ultra-pure water obtained from an 18 MΩ cm−1 grade Millipore purification system; (3) TaCl5 powder made in Alfa Aesar China Co., Ltd (Shanghai, China); and (4) a W ribbon (99.995%, 0.04 mm × 0.7 mm), Re ribbon (99.99%, 0.025 mm × 1 mm), and Ta ribbon (99.99%, 0.025 mm × 1 mm) made by H. Cross Company, USA.
2.1 Reference materials and samples
The multi-element synthetic solutions of alkaline earth elements (MISA-01-1, 100 μg mL−1) and rare earth elements (MISA-04-1, 100 μg mL−1) manufactured by AccuStandard, Inc. (USA) are used to calibrate the optimal acid type and concentrations for separating Sr, Sm, and Nd.Five international geological reference materials (GRMs) are chosen for this experiment, namely BIR-1a, BHVO-2, BCR-2, AGV-2, and GSP-2 (USGS, USA). These GRMs represent most of the igneous rock types on Earth, and are widely used for method validation and quality control in the fields of geochemistry.20–23 The mass fraction of Sr, Nd, and Sm is shown in Table 1. For comparison, we also analyzed the Jilin meteorite, an ordinary chondrite (OC) that is the most abundant type of meteorite in the solar system.
| Sample | Lithology | Column chemistry (mg) | Mass fraction | Isotopic analysis | ||||
|---|---|---|---|---|---|---|---|---|
| Sr (μg g−1) | Nd (μg g−1) | Sm (μg g−1) | Sr (ng) | Nd (ng) | Sm (ng) | |||
| a Note: element mass fractions are taken from the GeoReM database, http://georem.mpch-mainz.gwdg.de/. b Raczek et al. (2001).62 c Data determined in our laboratory. | ||||||||
| BIR-1aa | Basalt | 3 | 108.60 | 2.40 | 1.11 | 326 | 7 | 3 |
| BHVO-2a | Basalt | 3 | 394.10 | 24.27 | 6.02 | 1182 | 73 | 18 |
| BCR-2a | Basalt | 3 | 337.40 | 28.26 | 6.55 | 1012 | 85 | 20 |
| AGV-2a | Andesite | 3 | 659.50 | 30.49 | 5.51 | 1979 | 91 | 17 |
| GSP-2b | Granodiorite | 3 | 238.00 | 207.00 | 26.20 | 714 | 621 | 79 |
| Jilinc | OC (H5) | 30 | 9.03 | 0.55 | 0.18 | 271 | 17 | 5 |
The isotope standard solutions of NIST SRM 987 for Sr (purchased from the National Institute of Standards and Technology, USA), La Jolla for Nd (provided by Prof. Castillo, UCSD, USA),45 and Alfa Aesar for Sm (purchased from Alfa Aesar China Co., Ltd, Shanghai, China) are respectively used to set up the measurement method for Sr, Nd, and Sm isotope analyses by TIMS.
To ensure the homogeneity of the samples, approximately 30 mg GRMs and 90 mg Jilin meteorite are weighed and dissolved in 1 mL of concentrated HNO3 and 2 mL of concentrated HF in a 7 mL Teflon vessel. The sealed vessel is heated at 120 °C for 5 days. The solution is then evaporated and redissolved with 2 mL of 6 M HCl. This step is repeated twice to ensure complete elimination of fluoride. Finally, the solution is dried and re-dissolved with 2 mL of 3 M HNO3 for centrifugation, and the supernatant is separated and stored for subsequent column separation. Approximately one-tenth of the GRMs (3 mg) and one-third of the Jilin meteorite (30 mg) solution are loaded onto the TODGA column.
2.2 Column elution
A single-column separation scheme is employed for separating Sr, Nd, and Sm from small-size (3 mg) geological samples with TODGA-Normal resin (DN-B100-S, 50–100 μm, supplied by TrisKem International). The TODGA resin is pre-treated as described by Chu et al. (2019).36 The pre-cleaned PFA column, with a length of 3 cm, an inner diameter of 4 mm, and a reservoir of 15 mL, is packed with 0.25 mL TODGA resin. Before sample loading, the TODGA column is first cleaned with 3 mL of 0.05 M HCl and 3 mL of ultra-pure water, and then conditioned with 3 mL of 3 M HNO3. Subsequently, the sample solutions are loaded on the column. The matrix elements (such as Na, Mg, Al, K, Ti, Fe, Mn, and Ba) are eluted with 0.9 mL of 3 M HNO3, and Sr is collected with 1.2 mL of 4 M HNO3. After that, Ca is removed with 0.9 mL of 4 M HNO3 and 1.2 mL of 0.1 M HNO3, and light rare earth elements (La, Ce, and Pr) are eluted with 4 mL 2.5 M HCl. Finally, Nd and Sm are collected with 1.2 mL 1.2 M HCl and 2.5 mL 1.2 M HCl, respectively (Table 2). The whole procedure including pre-cleaning and pre-conditioning of the column takes a total time of ∼5 hours.| Procedure | Eluting reagent | Elution volume (mL) |
|---|---|---|
| Resin cleaning | 0.05 M HCl | 3 |
| Ultra-pure H2O | 3 | |
| Preconditioning | 3 M HNO3 | 3 |
| Loading sample | 3 M HNO3 | 0.2 |
| Rinsing matrix | 3 M HNO3 | 0.9 (0.3 × 3) |
| Collect Sr | 4 M HNO3 | 1.2 (0.3 × 4) |
| Rinsing Ca | 4 M HNO3 | 0.9 (0.3 × 3) |
| 0.1 M HNO3 | 1.2 (0.3 × 4) | |
| Rinsing La, Ce, and Pr | 2.5 M HCl | 4.0 (0.5 × 8) |
| Collect Nd | 1.2 M HCl | 1.2 (0.3 × 4) |
| Collect Sm | 1.2 M HCl | 2.5 (0.5 × 5) |
| Rinsing HREE | 1.2 M HCl | 0.5 |
| 0.05 M HCl | 2.0 (0.5 × 4) |
2.3 Mass spectrometry
The purified Sr, Nd, and Sm fractions of the five GRMs and the Jilin meteorite are evaporated to dryness and redissolved in 1 M HNO3 for isotopic analyses by TIMS (Triton Plus). The TIMS is equipped with ten FCs and three types of amplifiers, including one 1011 Ω, four 1012 Ω, and five 1013 Ω.45 The Sr isotopes are measured as Sr+ using a single W filament. Approximately 30 ng of Sr is loaded on pre-degassed W filaments using TaF5 as the activator with a “sandwich” loading technique. The Nd isotopes are measured as Nd+ using double Re filaments. Approximately 30 ng of Nd is loaded on pre-degassed Re filaments without any activators. The Sm isotopes are measured as Sm+ using a single Ta filament. Similar to Sr loading, approximately 30 ng of Sm is sandwiched by the TaF5 activator on pre-degassed Ta filaments.| Isotopes | Cup | L3 | L2 | L1 | C | H1 | H2 | H3 | H4 |
|---|---|---|---|---|---|---|---|---|---|
| Sr | Mass | 84Sr | 85Rb | 86Sr | 87Sr | 88Sr | — | — | — |
| Abundance (%) | 0.56 | — | 9.86 | 7 | 85.58 | — | — | — | |
| Amplifier | 1013Ω | 1013Ω | 1012Ω | 1012Ω | 1012Ω | — | — | — | |
| Nd | Mass | 140Ce | 142Nd | 143Nd | 144Nd | 145Nd | 146Nd | 147Sm | 148Nd |
| Abundance (%) | — | 27.20 | 12.20 | 23.80 | 8.30 | 17.20 | — | 5.70 | |
| Amplifier | 1013Ω | 1012Ω | 1012Ω | 1012Ω | 1013Ω | 1012Ω | 1013Ω | 1013Ω | |
| Sm | Mass | 146Nd | 147Sm | 148Sm | 149Sm | 150Sm | 152Sm | 154Sm | 155Gd |
| Abundance (%) | — | 15.0 | 11.2 | 13.8 | 7.4 | 26.70 | 22.7 | — | |
| Amplifier | 1013Ω | 1012Ω | 1013Ω | 1012Ω | 1013Ω | 1012Ω | 1012Ω | 1013Ω |
2.3.2.1 Strontium. The Sr isotopes are measured at 4000–4500 mA (1400–1500 °C). The typical ion beam intensity (88Sr+) ranges from 0.1 to 3 V for all samples. Data acquisition consists of 10 blocks of 20 circles, with 4.194 s integration time and 12 s idle time per circle. The isobaric interference of 87Rb on 87Sr is corrected using a natural abundance ratio of 87Rb/85Rb = 0.3860. The instrumental mass fractionation of 87Sr/86Sr ratios is corrected using 88Sr/86Sr = 8.375209 with an exponential law.
2.3.2.2 Neodymium. During the Nd isotope measurement, the ionization filament is heated to ∼3000 mA (1300–1400 °C), and the evaporation filament is heated to 1200–2000 mA. The 142Nd+ ion beam intensity of the La Jolla Nd standard is 0.1–0.3 V. For rock samples, the 142Nd+ ion beam intensities for BHVO-2, AGV-2, and GSP-2 are ∼0.2 V and are <0.1 V for BCR-2, BIR-1a, and the Jilin meteorite. Each measurement consists of 10 blocks of 20 circles, with 8.389 s integration time and 12 s idle time per circle. The isobaric interference of 142Ce (on 142Nd), 144Sm (on 144Nd), and 148Sm (on 148Nd) are corrected using natural abundance ratios of 147Sm/144Sm = 4.8827, 147Sm/148Sm = 1.3336, and 140Ce/142Ce = 7.9584, respectively. Finally, the mass fractionations of both 142Nd/144Nd and 143Nd/144Nd ratios are corrected using 146Nd/144Nd = 0.7219 with an exponential law.
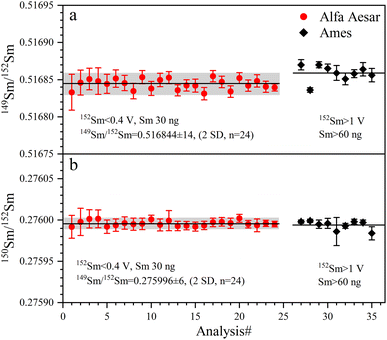
2.3.2.3 Samarium. In the course of Sm isotope analysis, the evaporation filament current is increased up to 3250–3550 mA (1400–1550 °C). The typical 152Sm+ ion beam intensity of the Alfa Aesar Sm standard is 0.1–0.4 V. For rock samples, the 152Sm+ ion beam intensities for all GRMs can be achieved at 0.3 V, except for BIR-1a and the Jilin meteorite, for which the 152Sm+ signals are less than 0.1 V. Each measurement consists of 10 blocks of 20 circles, with 8.389 s integration time and 12 s idle time per circle. The isobaric interferences of 148Nd (on 148Sm), 150Nd (on 150Sm), 152Gd (on 152Sm), and 154Gd (on 154Sm) are corrected using 148Nd/146Nd = 0.3314, 150Nd/146Nd = 0.3255, 152Gd/155Gd = 0.0135 and 154Gd/155Gd = 0.1473, respectively. The mass fractionations of 149Sm/152Sm and 150Sm/152Sm ratios are corrected using 147Sm/152Sm = 0.56081 with an exponential law.
3 Results and discussion
3.1 Elution profiles of Sr, Nd, and Sm
We have developed a rapid single-column separation protocol to extract Sr, Nd, and Sm from small-size samples with TODGA resin. In the following section, we first test the elution profiles with mixed synthetic solutions (MISA-04-1 and MISA-01-1, 100 ng mL−1) to calibrate the type, concentration, and volume of the eluent to separate Sr, Nd, and Sm. Then, different GRM samples and the Jilin meteorite with various lithologies and trace element contents are processed to verify the reproducibility of the chemical procedure.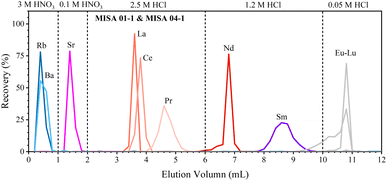 | ||
| Fig. 1 Elution profiles of Sr, Nd, and Sm. Separation is performed using 0.2 mL 100 ng g−1 MISA synthetic solution and 0.25 mL TODGA resin. | ||
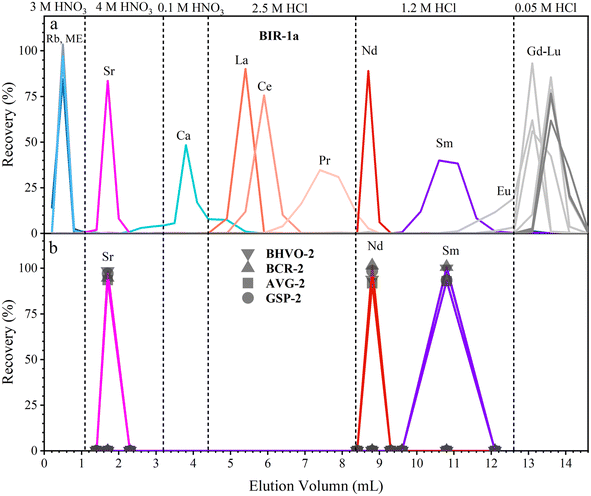
During the separation of geological samples, the effect of major elements (including Na, Mg, Al, K, Ti, Mn, and Fe) should be evaluated, especially for Ca which is overloaded on the TODGA column for high-Ca samples;37 hence, we have to adjust the concentration, volume and leaching sequence of the eluent. For the sake of brevity, we only take the dissolved sample solution containing 3 mg BIR-1a (high-Ca basalt) as an example to test the elution profile (Fig. 2a). Almost all of the matrix elements (including Na, Mg, Al, K, Ti, Mn, Fe, and Ba, except Ca) together with the interference element (Rb) are easily rinsed with 0.8 mL of 3 M HNO3 due to their weak retention on the TODGA resin in 3 M HNO3. Then, Sr is successfully separated from Ca with 2.1 mL of 4 M HNO3 and 1.2 mL of 0.1 M HNO3. Most of Ca (92%) is leached out in these steps, and the residual Ca together with La, Ce, and Pr is leached in 4 mL of 2.5 M HCl. Finally, Nd and Sm are collected with 1.2 mL of 1.2 M HCl and 2.5 mL of 1.2 M HCl, respectively. Using the improved procedure (Table 2 and Fig. 2), Sr, Nd, and Sm are successfully separated in the other GRMs (BHVO-2, BCR-2, AGV-2, and GSP-2). The collected intervals of Sr (1.2 mL of 4 M HNO3), Nd (1.2 mL of 1.2 M HCl), and Sm (3 mL of 1.2 M HCl) of all GRMs have similar distribution patterns (Fig. 2b), demonstrating good reproducibility of our procedure.
During the 1.2 mL of 4 M HNO3 elution step, the recovery of Sr is greater than 92%. Almost all of the Rb and Ca has been removed in this fraction. The recovery of Nd during the 1.2 mL of 1.2 M HCl elution step is greater than 91%. The complete separation of Nd from Ce and Sm allows us to avoid isobaric interference of 142Ce and 142Nd, respectively, on 144Sm and 144Nd, which is particularly important for the accurate determination of 142Nd/144Nd and 143Nd/144Nd. The recovery of Sm during the 2.5 mL of 1.2 M HCl elution step is greater than 93%. Almost no Nd and Gd is detected in this fraction. The total procedural blanks including sample digestion and chemical separation are less than 0.1% (80 pg of Sr, 7 pg of Nd, and 3 pg of Sm), which is negligible relative to the amounts of the analytes contained in 3 mg GRMs.34
| Reference | Separation methods | Analytes | Sample-size | Resin | Elution volume | Recovery | Blanks | Separation duration | Instrument | Amplifiers (Ω) |
|---|---|---|---|---|---|---|---|---|---|---|
| Li et al.22 | One-step | Sr, Nd, Hf | 50–60 mg | 1.6 mL AG50W × 12 | 53 mL | Sr: 71% | Sr: 170–200 pg | 9 h | TIMS | 1011 |
| 0.4 mL Ln spec | Nd (REE): 96% | Nd: 70–80 pg | ||||||||
| Lei et al.23 | Two-step | Sr, Nd, Pb, Hf | 100–200 mg | 0.8 mL AG50W-X8 | 102 mL | Sr: 86% | Sr: 48 pg | 7.5 h | TIMS | 1011 |
| 1.5 mL Ln spec | Nd: 93% | Nd: 36 pg | ||||||||
| 0.5 mL Sr spec | ||||||||||
| Yang et al.21 | Three-step | Lu, Hf, Rb, Sr, Sm, Nd | 100 mg | 2 mL Ln spec | 168 mL | Rb: 90% | Rb: 50 pg | 3 days | TIMS | 1011 |
| 2 mL AG50W × 12 | Sr: 90% | Sr: 100 pg | ||||||||
| Nd: 90% | Nd: 50 pg | |||||||||
| Sm: 90% | Sm: 50 pg | |||||||||
| Pin et al.30 | Four-step | Nd | 100–200 mg | 0.25 mL TRU. Spec | 24.7 mL | Nd: 80–90% | Nd: 30 pg | 2 days | TIMS | 1011 |
| 0.95 mL Ln2 spec | ||||||||||
| 0.95 mL TODGA | ||||||||||
| Misawa et al.32 | Two-step | Sr, REE | 1–5 mg | 80 μl RE resin | 4.7 mL | Nd (REE): 90% | Nd: 3 pg | — | TIMS | — |
| 50 μl Sr resin | Sr: 93–98% | Sr: 36 pg | ||||||||
| Li et al.34 | One-step | Nd, Sm | 1–3.5 mg | 1.7 mL Ln spec | 46.6 mL | Nd: 40% | Nd: 8 pg | 2–3 h | TIMS | 1011 |
| Sm: 90% | Sm: 3 pg | |||||||||
| Retzmann et al.33 | One-step | Sr, Nd, Pb | 5 mg | 1 mL TODGA | 66 mL | Sr: 90% | Sr: 350 pg | 2 h | MC-ICP MS | — |
| Nd: 91% | Nd: 2280 pg | |||||||||
| This study | One-step | Sr, Nd, Sm | 3 mg | 0.25 mL TODGA | 14.6 mL | Sr: 92% | Sr: 80 pg | 5 h | TIMS | 1012 + 1013 |
| Nd: 91% | Nd: 7 pg | |||||||||
| Sm: 93% | Sm: 3 pg |
3.2 Isotopic compositions of Sr, Nd, and Sm measured by TIMS
With the advent of the 1013 Ω amplifier, several high-precision TIMS methods for Sr and Nd isotopes analyses have been reported for small-size samples,42,46 but Sm isotope measurement using 1013 Ω amplifiers has not yet been reported. In this work, static measurement methods for Sr, Nd, and Sm isotopes in small size samples were set up using FCs connected to 1012 and 1013 Ω amplifiers of a TIMS. We analyzed different signal intensities and analytical amounts for Sr, Nd, and Sm isotopes. These methods significantly improve the precision of Sr, Nd, and Sm isotopic ratios for small-size/low-content samples compared to the conventional methods using 1011 Ω amplifiers.Single element calibration solutions of NIST SRM 987, La Jolla Nd, and Alfa Aesar Sm are measured to evaluate the accuracy and precision of Sr, Nd, and Sm isotope ratios using our new cup configurations on the TIMS. Five processed GRM samples and one Jilin meteorite sample are also measured to evaluate the validity and feasibility of the presented method. All analytical results are shown in Table 5.
| 87Sr/88Sr | n | 142Nd/144Nd | 143Nd/144Nd | n | 149Sm/152Sm | 150Sm/152Sm | n | |
|---|---|---|---|---|---|---|---|---|
| a Data are analyzed in this study; “n” is the number of repeated measurements of the same aliquot; “#” indicates one sample separated by the single resin column; Reference: range of published data, references are listed in square brackets below. The uncertainty is the last digit of 2 SD. | ||||||||
| Calibration solutions | ||||||||
| NIST SRM 987 | La Jolla Nd | Alfa Aesar Sm | ||||||
| Meana | 0.710248 ± 11 | 18 | 1.141846 ± 25 | 0.511852 ± 13 | 24 | 0.516844 ± 14 | 0.275996 ± 6 | 24 |
| Reference | 0.710241–0.710268 [ref. 20, 22, 23, 26, 27, 31 and 47–49] | — | 1.141833–1.141838 [ref. 15, 18, 19, 52 and 53] | 0.511839–0.511853 [ref. 15, 18, 19, 49, 50, 52 and 53] | — | No data | No data | — |
![[thin space (1/6-em)]](https://www.rsc.org/images/entities/char_2009.gif) |
||||||||
| BHVO-2 | ||||||||
| #1 | 0.703477 ± 14 | 3 | 1.141830 ± 28 | 0.512971 ± 19 | 3 | 0.516853 ± 19 | 0.275996 ± 8 | 3 |
| #2 | 0.703474 ± 19 | 3 | 1.141835 ± 43 | 0.512970 ± 9 | 3 | 0.516846 ± 16 | 0.275998 ± 15 | 3 |
| Meana | 0.703475 ± 15 | 6 | 1.141833 ± 33 | 0.512970 ± 13 | 6 | 0.516849 ± 18 | 0.275997 ± 11 | 6 |
| Reference | 0.703475–0.703493 [ref. 20, 22, 23, 27, 28, 31, 47–50 and 63] | — | 1.141833–1.141838 [ref. 30, 38 and 55] | 0.512957–0.512987 [ref. 20, 22, 27, 30, 38, 49 and 55] | — | 0.516860 [ref. 59] | 0.275988 [ref. 59] | — |
![[thin space (1/6-em)]](https://www.rsc.org/images/entities/char_2009.gif) |
||||||||
| BCR-2 | ||||||||
| #1 | 0.704998 ± 19 | 3 | 1.141865 ± 45 | 0.512633 ± 29 | 3 | 0.516845 ± 20 | 0.275998 ± 9 | 3 |
| #2 | 0.705003 ± 10 | 3 | 1.141839 ± 36 | 0.512637 ± 23 | 3 | 0.516833 ± 23 | 0.275994 ± 8 | 3 |
| Meana | 0.705000 ± 15 | 6 | 1.141852 ± 46 | 0.512635 ± 24 | 6 | 0.516839 ± 23 | 0.275996 ± 9 | 6 |
| Reference | 0.705000–0.705032 [ref. 20, 22, 23, 27, 28, 31, 47–50 and 63] | — | 1.141835–1.141854 [ref. 18, 38, 40, 55 and 56] | 0.512620–0.512638 [ref. 18, 20, 22, 28, 38, 40, 49 and 56] | — | 0.516853–0.516857 [ref. 18 and 59] | 0.275990–0.275993 [ref. 18 and 59] | — |
![[thin space (1/6-em)]](https://www.rsc.org/images/entities/char_2009.gif) |
||||||||
| AGV-2 | ||||||||
| #1 | 0.703979 ± 5 | 3 | 1.141856 ± 52 | 0.512777 ± 24 | 3 | 0.516838 ± 14 | 0.275989 ± 8 | 3 |
| #2 | 0.703978 ± 12 | 3 | 1.141860 ± 42 | 0.512768 ± 13 | 3 | 0.516847 ± 29 | 0.275995 ± 18 | 3 |
| Meana | 0.703979 ± 8 | 6 | 1.141853 ± 40 | 0.512771 ± 19 | 6 | 0.516842 ± 22 | 0.275992 ± 14 | 6 |
| Reference | 0.703970–0.703994 [ref. 23, 31, 39 and 47–50] | — | 1.141836 [ref. 55] | 0.512755–0.512790 [ref. 31, 49, 50 and 55] | — | No data | No data | — |
![[thin space (1/6-em)]](https://www.rsc.org/images/entities/char_2009.gif) |
||||||||
| GSP-2 | ||||||||
| #1 | 0.765035 ± 7 | 3 | 1.141855 ± 42 | 0.511368 ± 23 | 3 | 0.516856 ± 18 | 0.275989 ± 10 | 3 |
| #2 | 0.765041 ± 9 | 3 | 1.141871 ± 43 | 0.511370 ± 16 | 3 | 0.516853 ± 8 | 0.275994 ± 15 | 3 |
| Meana | 0.765038 ± 10 | 6 | 1.141863 ± 42 | 0.511369 ± 18 | 6 | 0.516854 ± 12 | 0.275992 ± 13 | 6 |
| Reference | 0.764954–0.765177 [ref. 20 and 48–50] | — | 1.141835 [ref. 55] | 0.511348–0.511369 [ref. 27, 31, 49, 50 and 55] | — | No data | No data | — |
![[thin space (1/6-em)]](https://www.rsc.org/images/entities/char_2009.gif) |
||||||||
| BIR-1a | ||||||||
| #1 | 0.703107 ± 6 | 3 | 1.141840 ± 45 | 0.513098 ± 10 | 3 | 0.516858 ± 15 | 0.275994 ± 7 | 2 |
| #2 | 0.703104 ± 13 | 3 | 1.141854 ± 31 | 0.513093 ± 44 | 3 | 0.516857 ± 21 | 0.275993 ± 9 | 2 |
| Meana | 0.703107 ± 10 | 6 | 1.141847 ± 38 | 0.513096 ± 29 | 6 | 0.516858 ± 19 | 0.275994 ± 9 | 4 |
| Reference | 0.703104–0.703116 [ref. 20, 22, 26 and 31] | — | 1.141835–1.141866 [ref. 30 and 56] | 0.513078–0.513101 [ref. 20, 22, 26, 30, 31 and 56] | — | No data | No data | — |
![[thin space (1/6-em)]](https://www.rsc.org/images/entities/char_2009.gif) |
||||||||
| Jilin | ||||||||
| #1a | 0.746757 ± 11 | 3 | 1.141841 ± 39 | 0.512586 ± 15 | 3 | 0.516855 ± 10 | 0.275999 ± 6 | 3 |
| Reference | 0.7464 [ref. 51] | — | 1.141801 ± 6 [ref. 19] | 0.512581 ± 3 [ref. 19] | 3 | No data | No data | — |
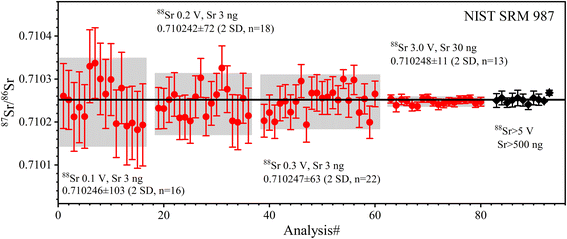 | ||
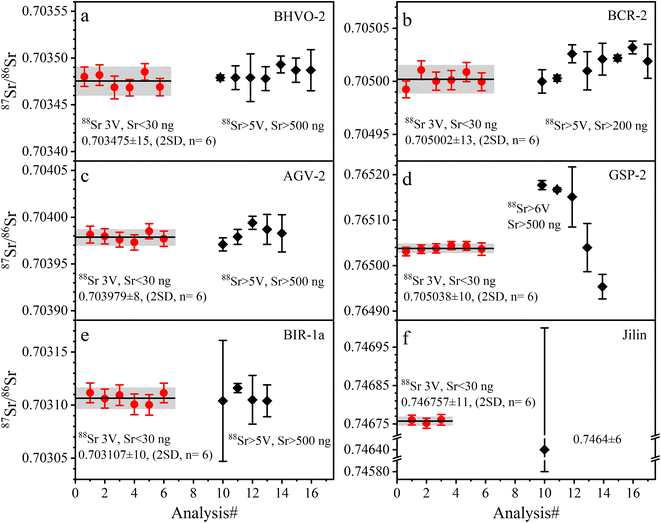
| Fig. 3 The accuracy and precision of 87Sr/86Sr ratios measured with SRM 987 solution at different ion beam signals and Sr amounts. The solid red circles are the data from this study; the solid black diamonds are published data, the source of which is shown in Table 5. The error bars for each data point in this study are internal precision of 2 SE. The error bars of published data are external precision of 2 SD; the black line is the average value of the published data. The precision and symbols in the following figures are represented as in this figure. | ||
The determined 87Sr/86Sr ratios of five GRMs (BIR-1a, BHVO-2, BCR-2, AGV-2, and GSP-2) and the Jilin meteorite are shown in Table 5 and plotted in Fig. 4. The external repeatability of 87Sr/86Sr for all samples is better than 21 ppm (2 RSD). The average 87Sr/86Sr ratio of BHVO-2 is 0.703475 ± 15 (2 SD, n = 6), compatible with the value of 0.703479 ± 13 (2 SD, n = 2) measured at a 88Sr signal of 5 V reported by Li et al.20 The average 87Sr/86Sr ratio of BCR-2 is 0.705002 ± 13 (2 SD, n = 6), consistent with the value of 0.705000 ± 11 (2 SD, n = 21) at 4.5 V reported by Jweda et al.28 The 87Sr/86Sr ratio of AGV-2 is 0.703979 ± 8 (2 SD, n = 6), identical to the value of 0.703979 ± 8 (2 SD, n = 4) at 5–7 V reported by Li et al.31 The average 87Sr/86Sr ratio of BIR-1a is 0.703107 ± 10 (2 SD, n = 6), compatible with the value of 0.703104 ± 15 (2 SD, n = 6) at 5 V reported by Li et al.20 The average 87Sr/86Sr ratio of GSP-2 is 0.765038 ± 10 (2 SD, n = 6). It is noteworthy that the reported 87Sr/86Sr ratios of GSP-2 show a large variation (Fig. 4d), ranging from 0.764962 to 0.765177,20,27,48–50 which have been attributed to the sample heterogeneity.27,50 Our obtained 87Sr/86Sr ratios of GRMs are consistent with these reported data, demonstrating the good accuracy of Sr isotope measurement (Fig. 4). Nevertheless, the average 87Sr/86Sr ratio of the Jilin meteorite is 0.746757 ± 11 (2 SD, n = 3), roughly approximate to a few published data (87Sr/86Sr = 0.7464 ± 6) with large analytical uncertainties.51
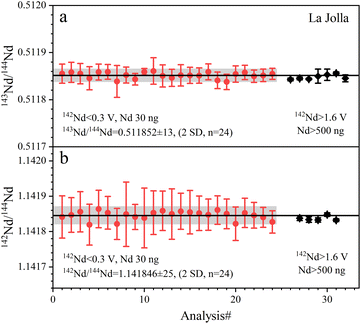 | ||
| Fig. 5 The accuracy and precision of Nd isotope ratios measured with La Jolla Nd solution. The black lines represent the average values of the data from this study. | ||
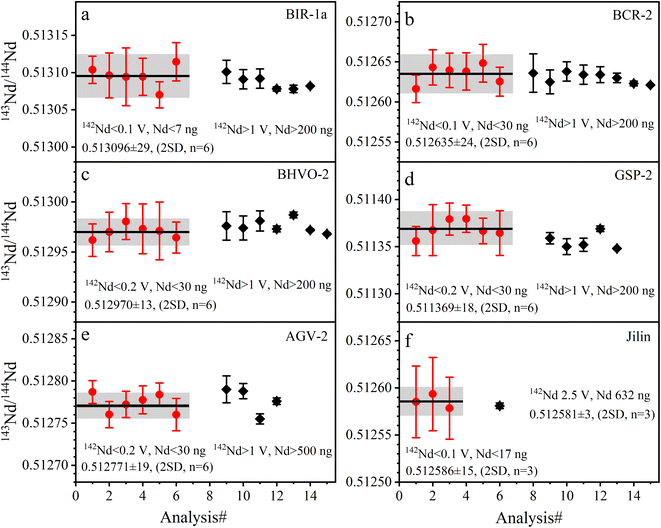
The determined 143Nd/144Nd ratios of five GRMs and the Jilin meteorite are listed in Table 5 and plotted in Fig. 6. The external repeatabilities of 143Nd/144Nd are 47–57 ppm (2 RSD) for BIR-1a and BCR-2, and 25–37 ppm (2 RSD) for BHVO-2, GSP-2, AGV-2, and the Jilin meteorite. The average 143Nd/144Nd ratio of BIR-1a is 0.513096 ± 29 (2 SD, n = 6), compatible with the values of 0.513092 ± 13 (2 SD, n = 4) reported by Li et al.31 The average 143Nd/144Nd ratio of BCR-2 is 0.512635 ± 24 (2 SD, n = 6), consistent with the values of 0.512636 ± 24 (2 SD, n = 2) reported by Li et al.20 The average 143Nd/144Nd ratio of BHVO-2 is 0.512970 ± 13 (2 SD, n = 6), compatible with the values of 0.512976 ± 14 (2 SD, n = 2) reported by Li et al.22 and 0.512974 ± 12 (2 SD, n = 4) reported by Hui et al.27 The average 143Nd/144Nd ratio of GSP-2 is 0.511369 ± 18 (2 SD, n = 6), identical to the values of 0.511369 ± 3 (2 SD, n = 5) reported by Weis et al.49 The average 143Nd/144Nd ratio of AGV-2 is 0.512771 ± 19 (2 SD, n = 6), compatible with the values of 0.512776 ± 4 (2 SE, n = 1) reported by Li et al.31 The average 143Nd/144Nd ratio of the Jilin meteorite is 0.512586 ± 15 (2 SD, n = 6), consistent with the values of 0.512581 ± 3 (2 SD, n = 3) reported by Gannoun et al.19 As shown in Fig. 6, our determined 143Nd/144Nd ratios of GRMs and the Jilin meteorite are all in good agreement with published data within the analytical uncertainties,18,20,22,27,28,31,38,40,49,50,55,56 demonstrating the accuracy of Nd isotope measurement.
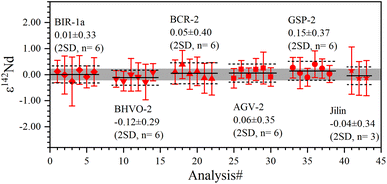
The 142Nd/144Nd ratios of GRMs and the Jilin meteorite are reported utilizing the ε-notation and plotted in Fig. 7. The external reproducibilities of ε142Nd for all samples are better than ± 0.40 (2 SD). The average ε142Nd values of BIR-1a, BHVO-2, BCR-2, AGV-2, GSP-2, and the Jilin meteorite are 0.01 ± 0.33, −0.12 ± 0.29, 0.05 ± 0.40, 0.06 ± 0.35, 0.15 ± 0.37 (2 SD, n = 6), and −0.04 ± 0.34 (2 SD, n = 3), respectively. As shown in Fig. 7, the average ε142Nd values of all samples are plotted within the ranges of analytical uncertainties (±0.22) determined on the La Jolla standard, indicating that no significant 142Nd anomaly is detected in our study, which is also consistent with other published data.30,38,55,56 However, the relatively large analytical uncertainty of ε142Nd (±0.22) fails to distinguish an ε142Nd anomaly less than 40 ppm.
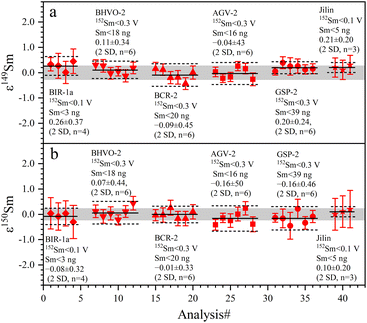
The determined 149Sm/152Sm and 150Sm/152Sm ratios of GRMs and the Jilin meteorite are also reported as the ε-notation (εiSm = [(iSm/152Sm)sample/(iSm/152Sm)Alfa Aesar Sm − 1] × 104), as shown in Fig. 9. The external repeatabilities of ε149Sm and ε150Sm for all samples are better than ±0.45 (2 SD) and ±0.50 (2 SD), respectively. The average ε149Sm and ε150Sm values in this study are identical to those of the Alfa Aesar Sm standard within the ranges of the external reproducibilities of ±0.27 (2 SD) and ±0.23 (2 SD) for ε149Sm and ε150Sm, respectively, suggesting the absence of significant ε149Sm and ε150Sm anomalies for the studied samples. Only a few ε149Sm and ε150Sm values of BCR-2 and BHVO-2 have been found in the literature, e.g., BCR-2 spans ε149Sm and ε150Sm ranges from −0.15 to 0.06 and −0.22 to 0.04, respectively,18,59 while BHVO-2 has ε149Sm and ε150Sm values of −0.10 and −0.29,59 respectively, consistent with the data determined in this study. Therefore, our Sm isotope measurement method can meet the demand to resolve the Sm isotopic shift caused by neutron capture correction in the field of cosmochemistry, e.g., the largest ε149Sm and ε150Sm anomaly of the irradiated lunar sample achieved from −43 to +81, respectively.60,61
4 Conclusion
We develop a simple and rapid single-column separation protocol for separating Sr, Nd, and Sm from microgeological samples (3 mg) with TODGA resin and optimize the cup configuration of a TIMS for high-precision isotope determination. The advantages of our separation scheme include (1) low sample consumption (∼3 mg); (2) efficient and time-saving (∼5 hours); (3) negligible procedural blanks (80 pg of Sr, 7 pg of Nd, and 3 pg of Sm); and (4) high recoveries (>91%) and simultaneous separation of Sr, Nd, and Sm from the same aliquot. In addition, a second Sr Spec column is required to further purify Sr for ultra-low concentration samples with Sr, Nd, and Sm less than 1 μg g−1, such as the Jilin meteorite. For very small samples (30 ng of Sr, Nd, and Sm), a Triton Plus TIMS equipped with 1013 and 1012 Ω amplifiers can also obtain high-precision Sr, Nd, and Sm isotope ratios. Repeated analyses on five GRMs and the Jilin meteorite yield 87Sr/86Sr, 142,143Nd/144Nd, and 149,150Sm/152Sm ratios compatible with the published data within uncertainty, demonstrating excellent validation and repeatability. Our new chemical separation scheme and isotope determination method have great potential for 87Rb–86Sr and 147Sm-143Nd isotopic dating and geochemical tracing in the field of geochemistry and cosmochemistry.Author contributions
Gui-Qin Wang: conceptualization, methodology, writing – review & editing, data curation, funding acquisition; Yu-Ming Xu: chemical experiments, TIMS measurement, writing – review & editing, data curation; Zhen Yang: chemical experiments, TIMS measurement; Yuling Zeng: TIMS measurement; Feng Guo: supervision, reviewing and editing the manuscript.Conflicts of interest
There are no conflicts of interest to declare.Acknowledgements
The authors had the great honor of applying for the Chang'e-5 lunar samples allocated by the China National Space Administration (CNSA), for which we developed this method for high-precision measurements of Sr, Nd, and Sm isotopes in this sample, as well as in other similar small-size samples. This study was financially supported by the Strategic Priority Research Program of the Chinese Academy of Sciences (XDB 41000000) and the National Natural Science Foundation of China (42073061). We would like to thank Dr Zheng-Lin Li and Dr Yin-Hui Zhang, technicians at the Guangxi Key Laboratory of Exploration for Hidden Metallic Ore Deposits, Guilin University of Technology, for their help throughout the process of establishing the chemical separation and purification procedure. Thanks to the two anonymous reviewers for their constructive comments, which improved the quality of the manuscript. This is contribution no. IS-3398 from GIGCAS.Notes and references
- G. A. Snyder, L. A. Taylor and A. N. Halliday, Geochim. Cosmochim. Acta, 1995, 59, 1185–1203 CrossRef CAS.
- J. Edmunson, L. E. Borg, L. E. Nyquist and Y. Asmerom, Geochim. Cosmochim. Acta, 2009, 73, 514–527 CrossRef CAS.
- N. E. Marks, L. E. Borg, C. K. Shearer and W. S. Cassata, J. Geophys. Res.: Planets, 2019, 124, 2465–2481 CrossRef CAS PubMed.
- H. Hui, C. R. Neal, C.-Y. Shih and L. E. Nyquist, Earth Planet. Sci. Lett., 2013, 373, 150–159 CrossRef CAS.
- L. E. Borg, G. A. Brennecka and T. S. Kruijer, Proc. Natl. Acad. Sci. U. S. A., 2022, 119, e2115726119 CrossRef CAS PubMed.
- R. W. Carlson, L. E. Borg, A. M. Gaffney and M. Boyet, Philos. Trans. R. Soc., A, 2014, 372, 20130246 CrossRef PubMed.
- L. E. Borg, J. N. Connelly, W. S. Cassata, A. M. Gaffney and M. Bizzarro, Geochim. Cosmochim. Acta, 2017, 201, 377–391 CrossRef CAS.
- M. Boyet, R. W. Carlson, L. E. Borg and M. Horan, Geochim. Cosmochim. Acta, 2015, 148, 203–218 CrossRef CAS.
- C. K. Sio, L. E. Borg and W. S. Cassata, Earth Planet. Sci. Lett., 2020, 538, 116–219 CrossRef.
- L. E. Borg, J. N. Connelly, M. Boyet and R. W. Carlson, Nature, 2011, 477, 70 CrossRef CAS PubMed.
- L. E. Borg, A. M. Gaffney and C. K. Shearer, Meteorit. Planet. Sci., 2015, 50, 715–732 CrossRef CAS.
- N. E. Marks, L. E. Borg, I. D. Hutcheon, B. Jacobsen and R. N. Clayton, Earth Planet. Sci. Lett., 2014, 405, 15–24 CrossRef CAS.
- N. Kinoshita, M. Paul, Y. Kashiv, P. Collon, C. M. Deibel, B. DiGiovine, J. P. Greene, D. J. Henderson, C. L. Jiang, S. T. Marley, T. Nakanishi, R. C. Pardo, K. E. Rehm, D. Robertson, R. Scott, C. Schmitt, X. D. Tang, R. Vondrasek and A. Yokoyama, Science, 2012, 335, 1614–1617 CrossRef CAS PubMed.
- A. M. Gaffney and L. E. Borg, Geochim. Cosmochim. Acta, 2014, 140, 227–240 CrossRef CAS.
- K. Rankenburg, A. D. Brandon and C. R. Neal, Science, 2006, 312, 1369–1372 CrossRef CAS PubMed.
- A. D. Brandon, T. J. Lapen, V. Debaille, B. L. Beard, K. Rankenburg and C. Neal, Geochim. Cosmochim. Acta, 2009, 73, 6421–6445 CrossRef CAS.
- C. L. McLeod, A. D. Brandon and R. M. G. Armytage, Earth Planet. Sci. Lett., 2014, 396, 179–189 CrossRef CAS.
- L. E. Borg, G. A. Brennecka and S. J. K. Symes, Geochim. Cosmochim. Acta, 2016, 175, 150–167 CrossRef CAS.
- A. Gannoun, M. Boyet, H. Rizo and A. El Goresy, Proc. Natl. Acad. Sci. U. S. A., 2011, 108, 7693–7697 CrossRef CAS PubMed.
- C. F. Li, X. H. Li, Q. L. Li, J. H. Guo, X. H. Li and Y. H. Yang, Anal. Chim. Acta, 2012, 727, 54–60 CrossRef CAS PubMed.
- Y. H. Yang, H. F. Zhang, Z. Y. Chu, L. W. Xie and F. Y. Wu, Int. J. Mass Spectrom., 2010, 290, 120–126 CrossRef CAS.
- C. F. Li, J. H. Guo, Y. H. Yang, Z. Y. Chu and X. C. Wang, J. Anal. At. Spectrom., 2014, 29, 1467–1476 RSC.
- H. L. Lei, T. Yang, S. Y. Jiang and W. Pu, J. Sep. Sci., 2019, 42, 3261–3275 CrossRef CAS PubMed.
- C. F. Li, X. C. Wang, J. H. Guo, Z. Y. Chu and L. J. Feng, J. Anal. At. Spectrom., 2016, 31, 1150–1159 RSC.
- C.-k. Na, T. Nakano, K. Tazawa, M. Sakagawa and T. Ito, Chem. Geol., 1995, 123, 225–237 CrossRef CAS.
- C. Pin, A. Gannoun and A. Dupont, J. Anal. At. Spectrom., 2014, 29, 1858–1870 RSC.
- J. J. Hui, H. M. Lee, G. E. Kim, W. M. Choi and T. Kim, Separations, 2021, 8, 213 CrossRef.
- J. Jweda, L. Bolge, C. Class and S. L. Goldstein, Geostand. Geoanal. Res., 2016, 40, 101–115 CrossRef CAS.
- C. Pin and A. Gannoun, Anal. Chem., 2017, 89, 2411–2417 CrossRef CAS PubMed.
- C. Pin and A. Gannoun, J. Anal. At. Spectrom., 2019, 34, 310–318 RSC.
- C. F. Li, Z. Y. Chu, J. H. Guo, Y. L. Li, Y. H. Yang and X. H. Li, Anal. Methods, 2015, 7, 4793–4802 RSC.
- K. Misawa, F. Yamazaki, N. Ihira and N. Nakamura, Geochem. J., 2000, 34, 11–21 CrossRef CAS.
- A. Retzmann, T. Zimmermann, D. Profrock, T. Prohaska and J. Irrgeher, Anal. Bioanal. Chem., 2017, 409, 5463–5480 CrossRef CAS PubMed.
- C. F. Li, X. H. Li, Q. L. Li, J. H. Guo, X. H. Li and T. Liu, Anal. Chim. Acta, 2011, 706, 297–304 CrossRef CAS PubMed.
- Y. Wang, X. Huang, Y. Sun, S. Zhao and Y. Yue, Anal. Methods, 2017, 9, 3531–3540 RSC.
- Z. Y. Chu, M. J. Wang, C. F. Li and Y. H. Yang, J. Anal. At. Spectrom., 2019, 34, 2053–2060 RSC.
- Q. Guan, Y. Sun, Y. Yue, X. Liu and S. Zhao, Anal. Sci., 2019, 35, 323–328 CrossRef CAS PubMed.
- D. Wang and R. W. Carlson, J. Anal. At. Spectrom., 2022, 37, 185–193 RSC.
- E. Yobregat, C. Fitoussi and B. Bourdon, J. Anal. At. Spectrom., 2017, 32, 1388–1399 RSC.
- C. Pin and A. Gannoun, J. Anal. At. Spectrom., 2019, 34, 2136–2146 RSC.
- J. M. Koornneef, C. Bouman, J. B. Schwieters and G. R. Davies, J. Anal. At. Spectrom., 2013, 28, 749–754 RSC.
- J. M. Koornneef, C. Bouman, J. B. Schwieters and G. R. Davies, Anal. Chim. Acta, 2014, 819, 49–55 CrossRef CAS PubMed.
- G. Wang, Y. Zeng, J. Xu and W. Liu, J. Mass Spectrom., 2018, 53, 455–464 CrossRef CAS PubMed.
- F. Scheiner, L. Ackerman, K. Holcová, J. Rejšek, H. Vollstaedt, J. Ďurišová and V. Santolík, Geochem., Geophys., Geosyst., 2022, 44, e2021GC010201 CrossRef.
- G. Wang, H. Vollstaedt, J. Xu and W. Liu, Geostand. Geoanal. Res., 2019, 43, 419–433 CrossRef CAS.
- J. M. Koornneef, I. Nikogosian, M. J. van Bergen, R. Smeets, C. Bouman and G. R. Davies, Chem. Geol., 2015, 397, 14–23 CrossRef CAS.
- C. F. Li, Z. Y. Chu, X. C. Wang, J. H. Guo and S. A. Wilde, Anal. Chem., 2019, 91, 7288–7294 CrossRef CAS PubMed.
- W. G. Liu, S. Wei, J. Zhang, C. Ao, F. T. Liu, B. Cai, H. Y. Zhou, J. L. Yang and C. F. Li, J. Anal. At. Spectrom., 2020, 35, 953–960 RSC.
- D. Weis, B. Kieffer, C. Maerschalk, J. Barling, J. de Jong, G. A. Williams, D. Hanano, W. Pretorius, N. Mattielli, J. S. Scoates, A. Goolaerts, R. M. Friedman and J. B. Mahoney, Geochem., Geophys., Geosyst., 2006, 7, Q08006 CrossRef.
- I. Raczek, K. P. Jochum and A. W. Hofmann, Geostand. Newsl., 2003, 27, 173–179 CrossRef CAS.
- B. Q. Zhu, Geochemical, 1978, 02, 148–156 Search PubMed.
- M. Boyet and R. W. Carlson, Science, 2005, 309, 576–581 CrossRef CAS PubMed.
- D. Upadhyay, E. E. Scherer and K. Mezger, J. Anal. At. Spectrom., 2008, 23, 561–568 RSC.
- J. O'Neil, H. Rizo, M. Boyet, R. W. Carlson and M. T. Rosing, Earth Planet. Sci. Lett., 2016, 442, 194–205 CrossRef.
- C. F. Li, X. C. Wang, Y. L. Li, Z. Y. Chu, J. H. Guo and X. H. Li, J. Anal. At. Spectrom., 2015, 30, 895–902 RSC.
- A. Ali and G. Srinivasan, Int. J. Mass Spectrom., 2011, 299, 27–34 CrossRef CAS.
- R. Andreasen and M. Sharma, Science, 2006, 314, 806–809 CrossRef CAS PubMed.
- R. W. Carlson, M. Boyet and M. Horan, Science, 2007, 316, 1175–1178 CrossRef CAS PubMed.
- Q. R. Shollenberger, L. E. Borg, E. C. Ramon, M. A. Sharp and G. A. Brennecka, Talanta, 2021, 221, 121431 CrossRef CAS PubMed.
- L. E. Nyquist, H. Wiesmann, B. Bansal, C.-Y. Shih, J. E. Keith and C. L. Harper, Geochim. Cosmochim. Acta, 1995, 59, 2817–2837 CrossRef CAS.
- M. Boyet and R. W. Carlson, Earth Planet. Sci. Lett., 2007, 262, 505–516 CrossRef CAS.
- I. Raczek, B. Stoll, A. W. Hofmann and K. P. Jochum, Geostand. Newsl., 2001, 25, 77–86 CrossRef CAS.
- C. Paton, M. Schiller and M. Bizzarro, Astrophys. J., 2013, 763, L40 CrossRef.
Footnote |
| † Electronic supplementary information (ESI) available. See DOI: https://doi.org/10.1039/d3ja00252g |
| This journal is © The Royal Society of Chemistry 2024 |

