 Open Access Article
Reference value of the JNdi-1 isotopic material without normalization†
Alexandre
Quemet
 *a,
Guillaume
Lasnier
a,
Sébastien
Mialle
b,
Hélène
Isnard
b,
Maud
Boyet
c,
Marion
Garçon
c and
Delphine
Auclair
c
aCEA, DES, ISEC, DRMC, Univ Montpellier, Marcoule, France. E-mail: alexandre.quemet@cea.fr
bUniversité Paris-Saclay, CEA, Service de Physico-Chimie, 91191, Gif-sur-Yvette, France
cUniversité Clermont Auvergne, CNRS, IRD, OPGC, Laboratoire Magmas et Volcans, F-63000 Clermont-Ferrand, France
First published on 3rd July 2024
Abstract
The most used international reference material for neodymium isotope ratios is the JNdi-1 standard. The literature reference values were determined using Thermal Ionization Mass Spectrometry (TIMS) with a conventional internal normalization. In nuclear studies, such normalization is not possible for samples after irradiation, as there is no known isotope ratio that can be considered as a reference ratio. Nd isotopic analysis is essential for calculating the burnup of a reactor. To offer reference values without normalization, 61 measurements of the JNdi-1 material were obtained in three different laboratories on four thermal ionization mass spectrometers using the total evaporation method. Acquired measurements were compared to the exponential mass fractionation law demonstrating that the dominant bias comes from isotope fractionation which can be minimized using the total evaporation method. The suggested reference values and associated uncertainties with a coverage factor of 2, which indicates approximate 95% confidence, were calculated using the DerSimonian–Laird procedure (n = 3): 142Nd/144Nd = 1.13966(23), 143Nd/144Nd = 0.511613(50), 145Nd/144Nd = 0.348729(33), 146Nd/144Nd = 0.72329(15), 148Nd/144Nd = 0.242505(95) and 150Nd/144Nd = 0.23780(14). All these ratios are significantly different from those obtained after normalization using 146Nd/144Nd = 0.7219. The new values obtained for the JNdi-1 can be used in nuclear laboratories where the Nd isotope ratios differ from the natural isotopic compositions or when the total evaporation method is used without internal normalization.
1. Introduction
Neodymium (Nd) isotopic analyses provide useful information in geochemistry and for samples from the nuclear fuel cycle or from irradiated experiments. The samarium (Sm)–Nd radiogenic system has been widely applied in geochronology since the 1970s.1,2 Nd isotopes are key geochemical tracers to understand the formation and evolution of planet Earth, as well as an important geochronometer.3,4 The 143Nd/144Nd ratio is one of the eminent palaeoceanographic tracers.5147Sm isotope decays to 143Nd isotope through α-decay with a half-life of 1.0625(38) × 1011 years.6146Sm isotope decays to 142Nd isotope through α-decay and a half-life estimated to 103 × 106 years.7,8 Nd is slightly more incompatible than Sm, so the Sm/Nd ratio changes during melting and crystallization processes, which, over time, will change the relative abundance of the 143Nd and 142Nd isotopes (for 142Nd, Sm/Nd fractionation must occur during the, now extinct, 146Sm lifetime). In nuclear studies, Nd isotope ratios provide a measurement of the energy released by nuclear fuel in an operating reactor, one of the most important parameters of samples taken by post-irradiation examination.9,10148Nd is one of the ideal burnup monitor nuclides.11 The 148Nd isotopes, produced by fission, is a stable isotope (no decay correction required), not volatile, not present as impurity in the initial fuel and the neutron capture reaction is negligible for power reactor fuels (148Nd isotope does not fission).Thermal Ionization Mass Spectrometry (TIMS) is the technique of choice for lanthanides isotopic analysis with high accuracy (i.e. measurement trueness and precision).1,3,12–19 Isotope fractionation, isobaric interferences and peak tailing are the main sources of bias. Isotope fractionation comes from the preferential evaporation of the lighter isotopes compared to the heavy isotopes, producing a bias on measurements. Mathematical tools such as external or internal normalization can be used to correct this phenomenon. Using internal normalization provides high precision ratios with external reproducibilities below 10 ppm (2 standard deviation (2 SD)) for most Nd isotope ratios.12 Its use requires an element that has at least three isotopes and the knowledge of one isotope ratio that is used to monitor and correct instrumental isotope fractionation. Such normalization is not possible for samples after irradiation, as there is no known isotope ratio that can be considered as a reference ratio. External normalization is often used in combination with the standard bracketing method where the sample measurements are bracketed by reference material.20 The precision provided by this method is degraded compared to the internal normalization because the sample and the reference material are not analyzed under exactly the same condition: same amount deposited on the filament, same deposit, same filament thickness, same acidity and matrices, etc.
The total evaporation method (hereafter referred to as the TE method) was developed to minimize the isotope fractionation by evaporating, ionizing and collecting the deposited sample until it is fully consumed.21–23 The TE method is regularly employed for the certification of Certified Reference Materials (CRM).24–30 Reproducibilities below 0.1% and expanded uncertainties about 0.1% (k = 2) were reported on the most abundant isotope ratios using TE method on various elements13,14,24–26,31 and particularly for Nd.13,15,16 On the other hand, no peak tailing correction can be performed during the measurement which makes it difficult to apply this technique for minor isotope ratio measurements. For uranium, a Modified TE (MTE) was developed to overcome this problem by interrupting the TE process on a regular basis to perform different corrections such as peak tailing, internal calibration of Secondary Electron Multiplier detector, peak-centering or ion beam focusing.32 It improves the measurement of the 234U/238U and 236U/238U minor isotope ratios without compromising the measurement quality of the 235U/238U major isotope ratio.28 For Nd analyses, all isotope ratios are between 0.2 and 1.2, hence the peak tailing effect can be ignored without compromising accuracy. Another drawback of the TE method is that it uses static collection for which collector efficiencies and amplifier gains cannot be as accurately corrected as for dynamic collection.12 However the last generation of TIMS use the amplifier rotation technique allowing cancellation of gain factor uncertainties.
In the case of Nd isotope ratio analysis, the most used international CRM is the JNdi-1.33 This material is a powder of natural Nd oxide initially certified for the 143Nd/144Nd ratio (0.512115(7), 2σ) using 12 mass spectrometers in 11 laboratories in Japan. Since this certification, other publications measured the other Nd isotope ratios.12,15–17 All these measurements were normalized, by convention, to the 146Nd/144Nd ratio with a value of 0.7219.
This conventional value of normalization comes from O'Nions et al.15,34,35 and corresponds to the mean value of a series of Nd analyses performed on natural Nd in their laboratory at that time. Values of 0.7234(15),15 0.72340(36)16 and 0.72339(63)13 for the JNdi-1 CRM and of 0.72333(8)21 for a natural neodymium were reported for the 146Nd/144Nd ratio using the TE method in the literature. These measurements differ by 0.2% from the conventional normalization value and this difference may have an impact for nuclear applications. For geochemical studies, the absolute value of the 146Nd/144Nd ratio used to correct for instrumental isotope fractionation using the exponential law is however not that important because isotope ratios (R) are mostly expressed relative to a reference value: ε = (Rmeasured/Rreference − 1) × 10![[thin space (1/6-em)]](https://www.rsc.org/images/entities/char_2009.gif) 000. Hence, a modification of the normalization value will have no impact on the ε value. In contrast, comparing values obtaining with the TE method without normalization and certified values corrected with the conventional normalization ratio leads to bias up to 0.6%.13 This bias is larger than the uncertainty required for neutronic calculation, but can be explained by the different methods (TE and internal normalization) used to correct instrumental isotope fractionation.13
000. Hence, a modification of the normalization value will have no impact on the ε value. In contrast, comparing values obtaining with the TE method without normalization and certified values corrected with the conventional normalization ratio leads to bias up to 0.6%.13 This bias is larger than the uncertainty required for neutronic calculation, but can be explained by the different methods (TE and internal normalization) used to correct instrumental isotope fractionation.13
To provide reference values without normalization for all Nd isotope ratios, independent measurements on the JNdi-1 material using the TE method without normalization were performed in three different laboratories: The Magmas and Volcanoes Laboratory (LMV) of the Clermont-Auvergne University, the Laboratory of Nuclear, Isotopic and Elemental Analytical development (LANIE) and the Atalante Analysis Laboratory (LAAT) of the French Alternative Energies and Atomic Energy Commission (CEA). After evaluating and compiling the results, we here report the final average values and their associated uncertainties for all the Nd isotope ratios of the JNdi-1 material.
2. Experimental methods
2.1. Isotope ratio measurements
Four ThermoFischer Scientific Triton TIMS in three different laboratories were used in the evaluation. The iNd/144Nd (i = 142, 143, 145, 146, 148 and 150) isotope ratios were measured by the TE method without internal normalization. JNdi-1 was measured on 3 different aliquots obtained from the Geological Survey of Japan:33 each laboratory measured its own JNdi-1 vial, independently of the other laboratories. Each laboratory has done the measurements following their own routine procedure (loading amount, activator used, beam intensity, etc.). The amount of Nd loaded on the filaments was between 10 and 100 ng. The procedures and instrument parameters are summarized in the ESI.† A TE measurement consists of three steps: adjustment, acquisition and shutdown.15 The ion beam is collected only during the acquisition step. The signal, which can be highly fractionated, is not collected during the adjustment and shutdown phases. This loss is very small compared to the signal collected during the acquisition step and has a negligible effect on the results. The ionization efficiency during the acquisition step is assumed to be constant during a single TE measurement: (1) the ionization occurs on a hot filament of constant temperature and (2) only the ionization filament is responsible for the ionization because the Nd evaporation occurs before the evaporation filament current reaches 3500 mA, which is too low to ionize Nd with it.The cumulative electric charge (Q in Coulomb) collected on all Nd isotopes was calculated for each measurement using eqn (1).16
| Q = ΣU × t/RΩ | (1) |
The ionization efficiency was calculated for each measurement using eqn (2).
 | (2) |
![[thin space (1/6-em)]](https://www.rsc.org/images/entities/char_2009.gif) 485 C mol−1) and m is the mass of Nd loaded on the filaments.
485 C mol−1) and m is the mass of Nd loaded on the filaments.
2.2. Exponential mass fractionation law (EMFL)
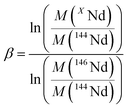
To investigate the quality of Nd isotope ratio measurements, the results were reported in a three-isotope plot and compared to the EMFL. Data fitted to the EMFL indicate whether the variability between different measurements can be explained by instrumental isotope fractionation only or if it is generated by other sources (such as peak tailing effect or variable cup efficiency) that could cause ratios to deviate from the EMFL.36,37 The EMFL curve in which one XNd isotope (X = 142, 143, 145, 148 or 150) is plotted against the others (144Nd and 146Nd) is given by eqn (3).36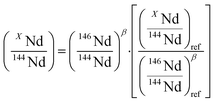 | (3) |
 | (4) |
| 142Nd/144Nd | 143Nd/144Nd | 145Nd/144Nd | 146Nd/144Nd | 148Nd/144Nd | 150Nd/144Nd | |
|---|---|---|---|---|---|---|
| Arithmetic mean (this study) | 1.13960(52) | 0.51160(12) | 0.348741(82) | 0.72331(32) | 0.24252(22) | 0.23783(32) |
| Bias (%) | −0.20 | −0.10 | 0.10 | 0.20 | 0.39 | 0.58 |
| NE | 8.6 | 8.4 | 8.3 | 8.8 | 8.8 | 8.7 |
| Residual mean | 0.0027% | 0.0017% | −0.0009% | — | 0.0002% | 0.0018% |
| Reference value12 | 1.141832(6) | 0.512099(5) | 0.348403(3) | 0.7219 | 0.241581(3) | 0.236452(6) |
2.3. Evaluation of the final average value and its uncertainty
The final average value and its uncertainty was estimated using the DerSimonian–Laird procedure.39,40 The final average value (![[x with combining macron]](https://www.rsc.org/images/entities/i_char_0078_0304.gif) ) is a weighted average of the results measured (x) by the laboratories (eqn (5)).
) is a weighted average of the results measured (x) by the laboratories (eqn (5)). | (5) |
 | (6) |
σ is the standard uncertainty (k = 1) of the results measured by a laboratory and τ is the dark uncertainty. For k = 1, there is a confidence level that 68% of the data are within one standard deviation. The dark uncertainty is estimated by a method-of-moments. It acts as a moderating parameter to prevent values associated with very small uncertainties overly influencing the final average value. The dark uncertainty is the maximum value between 0 and τ (eqn (7)).
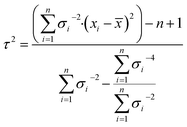 | (7) |
The standard uncertainty (u(![[x with combining macron]](https://www.rsc.org/images/entities/i_char_0078_0304.gif) ), k = 1) of the final average value estimated by the DerSimonian–Laird procedure is given in eqn (8).
), k = 1) of the final average value estimated by the DerSimonian–Laird procedure is given in eqn (8).
 | (8) |
Bias, or trueness, was calculated using eqn (9).
 | (9) |
Eqn (10) was used to determine whether the final average value has a statistically significant bias compare to reference values. If the normalized error (NE) is lower than 2, the final average value is considered to have no statistically significant bias.41 If NE is between 2 and 3, the accuracy of the final average value is questionable. If NE is higher than 3, the final average value is considered having a statistically significant bias.
 | (10) |
![[x with combining macron]](https://www.rsc.org/images/entities/i_char_0078_0304.gif) ) being the standard uncertainty of the final average value and u(ref) the reference value standard uncertainty with a coverage factor k = 1.
) being the standard uncertainty of the final average value and u(ref) the reference value standard uncertainty with a coverage factor k = 1.
3. Results and discussion
A total of 61 measurements were performed by the three laboratories. The results from each laboratory are presented in the Table S2 in the ESI.† The arithmetic mean values for the Nd isotope ratios obtained in each laboratory are shown in Table 2.| 142Nd/144Nd | 143Nd/144Nd | 145Nd/144Nd | 146Nd/144Nd | 148Nd/144Nd | 150Nd/144Nd | |
|---|---|---|---|---|---|---|
| LMV laboratory (n = 15) | ||||||
| Value | 1.13972(29) | 0.511626(63) | 0.348715(42) | 0.72325(19) | 0.24248(13) | 0.23777(19) |
| RSD (ppm) | 127 | 61 | 60 | 131 | 259 | 387 |
| w | 0.60 | 0.64 | 0.60 | 0.55 | 0.56 | 0.57 |
![[thin space (1/6-em)]](https://www.rsc.org/images/entities/char_2009.gif) |
||||||
| LANIE laboratory (n = 18) | ||||||
| Value | 1.13972(56) | 0.51163(15) | 0.348725(83) | 0.72322(33) | 0.24246(23) | 0.23774(34) |
| RSD (ppm) | 244 | 139 | 118 | 225 | 466 | 699 |
| w | 0.16 | 0.12 | 0.16 | 0.19 | 0.17 | 0.17 |
![[thin space (1/6-em)]](https://www.rsc.org/images/entities/char_2009.gif) |
||||||
| LAAT laboratory (n = 28) | ||||||
| Value | 1.13946(47) | 0.51157(11) | 0.348769(66) | 0.72341(28) | 0.24258(19) | 0.23792(28) |
| RSD (ppm) | 204 | 99 | 95 | 191 | 377 | 578 |
| w | 0.23 | 0.24 | 0.24 | 0.26 | 0.26 | 0.26 |
![[thin space (1/6-em)]](https://www.rsc.org/images/entities/char_2009.gif) |
||||||
| Final average values | ||||||
| Value | 1.13966(23) | 0.511613(50) | 0.348729(33) | 0.72329(15) | 0.242505(95) | 0.23780(14) |
| U rel (ppm, k = 2) | 197 | 97 | 93 | 194 | 388 | 584 |
3.1. Data evaluation
The data acquired in this study using the TE method show a systematic bias compared to the reference values corrected with an internal normalization using the conventional 146Nd/144Nd ratio of 0.7219: biases between −0.2% and 0.58% and normalized errors greater than 2 were calculated (Table 1). Differences between measured ratios and reference values are proportional, within error, to the mass differences. All individual values were reported in a three-isotope plot and compared to the EMFL (Fig. 1 for the 143Nd/144Nd and Fig. S1 and S2 in the ESI† for the other isotope ratios). As seen in Fig. 1a, the 143Nd/144Nd isotope ratio fits the EMFL, regardless of the laboratory. The vertical deviations or residuals of the 143Nd/144Nd ratio from the EMFL as function of the 146Nd/144Nd ratio are shown in Fig. 1b. The residuals are between −0.008% and 0.006% and seem to be homogenous over the 146Nd/144Nd measured ratio range. No correlation is observed between the residuals of the 143Nd/144Nd ratio and the 146Nd/144Nd measured ratio.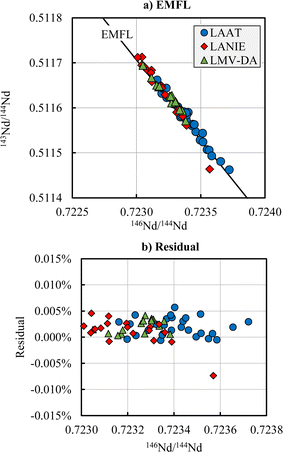 | ||
| Fig. 1 143Nd/144Nd ratios plotted against the 146Nd/144Nd ratios (a) and vertical deviation (residual) of the 143Nd/144Nd ratio from the EMFL curve as function of the 146Nd/144Nd ratio (b) for the LAAT (blue circle), LANIE (red diamond) and LMV (green triangle) laboratories. The solid line represents the Exponential Mass Fractionation Law calculated with the reference values given by Garçon et al.12 | ||
The Nuclear Field Shift Effect (NFSE) is a mass-independent isotopic fractionation and results from the isotopes not sharing exactly the same shape and size of atomic nucleus [38–40]. The theoretical effect of the NFSE can be modeled.12 Theory predicts a small positive shift for the 142Nd, 143Nd and 145Nd isotopes, and a large negative shift for the 148Nd and 150Nd isotopes. The means of the residuals are between −0.0009% and 0.0027% (Table 1). The mean of the residuals found for 143Nd/144Nd (0.0017%) is positive while the mean of the residuals found for the 145Nd/144Nd is negative (−0.0009%). The means of the residuals for 148Nd/144Nd and 150Nd/144Nd are also positives. This result seems to indicate that the data are not affected by NFSE.
The observed bias compared to the reference values can be explained by the way to take into account the isotope fractionation (internal normalization for the reference value and TE method for this study) and not from a bias coming from interferences or any other drifts. The conventional value used for internal normalization (146Nd/144Nd = 0.7219) is quite different from that measured with the TE method: 0.7233 in this study and 0.7234 in the literature.15,16 Using a large number of data helps to derive the best estimate of true ratios, even if the distribution of data observed along the EMFL raises questions and suggest that certain biases are not understood. It should be noted that the TE method is regularly used in nuclear studies and during CRM certification to obtain reference values of isotope ratios that can be considered as true ratios.24–30
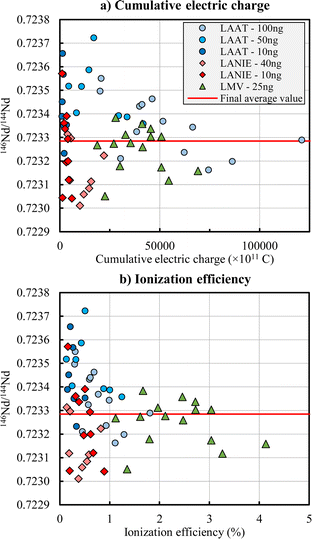
Precision obtained for each laboratory are below 250 ppm for 142Nd/144Nd, 143Nd/144Nd, 145Nd/144Nd and 146Nd/144Nd ratios, and between 250 and 700 ppm for 148Nd/144Nd and 150Nd/144Nd ratios (Table 2). The Fig. 2 shows the 146Nd/144Nd isotope ratio as a function of the cumulative electric charge (Fig. 2a) and as a function of the ionization efficiency (Fig. 2b). The other isotope ratios are presented in Fig. S3 and S4 in the ESI.† Higher the cumulative electric charge and the ionization efficiency are, better the precision is (i.e. lower are relative standard deviation (RSD)). Below a cumulative electric charge of 25![[thin space (1/6-em)]](https://www.rsc.org/images/entities/char_2009.gif) 000 × 10−11 C, the precision is degraded (i.e. the RSD increased) significantly. The ionization efficiency obtained by the LMV laboratory is between 1 and 5% and is lower than 2% for the LANIE and LAAT laboratories. The precision obtained by the LANIE (RSD = 225 ppm for the 146Nd/144Nd ratio for example) and LAAT (RSD = 191 ppm) laboratories is slightly lower than the LMV laboratory (RSD = 131 ppm) due to a smaller cumulative electric charge. The better precision of the LMV measurements can also be partly explained by the loading procedure and the use of H3PO4 as a fixing agent to minimize the sample spot on the filaments. The LMV laboratory used a free drying procedure (i.e. without circulating an electric current in the filament contrary to the LANIE and LAAT laboratories) helping to reduce the formation of oxide during the measurement and to increase the ionization efficiency. The expanded uncertainties (k = 2), estimated as twice the standard deviation, obtained by the LMV are therefore slightly smallest than the LANIE and LAAT ones.
000 × 10−11 C, the precision is degraded (i.e. the RSD increased) significantly. The ionization efficiency obtained by the LMV laboratory is between 1 and 5% and is lower than 2% for the LANIE and LAAT laboratories. The precision obtained by the LANIE (RSD = 225 ppm for the 146Nd/144Nd ratio for example) and LAAT (RSD = 191 ppm) laboratories is slightly lower than the LMV laboratory (RSD = 131 ppm) due to a smaller cumulative electric charge. The better precision of the LMV measurements can also be partly explained by the loading procedure and the use of H3PO4 as a fixing agent to minimize the sample spot on the filaments. The LMV laboratory used a free drying procedure (i.e. without circulating an electric current in the filament contrary to the LANIE and LAAT laboratories) helping to reduce the formation of oxide during the measurement and to increase the ionization efficiency. The expanded uncertainties (k = 2), estimated as twice the standard deviation, obtained by the LMV are therefore slightly smallest than the LANIE and LAAT ones.
3.2. Final average values
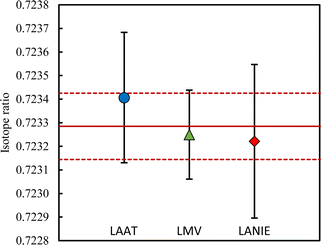
Various approaches exist to reach a final average value and its uncertainty.42 The arithmetic approach estimates the final average value using the arithmetic mean where all results have an equivalent weight. This simple approach is however sensitive to outliers and is not adopted if results are dispersed. In this case, the final average value uncertainty is underestimated. The weighed approach is less sensitive to outliers by giving more weight to the most accurate results. This method is not adopted if the lowest uncertainty is an outlier and if the measurement uncertainties are questionable. In this case, the weighed mean value can be biased and the final average value uncertainty is underestimated. The DerSimonian–Laird procedure is generally recommended for inter-laboratory data comparison.39,40,43 This procedure is the simplest method for taking into account random effects.44 A statistical parameter, called dark uncertainty or excess variance, is calculated for representing inter-laboratory variation. If the dark uncertainty is higher than 0, the results are weighted and corrected to reflect inter-laboratory variance. The DerSimonian–Laird procedure reduces the weight of measurements with very small uncertainties on the final average value. This procedure assigns a greater variability to laboratory results to take into account the inter-laboratory heterogeneity. A better assessment of the final average value uncertainty is obtained. It should be noted that if the dark uncertainty is below 0, the DerSimonian–Laird procedure is identical to the weighed approach.The first step to calculate the final average value using the DerSimonian–Laird procedure is to determine the dark uncertainty. For all isotope ratios, the dark uncertainty is equal to zero, indicating that the measurement results of the three laboratories are mutually consistent. It means the average values associated with its uncertainty for each laboratory overlap (Fig. 3). The other isotope ratios are reported in Fig. S5 in the ESI.†
The final average value and its uncertainty are shown in Table 2. The final average values for the JNdi-1 CRM are (Table 2): 142Nd/144Nd = 1.13966(23), 143Nd/144Nd = 0.511613(50), 145Nd/144Nd = 0.348729(33), 146Nd/144Nd = 0.72329(15), 148Nd/144Nd = 0.242505(95) and 150Nd/144Nd = 0.23780(14). The relative expanded uncertainties (Urel, k = 2) are about 100 ppm for 143Nd/144Nd and 145Nd/144Nd ratios, about 200 ppm for 142Nd/144Nd and 146Nd/144Nd ratios, about 400 ppm for 148Nd/144Nd ratio and about 600 ppm for 150Nd/144Nd ratio. The LMV laboratory, having the smallest uncertainty, is the major contributor to the final average values: about 60% regardless of the isotope ratios. The two other laboratories contribute around 40% of the final average values and its associated uncertainties.
3.3. Comparison with the literature
The final average values were compared to the values obtained previously on the JNdi-1 CRM by Wakaki et al.15,16 using the TE method without normalization (i.e. same method as used here) and for a deposit quantity of 5 ng. Bias of −0.0041% (142Nd/144Nd), −0.014% (143Nd/144Nd), −0.015% (145Nd/144Nd) and 0.024% (146Nd/144Nd) were measured. Normalized errors (eqn (10)) of 0.2, 0.8, 0.7 and 0.9 were obtained for the 142Nd/144Nd, 143Nd/144Nd, 145Nd/144Nd and 146Nd/144Nd ratios, respectively. These values are not statistically different. 148Nd/144Nd and 150Nd/144Nd isotope ratios were not published by Wakaki et al.15The uncertainties obtained in this study are improved by a factor of 2 to 6 compared to previous work reporting TE measurements.15 This can be explained by: (1) the higher amount of Nd loaded on the filaments in this study compared to others; (2) the uncertainties of the final average value are mainly due to the data from the LMV laboratory, which has the better precision. For comparison, the highest amount of Nd deposited on the filaments in the study of Wakaki et al.15 was 5 ng resulting in a cumulative electric charge between 271 and 4027 × 1011 C. In this study, the amount of Nd loaded on the filaments was between 10 and 100 ng resulting in a cumulative electric charge between 1047 and 121![[thin space (1/6-em)]](https://www.rsc.org/images/entities/char_2009.gif) 209 × 1011 C (Fig. 2). As a consequence, Wakaki et al.15 obtained a RSD of 163 ppm on the 143Nd/144Nd ratio, while the RSD is of 61 ppm for the LMV laboratory (Table 2).
209 × 1011 C (Fig. 2). As a consequence, Wakaki et al.15 obtained a RSD of 163 ppm on the 143Nd/144Nd ratio, while the RSD is of 61 ppm for the LMV laboratory (Table 2).
4. Conclusion
Nd isotope ratios of the JNdi-1 international standard were measured using the TE method on 4 different TIMS instruments in three different laboratories to obtain reference isotope ratios without using internal normalization. Data, acquired independently, were compared to the EMFL demonstrating that the dominant bias compared to the reference values comes from the way isotope fractionation is taken into account: internal normalization for the reference values and TE method for this study. Statistical studies show that data acquired by the three laboratories are mutually consistent. The final average values and their associated uncertainties were estimated using the DerSimonian–Laird procedure. An improvement of the uncertainties by a factor 2 to 6 is observed compared to previous works using TE measurements.13,15 The TE measurement approach can provide accurate results for future applications when internal normalization is not possible.Author contributions
Alexandre Quemet: conceptualization, investigation, writing – original draft. Guillaume Lasnier: resources. Sébastien Mialle: resources, investigation and writing – review & editing. Hélène Isnard: writing – review & editing. Maud Boyet: writing – review & editing. Marion Garçon: writing – review & editing. Delphine Auclair: resources, investigation and writing – review & editing.Conflicts of interest
There are no conflicts to declare.Acknowledgements
We are grateful to Vincent Dalier (CEA/MAR/DES/DMRC/SASP/LAAT) for its help with TIMS measurements.References
- Z.-Y. Chu, M.-J. Wang, C.-F. Li, Y.-H. Yang, J.-J. Xu and W. Wang, et al., Separation of Nd from geological samples by a single TODGA resin column for high precision Nd isotope analysis as NdO + by TIMS, J. Anal. At. Spectrom., 2019, 34(10), 2053–2060, 10.1039/c9ja00200f.
- M. T. McCulloch and G. J. Wasserburg, Sm-Nd and Rb-Sr Chronology of Continental Crust Formation, Science, 1978, 200(4345), 1003–1011, DOI:10.1126/science.200.4345.1003.
- A. J. McCoy-West, M.-A. Millet, G. M. Nowell, O. Nebel and K. W. Burton, Simultaneous measurement of neodymium stable and radiogenic isotopes from a single aliquot using a double spike, J. Anal. At. Spectrom., 2020, 35(2), 388–402 RSC . Available from: https://xlink.rsc.org/?DOI=C9JA00308H.
- P. Frossard, C. Israel, A. Bouvier and M. Boyet, Earth's composition was modified by collisional erosion, Science, 2022, 377(6614), 1529–1532, DOI:10.1126/science.abq7351.
- F. Scheiner, L. Ackerman, K. Holcová, J. Rejšek, H. Vollstaedt and J. Ďurišová, et al., New Perspectives on the 143 Nd/144 Nd Palaeoceanographic Tracer on Foraminifera: The State-of-the-Art Frontiers of Analytical Methods, Geochem., Geophys., Geosyst., 2022, 23(3), 1–19, DOI:10.1029/2021gc010201.
- I. M. Villa, N. E. Holden, A. Possolo, R. B. Ickert, D. B. Hibbert and P. R. Renne, IUPAC-IUGS recommendation on the half-lives of 147Sm and 146Sm, Geochim. Cosmochim. Acta, 2020, 285, 70–77, DOI:10.1016/j.gca.2020.06.022.
- L. Fang, P. Frossard, M. Boyet, A. Bouvier, J.-A. Barrat, M. Chaussidon and F. Moynier, Half-life and initial Solar System abundance of 146Sm determined from the oldest andesitic meteorite, Proc. Natl. Acad. Sci. U. S. A., 2022, 119(12) DOI:10.1073/pnas.2120933119.
- F. Meissner, W.-D. Schmidt-Ott and L. Ziegeler, Half-life and α-ray energy of 146Sm, Z. Phys. A: At. Nucl., 1987, 327(2), 171–174, DOI:10.1007/BF01292406.
- K. Suyama and H. Mochizuki, Corrections to the 148Nd method of evaluation of burnup for the PIE samples from Mihama-3 and Genkai-1 reactors, Ann. Nucl. Energy, 2006, 33(4), 335–342 CrossRef CAS . Available from: https://linkinghub.elsevier.com/retrieve/pii/S0306454905002732.
- K. Govers, L. Adriaensen, A. Dobney, M. Gysemans, C. Cachoir and M. Verwerft, Evaluation of the irradiation-averaged fission yield for burnup determination in spent fuel assays, EPJ Nucl. Sci. Technol., 2022, 8(18), 1–15, DOI:10.1051/epjn/2022018.
- ASTM International, ASTM E321-20 – Standard Test Method for Atom Percent Fission in Uranium and Plutonium Fuel (Neodymium-148 Method), West Conshohocken, PA, USA, 2021 Search PubMed.
- M. Garçon, M. Boyet, R. W. Carlson, M. F. Horan, D. Auclair and T. D. Mock, Factors influencing the precision and accuracy of Nd isotope measurements by thermal ionization mass spectrometry, Chem. Geol., 2018, 476, 493–514 CrossRef . Available from: https://linkinghub.elsevier.com/retrieve/pii/S0009254117306769.
- A. Quemet, M. Angenieux and A. Ruas, Nd, Am and Cm isotopic measurements after simultaneous separation in transmutation irradiated samples, J. Anal. At. Spectrom., 2021, 36(8), 1758–1767 RSC . Available from: http://xlink.rsc.org/?DOI=D1JA00165E.
- A. Quemet, E. Buravand, J.-G. Peres, V. Dalier and S. Bejaoui, Irradiated UAmO2 transmutation discs analyses: from dissolution to isotopic analyses, J. Radioanal. Nucl. Chem., 2022, 331(2), 1051–1061, DOI:10.1007/s10967-021-08156-2.
- S. Wakaki, S.-N. Shibata and T. Tanaka, Isotope ratio measurements of trace Nd by the total evaporation normalization (TEN) method in thermal ionization mass spectrometry, Int. J. Mass Spectrom., 2007, 264(2), 157–163, DOI:10.1016/j.ijms.2007.04.006.
- S. Wakaki and T. Ishikawa, Isotope analysis of nanogram to sub-nanogram sized Nd samples by total evaporation normalization thermal ionization mass spectrometry, Int. J. Mass Spectrom., 2018, 424, 40–48, DOI:10.1016/j.ijms.2017.11.014.
- C. Pin and A. Gannoun, Miniaturized, rapid separation of neodymium from ultramafic and chondritic samples prior to high precision measurements of 142,143Nd/144Nd isotope ratios by TIMS, J. Anal. At. Spectrom., 2019, 34(10), 2136–2146, 10.1039/c9ja00272c.
- ISO 5725-1, Accuracy (Trueness and Precision) of Measurement Methods and Results—Part 1: General Principles and Definitions, 2023 Search PubMed.
- BIPM, International Vocalulary of Metrology – Basic and General Concepts and Associated Terms (VIM), 3rd edn, 2008, vol. 3, http://www.bipm.org/utils/common/documents/jcgm/JCGM_200_2008.pdf Search PubMed.
- S. Bürger, S. D. Balsley, S. Baumann, J. Berger, S. F. Boulyga and J. A. Cunningham, et al., Uranium and plutonium analysis of nuclear material samples by multi-collector thermal ionisation mass spectrometry: Quality control, measurement uncertainty, and metrological traceability, Int. J. Mass Spectrom., 2012, 311, 40–50 CrossRef . Available from: https://linkinghub.elsevier.com/retrieve/pii/S1387380611004702.
- J. C. Dubois, G. Retali and J. Cesario, Isotopic analysis of rare earth elements by total vaporization of samples in thermal ionization mass spectrometry, Int. J. Mass Spectrom. Ion Processes, 1992, 120(3), 163–177, DOI:10.1016/0168-1176(92)85046-3.
- E. L. Callis and R. M. Abernathey, High-precision isotopic analyses of uranium and plutonium by total sample volatilization and signal integration, Int. J. Mass Spectrom. Ion Processes, 1991, 103(2), 93–105, DOI:10.1016/0168-1176(91)80081-W.
- M. Romkowski, S. Franzini and L. Koch, Mass-Spectrometric analysis of sub-nanocurie samples of Uranium and Plutonium, in Proc of 8th Annu ESARDA Symp, Commission of European Communities, London. 1987 Search PubMed.
- A. Quemet, C. Maillard and A. Ruas, Determination of zirconium isotope composition and concentration for nuclear sample analysis using Thermal Ionization Mass Spectrometry, Int. J. Mass Spectrom., 2015, 392, 34–40, DOI:10.1016/j.ijms.2015.08.023.
- A. Quemet, A. Ruas, V. Dalier and C. Rivier, Development and comparison of high accuracy thermal ionization methods for uranium isotope ratios determination in nuclear fuel, Int. J. Mass Spectrom., 2019, 438, 166–174, DOI:10.1016/j.ijms.2019.01.008.
- A. Quemet, A. Ruas, V. Dalier and C. Rivier, Americium isotope analysis by Thermal Ionization Mass Spectrometry using the Total Evaporation Method, Int. J. Mass Spectrom., 2018, 431, 8–14, DOI:10.1016/j.ijms.2018.05.017.
- R. Jakopič, A. Fankhauser, Y. Aregbe, S. Richter, M. Crozet and C. Maillard, et al., 243Am certified reference material for mass spectrometry, J. Radioanal. Nucl. Chem., 2021, 327(1), 495–504, DOI:10.1007/s10967-020-07521-x.
- K. J. Mathew and A. Hasozbek, Comparison of mass spectrometric methods (TE, MTE and conventional) for uranium isotope ratio measurements, J. Radioanal. Nucl. Chem., 2016, 307(3), 1681–1687, DOI:10.1007/s10967-015-4484-8.
- K. J. Mathew, G. O’Connor, A. Hasozbek and M. Kraiem, Total evaporation method for uranium isotope-amount ratio measurements, J. Anal. At. Spectrom., 2013, 28(6), 866–876, 10.1039/C2JA30321C.
- M. Kraiem, S. Richter, H. Kühn and Y. Aregbe, Development of an improved method to perform single particle analysis by TIMS for nuclear safeguards, Anal. Chim. Acta, 2011, 688(1), 1–7, DOI:10.1016/j.aca.2010.12.003.
- A. Quemet, E. Buravand, B. Catanese, P. Huot, V. Dalier and A. Ruas, Monitoring the dissolution of a uranium-plutonium oxide from a spent fuel solution: using plutonium ratio and TIMS for isotope ratio measurements, J. Radioanal. Nucl. Chem., 2020, 326(255–260), 255–260, DOI:10.1007/s10967-020-07311-5.
- S. Richter, H. Kühn, Y. Aregbe, M. Hedberg, J. Horta-Domenech and K. Mayer, et al., Improvements in routine uranium isotope ratio measurements using the modified total evaporation method for multi-collector thermal ionization mass spectrometry, J. Anal. At. Spectrom., 2011, 26(3), 550–564, 10.1039/C0JA00173B.
- T. Tanaka, S. Togashi, H. Kamioka, H. Amakawa, H. Kagami and T. Hamamoto, et al., JNdi-1: A neodymium isotopic reference in consistency with LaJolla neodymium, Chem. Geol., 2000, 168, 279–281, DOI:10.1016/S0009-2541(00)00198-4.
- R. K. O’Nions, P. J. Hamilton and N. M. Evensen, Variations in 143Nd/144Nd and 87Sr/86Sr ratios in oceanic basalts, Earth Planet. Sci. Lett., 1977, 34(1), 13–22, DOI:10.1016/0012-821X(77)90100-5.
- R. K. O’Nions, S. R. Carter, N. M. Evensen and P. J. Hamilton, Geochemical and cosmochemical applications of Nd isotope analysis, Annu. Rev. Earth Planet. Sci., 1979, 7, 11–38, DOI:10.1146/annurev.ea.07.050179.000303.
- E. D. Young, A. Galy and H. Nagahara, Kinetic and equilibrium mass-dependant isotope fractionation laws in nature and their geochemical and cosmochemical significance, Geochim. Cosmochim. Acta, 2002, 66(6), 1095–1104, DOI:10.1016/S0016-7037(01)00832-8.
- A. Gourgiotis, T. Ducasse, E. Barker, P. Jollivet, S. Gin and S. Bassot, et al., Silicon isotope ratio measurements by inductively coupled plasma tandem mass spectrometry for alteration studies of nuclear waste glasses, Anal. Chim. Acta, 2017, 954, 68–76, DOI:10.1016/j.aca.2016.11.063.
- J. Meija, T. B. Coplen, M. Berglund, W. A. Brand, P. De Bièvre and M. Gröning, et al., Atomic weights of the elements 2013 (IUPAC Technical Report), Pure Appl. Chem., 2016, 88(3), 265–291, DOI:10.1515/pac-2015-0305.
- R. DerSimonian and N. Laird, Meta-analysis in clinical trials, Controlled Clin. Trials, 1986, 7(3), 177–188 CrossRef CAS PubMed . Available from: https://linkinghub.elsevier.com/retrieve/pii/0197245686900462.
- A. Whitehead and J. Whitehead, A general parametric approach to the meta-analysis of randomized clinical trials, Stat. Med., 1991, 10(11), 1665–1677, DOI:10.1002/sim.4780101105.
- M. Désenfant, M. Priel and C. Rivier, Evaluation des incertitudes des résultats d’analyse, Ref P105 V1, Les Techniques de l’Ingénieur, 2005, pp. 1–17.
- H. Huang, Combining estimators in interlaboratory studies and meta-analyses, Res. Synth. Methods, 2023, 14(3), 526–543, DOI:10.1002/jrsm.1633.
- R. DerSimonian and R. Kacker, Random-effects model for meta-analysis of clinical trials: An update, Contemp. Clin. Trials, 2007, 28(2), 105–114, DOI:10.1016/j.cct.2006.04.004.
- D. Jackson, J. Bowden and R. Baker, How does the DerSimonian and Laird procedure for random effects meta-analysis compare with its more efficient but harder to compute counterparts?, J. Stat. Plann. Inference, 2010, 140(4), 961–970, DOI:10.1016/j.jspi.2009.09.017.
Footnote |
| † Electronic supplementary information (ESI) available. See DOI: https://doi.org/10.1039/d4ja00140k. |
| This journal is © The Royal Society of Chemistry 2024 |

