 Open Access Article
Acoustic enrichment of sperm for in vitro fertilization†
Chunqiu
Zhang‡
 ac,
Ning
Rong‡
a,
Ziyi
Lin‡
bc,
Peng-Qi
Li
a,
Jingyao
Shi
a,
Wei
Zhou
a,
Lili
Niu
a,
Fei
Li
a,
Rongxin
Tang
*e,
Lei
Li
*b and
Long
Meng
 *ad
*ad
aKey Laboratory of Biomedical Imaging Science and System, Shenzhen Institutes of Advanced Technology, Chinese Academy of Sciences, Shenzhen, Guangdong 518055, P. R. China. E-mail: long.meng@siat.ac.cn
bThe Brain Cognition and Brain Disease Institute, Shenzhen Institute of Advanced Technology, Chinese Academy of Sciences, Shenzhen, P. R. China. E-mail: saralilei@siat.ac.cn
cUniversity of Chinese Academy of Sciences, Beijing 100190, P. R. China
dCollege of Medicine and Biological Information Engineering, Northeastern University, Shenyang, Liaoning 110016, P. R. China
eCenter for Reproductive Medicine, Shanghai 10th People's Hospital of Tongji University, Shanghai 200072, P. R. China. E-mail: trx1124@126.com
First published on 11th October 2024
Abstract
Assisted reproductive technology (ART) has emerged as a crucial method in modern medicine for tackling infertility. However, the success of fertilization depends on the quality and quantity of sperm, often necessitating invasive surgical intervention, which presents challenges for non-invasive in vitro fertilization. Acoustic microfluidics technology has found widespread application across various biological contexts. In this paper, we propose to introduce a novel approach using asymmetric acoustic streaming generated by a single interdigital transducer (IDT) to enhance sperm concentration and improve fertilization in vitro, particularly in cases of moderate oligozoospermia. The concentration of particles increased approximately 6-fold in the central region after acoustic enrichment. Moreover, sperm motility was significantly improved without additional DNA fragmentation, and all the oocytes remained viable after 5 min of acoustic enrichment. Notably, acoustic enrichment accelerated fertilization and embryo development, leading to a higher fertilization rate and faster cleavage speed. Specifically, within 36 hours, the multiple-cell embryo ratio was significantly increased compared to the control group. This finding further validates the feasibility and non-invasiveness of acoustic enrichment for sperm fertilization in vitro. This work provides a promising tool for in vitro fertilization, holding significant implications for assisted reproduction.
Introduction
Over 48.5 million couples worldwide have faced challenges in conceiving a child for 5 years or longer.1,2 Among these, male infertility plays a significant role, accounting for about 30 to 50 percent of all infertility cases.3 Assisted reproductive technology (ART) has made substantial contributions to addressing global infertility for more than 40 years.4 As a result of advancements in ARTs, an increasing number of infertile couples have achieved successful pregnancies and given birth to healthy children.5,6 However, only 26.4% of couples undergoing ART cycles have been able to achieve live births.7 Despite extensive research and efforts, ART still appears to be relatively immature.8ART, such as in vitro fertilization (IVF), intrauterine insemination (IUI), and intracytoplasmic sperm injection (ICSI), have significantly aided infertile couples in achieving conception.9,10 Clinical practices of IUI, IVF and ICSI have been employed to address male infertility challenges.11 Among the most common semen abnormalities encountered are low sperm concentration, poor sperm motility, and abnormal sperm morphology.12,13 These abnormalities can result in a relatively low sperm recovery rate, subsequently affecting conception rates.
As a result, it is important to enrich sperm efficiently and safely.14 Conventional methods of sperm enrichment include the swim-up method, density gradient centrifugation, and sperm washing. These methods involve multiple centrifugation steps that may damage sperm morphology, induce significant DNA fragmentation and reactive oxygen species (ROS) in the healthy sperm, which differ from those naturally chosen in the female reproductive tract (FRT), and negatively affect ART outcomes by decreasing the probability of pregnancy.15,16 To overcome the limitations of centrifugation-based methods, various sperm selection techniques have been developed to enhance sperm fertilization potential. Microfluidic screening, for instance, relies primarily on sperm motility, but its fertilization efficiency is constrained by its inability to fully replicate the physiological environment.17,18 Magnetic-activated cell sorting typically combines with density-gradient centrifugation to remove contamination by leukocytes and immature germ cells, making the process cumbersome and time-consuming.19 Therefore, there is an urgent need for a further improved ART that has critical features, such as non-invasiveness, time efficiency, cost-effectiveness, and ease of operation.
Surface acoustic waves (SAWs) are a type of acoustic wave that propagates along the material's surface, with the energy confined in close proximity to the surface.20 SAWs are typically generated by an interdigital transducer (IDT) and can induce compression waves within a fluid medium, resulting in the acoustic streaming in droplets due to viscous attenuation.21 The use of acoustic streaming has been extensively explored for various biomedical applications, especially in cell manipulation and concentration with high safety.22–27 SAW-induced acoustic streaming can immobilize, translate, and rotate C. elegans worms.26 The immobilization process is gentle and non-invasive, allowing for rapid recovery immediately after the removal of acoustic waves.28 It has been demonstrated that a high-frequency ultrasound could also boost sperm motility by increasing the intracellular rate of metabolic activity at various dimensions with no significant change in cell viability or DNA fragmentation index.29 This suggests that acoustic-based approaches have the potential to provide a biocompatible and safe method for sperm enrichment in assisted reproductive technologies. Currently, acoustic waves have been employed in applications such as extracting sperm from sexual assault samples and selecting sperm with high DNA integrity.30–33 However, their application in sperm concentration to enhance assisted reproduction remains unexplored.
In this study, we introduced a novel method using ultrasound to enhance fertilization efficiency in ART, particularly in cases of moderate oligozoospermia with slow or immobile sperm. By enriching sperm using acoustic streaming and secondary acoustic radiation force (ARF), the probability of sperm–oocyte collision is increased, resulting in higher fertilization rates. Prior experiments demonstrated that particles within droplets could be enriched approximately 6-fold. The results further showed that smaller particles tend to move towards larger particles due to asymmetrical acoustic streaming and secondary ARF. In sperm experiments, a small number of sperm experienced acoustic streaming and secondary ARF, moving toward the oocyte with an input power of 900 mW. After acoustic enrichment, sperm motility significantly improved in terms of curvilinear swimming velocity, progressive motility, and overall sperm motility. Analysis of sperm chromatin structure revealed no significant difference in sperm DNA fragmentation compared to the control group, indicating that the enriched sperm remained viable, motile, and healthy. The oocytes also remained viable after a 5 min acoustic enrichment. Furthermore, significantly higher rates of fertilization and faster development of fertilized embryos observed than the control group demonstrate the efficacy of acoustic enrichment in fertilization improvement. This confirms the feasibility and non-invasiveness of acoustic techniques to enhance fertilization in vitro, even with limited sperm counts.
Materials and methods
Device fabrication
The fabrication of the surface acoustic wave (SAW) chip involved four distinct steps. Initially, the piezoelectric lithium niobite (LiNbO3) 128° Y–X-axis-rotated cut, X-propagating crystal substrate underwent cleaning and washing with acetone and IPA solutions, followed by drying using N2 pressure gun. In the second step, the substrate was spin-coated with the positive photoresist AZ5214, achieving a smooth layer at a speed of 3000 rpm for 30 s. In the third step, the design for the SAW interdigital transducer (IDT) was transferred to the substrate through standard UV photolithography technique by a UV mask aligner machine (URE 2000/35, SIAT Chinese Academy of Sciences, Shenzhen), and the substrate development ensued using MF 321 developer solution. In the last step, a double metal layer (Cr/Au) was deposited by using the magnetron sputtering machine (NANO-MASTER NSC-3500, Texas America). To eliminate excessive gold metal, the substrate underwent immersion in acetone for 30 min and was subjected to low-power ultrasonication for 1 min.34 An IDT consisted of 10 straight finger pairs and the aperture of IDT was 16 mm to generate SAW. Consistent with theoretical results, the corresponding resonant frequency of IDTs was 5.287 MHz with an insertion loss of −7.4 dB, measured using a vector network analyzer (VNA, ZVA40, Rohde and Schwarz, Germany).Polystyrene particle preparation
Different particle materials were utilized in the experiments. Polystyrene (PS) particles (FCGB008, Bangs Laboratories, Inc, USA) with a diameter of 5 μm were employed for particle aggregation. PS particles (BCCB33, Sigma-Aldrich, USA) with a diameter of 100 μm were employed for substituting the oocyte–cumulus complex. The 1 μm red fluorescent particles (SEQ-R-020, Tianjin Saierqun Technology Co., Ltd., China) had a maximum excitation wavelength of 620 nm and a maximum emission wavelength of 680 nm. The 75 μm green fluorescent particles (FGP75K, Lab261, USA) had a maximum excitation wavelength of 460 nm and a maximum emission wavelength of 500 nm. The density of particles used in the experiments is 1.06 g cm−3.Animal
All husbandry and experimental procedures in this study were approved by the Animal Care and Use Committees of the Shenzhen Institute of Advanced Technology (SIAT), Chinese Academy of Sciences, conducted in accordance with the principles and procedures outlined in the SIAT Guidelines for the Care and Use of Laboratory Animals. C57BL/6J mice (obtained from Guangzhou Charles River Laboratory Animal Technology Co., Ltd., China) were used in this study. All animals were housed at 20–25 °C on a circadian cycle of 12 hour light–dark (lights on at 08:00 am and off at 08:00 pm) with ad libitum access to food and water.Source of sperm
Five steps were conducted to prepare sperm with 8–12 weeks C57BL/6J male mice. Firstly, TYH sperm capacitive solution (M2030, Aibei, China) was added to the Petri dish, which was covered with mineral oil (M8410, Sigma-Aldrich, USA) to reach an equilibrium in an incubator at 37 °C with 5% CO2 for more than 4 h.35 Secondly, anesthetization of mice was conducted using 2.5% isoflurane (020037015, Ringpu (Tianjin) Bio-Pharmacy Co., Ltd., China) via a nose cone. Thirdly, the abdomen and epididymides of mice were disinfected with 75% alcohol cotton balls. The epididymides were collected after the abdomen of mice was cut. Fourthly, the epididymides were put in a culture dish full of culture media and were cut to release sperm. Fifthly, the culture dish was placed in an incubator for 10 min, after which the sperm were dispersed and then collected. After dilution of the sperm, the concentration was about 8 million per mL, indicating a moderate oligozoospermia condition.36 Approximately 8000 sperm were found in a 1 μL droplet. Due to the lack of sperm selection in the experiment, the sample contains sperm with relatively slow motility and immobility.Source of oocyte
For the preparation of ovary extracts, 1.5–3 months old female C57BL/6J mice were applied to extract the ovary through superovulation. For the superovulation treatment, females were first injected with pregnant mare serum gonadotropin (PMSG, 5.0 IU, P9970, Solarbio, China), which mimics the action of endogenous follicle-stimulating hormone (FSH) to promote oocyte maturation. Using human chorionic gonadotropin (HCG, 5.0 IU per mouse, Sigma-Aldrich Corp.) mimics the induction of ovulation by luteinizing hormone (LH), which was injected 48 h later.37 And the ovaries were collected between 12 h and 14 h after the injection of HCG.For ovary collection, the oocyte culture drops were prepared by using a pipette to dispense human fallopian tube fluid (HTF) medium (M1130, Aibei, China) in small droplets into a 60 mm culture dish, cover HTF drops with mineral oil (M8410, Sigma-Aldrich, USA) and put in the incubator (37 °C, 5% CO2) for more than 4 h. HTF could provide a glucose-rich environment to promote the efficient metabolism of the oocyte–cumulus complex and sperm.38 To retrieve the oviduct, anesthetization of mice was conducted with 2.5% isoflurane (020037015, Ringpu (Tianjin) Bio-Pharmacy Co., Ltd., China) via a nose cone. Secure the oviduct with forceps, then open the ampulla longitudinally using a 1 mL syringe needle to release the oocytes into the liquid. Once completed, the oocytes were then transferred to the prepared HTF drops and returned to the incubator for further utilization.
Particle image velocimetry (PIV)
In this study, the streamlines of droplet particles were traced using the particle image velocimetry (PIV) technique. The aggregation process of the particles was recorded by an inverted microscope. Cross-correlation algorithm was applied to obtain the acoustic streaming velocity by calculating the displacement of the particles in a certain time. Typically, PIV analysis involves five main steps: image pre-processing, image analysis, calibration, post-processing, and image plot. All the image processing procedure was performed using the PIVlab 2.62 plug-in (R2021b) in MATLAB 9.11.39,40Firstly, the contrast limited adaptive histogram equalization (CLAHE) method was developed to remove the background. During the PIV setting, FFT window deformation was applied to analyze the transient behavior of the particles. Employing interrogation areas of uniform size, this method results in information loss with each particle displacement, which can be mitigated by the increasing amount of background noise in the correlation matrix. Calibration was performed by entering the image scale and the time interval between images to determine the particle motion velocity. Post-processing of PIV data was generally required to obtain reliable results. An elementary approach to filter outliers in PIVlab was to choose limits for acceptable velocities, which were determined by changing the mean velocity and standard deviation of velocity. Employing local median filtering by adjusting its values was a technique for smoothing PIV data, effectively reducing noise. Finally, plot functions were used to generate instantaneous velocity vector plots, velocity field maps, and streamline maps.41
Design of the concentration system
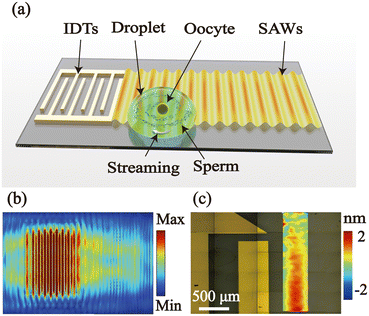
The SAW device was fixed on an inverted microscope (Zeiss observer Z1, Zeiss, Germany), with a high-speed camera (C13440, Hamamatsu, China) to visualize and record the movement of particles and cells. RF signal generator (RIGOL DG4162, RIGOL, China) supplied AC signals at a frequency of 5.287 MHz to establish the acoustic field in the LiNbO3 substrate. We utilized a high-frequency amplifier (ZHL-1-2W+, Mini-Circuits, USA) to amplify the AC signal applied to the driving electrodes for higher electric field strength. Additionally, the actuation signal was monitored by a digital oscilloscope (Tektronix 4104, Tektronix, China).Fig. 1(b) shows the simulation results of acoustic waves propagating on the lithium niobate (LN) substrate by software COMSOL Multiphysics (version 5.4).42 The interfinger was consistent with the experimental IDT parameters, the frequency was set at 5.287 MHz, and the logarithm was 10 pairs. These results elaborate that the acoustic vibration amplitude propagating on the piezoelectric LN substrate was 1.53 nm. The experimental vibration amplitude was characterized using a laser Doppler vibrometer (UHF-120, Polytec, Germany) as shown in Fig. 1(c). The acoustic vibration amplitude at an input electronic power of 900 mW was consistent with the simulation result.
In acoustofluidic systems, the diameter of a 1 μL droplet deposited on the substrate measures approximately 2 mm, with its distance from the IDT about 2 mm. A portion of the droplet comes under the influence of the surface acoustic waves (SAWs) generated by the IDT. The imbalance of acoustic energy within the droplet due to this interaction leads to rotational acoustic streaming (Fig. S1†).
Fluorescent staining for sperm viability
To evaluate the concentration of live and dead sperm near the oocyte before and after acoustic streaming, we utilized a combination of phosphate buffered solution (PBS) (C01-01003, Bioss Antibodies, china), calcein-AM (22002, AAT Bioquest, USA), and propidium iodide (PI) (MKCC9922, Sigma-Aldrich, USA) to stain the sperm solution. Calcein-AM is a nonfluorescent, hydrophobic compound that easily permeates intact live cells. The hydrolysis of calcein-AM by intracellular esterases produces calcein, a strongly green fluorescent compound that is well-retained in the cell cytoplasm.43 PI enters late apoptotic and necrotic cells, passes through the disrupted nuclear membrane and intercalates into DNA, causing red fluorescence in the nucleus.44 The density of the calcein-AM was 50 μL mL−1, and PI was 80 μL mL−1. The staining solution (10 μL) was added to diluted sperm suspension (100 μL), and 10 min incubation in an incubator at 37 °C with 5% CO2 in the dark environment was conducted. An inverted fluorescence microscope was applied to record the enrichment process in real-time at a speed of 4 frames per s.Sperm motility estimation after acoustic enrichment
Computer-assisted semen analysis (CASA) was used to analyze the effect of acoustic treatment on sperm motility.45 The samples were placed on a sperm counting plate (ML-CASA 20, Mailang, China), and analyzed with the Suiplus-SSA CASA system (Suiplus, China). Sperm samples were collected from the left epididymis of three mice. Each experiment was replicated three times using one mouse for consistency. Each specimen was evaluated for at least 100 total sperm across three fields, and the sperm parameters including curvilinear velocity (VCL), sperm progressive motility (PR) (%), sperm motility (progressive and non-progressive motility) (PR + NP) (%), and progressive sperm number were determined.Oocyte viability test after acoustic enrichment
Trypan blue (15250061, Gibco, America) was applied to estimate the safety of the acoustic enrichment. In each experiment, ten oocytes were subjected to acoustic treatment for 5 min at an input electronic power of 900 mW, repeated three times. Then, trypan blue was used to detect oocyte viability and membrane integrity. The oocytes were incubated in 0.4% of trypan blue for 5 min at room temperature (26 ± 1 °C) and then washed in saline. Trypan blue stains dead oocytes with a distinctive blue colour when observed under a microscope, while viable oocytes appear unstained.46Sperm DNA fragmentation analysis after acoustic enrichment
The sperm chromatin structure assay (SCSA) was employed for sperm DNA integrity analysis using an Acridine Orange Stain Kit (SpermFunc® SCSA, BRED Life Science Technology Inc, China).47 A flow cytometer (Beckman CytoFLEX S, Beckman, America) with a 488 nm luminescence was applied to statistically detect the sperm chromatin structure, analyzing 10![[thin space (1/6-em)]](https://www.rsc.org/images/entities/char_2009.gif) 000 sperm per sample for conclusive assessment.
000 sperm per sample for conclusive assessment.
Statistical analysis
All the experiments in the manuscript were repeated three times. Statistical analyses were performed using PRISM software (GraphPad Software Inc, USA), with all plots presented as mean ± SEM (the standard error of the mean). The Schapiro–Wilk (K–W) method was used to test the normality of measurement data. The Student's t-test was employed to compare the experiment group with acoustic treatment and the control group without acoustic treatment. Statistical significance was taken as *p < 0.05, **p < 0.01, ***p < 0.001.Results and discussion
Enrichment of particle concentration induced by SAW
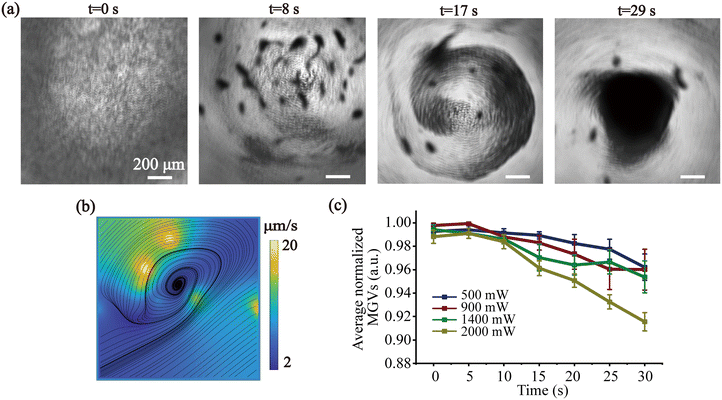
The device was mounted on the stage of a microscope to record the particle enrichment process. A 1 μL droplet of PS particles was asymmetrically deposited on the LiNbO3 substrate, at the boundary of the SAW aperture using a micropipette (Eppendorf, Hamburg, Germany). A continuous AC signal was produced by a RF signal generator.In this work, the droplet was intentionally placed asymmetrically along one side of the SAW propagation pathway such that it only experienced the radiation across a partial asymmetrical fraction in the whole acoustic field. Fig. 2 and Movie S1† show the behavior of 5 μm particles within the droplet by asymmetric SAW-induced acoustic streaming as individual image frames acquired by microscopy at different times. At first, in Fig. 2(a), in the absence of acoustic power, the particles were uniformly dispersed within the droplet. When 2 W input electronic power was applied to the IDT, a single vortex acoustic streaming was generated, along with the hydrodynamic viscous force, which was able to enrich particles in the center of the droplet as shown in Fig. 2(a). After 29 s acoustic treatment, a decrease in particle spread diameter from 2 mm to 0.8 mm, indicating that the particles were concentrated at the center of the droplet approximately 6-fold.
The trajectory of particles was recorded by a high-speed camera mounted in the microscope and the acoustic streaming of the droplet was analyzed by PIVlab 2.62 software. Fig. 2(b) shows the velocity streaming lines of particle concentration towards the droplet center, which were performed on the experimental data by tracking particles at the eighth-second segment of the video. All the particles would eventually move toward the center of the droplet in spiral traces by acoustic streaming and finally enriched in the center (Fig. 2(a)).
The impact of the input power on the enrichment of the PS particles was shown in Fig. 2(c). Thirty seconds after the acoustic treatment, the average normalized mean gray values (MGVs) of the PS particles within an enriched region of the droplet were analyzed to evaluate the enrichment efficiency. An approximately twofold increase in enrichment rate was observed as the input power increased from 500 mW to 2000 mW. This trend highlights the enhanced efficiency of PS particle enrichment with increasing input power.
Acoustic trapping fluorescent particles induced by secondary ARF
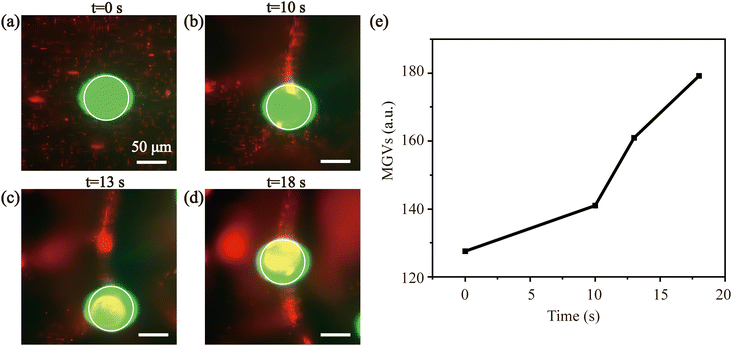
To simulate the behavior of sperm around oocyte under the influence of SAWs, we employed fluorescent particles with different sizes for concentration in vitro.This process was investigated by observing the behavior of red fluorescent particles (1 μm) and green fluorescent particles (75 μm) in the acoustic field (Fig. 3 and Movie S2†) recorded by the inverted fluorescence microscope. Fig. 3(a) shows that in the absence of the acoustic field, the particles dispersed randomly in the droplet. With an input power of 900 mW, the small particles (1 μm) moved around and eventually were enriched at the surface of the large particles (75 μm). The particle concentration effect could also be verified by calculating the MGVs around the large particles' surface. The particle concentration increased along with time as more small fluorescent particles contributed to higher average gray values around the large particle in Fig. 3(e). The 1 μm particles were attracted to the surface of 75 μm particles due to gravitational forces between them. This attraction may be attributed to the short distance between the particles and the high concentration of particles in an acoustic field during the enrichment process, leading to the emergence of an additional force known as the secondary ARF between particles.
Acoustic enrichment of sperm
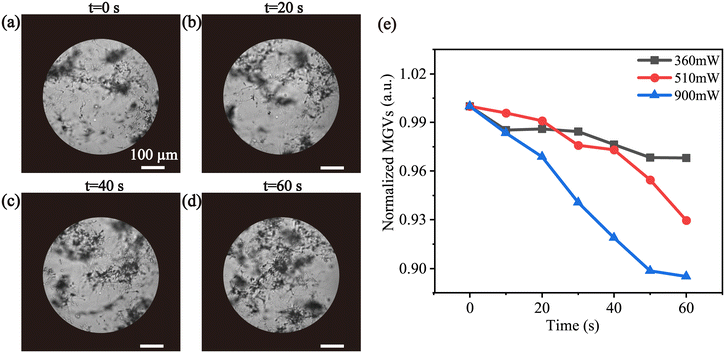
We used 1 μL of sperm suspension to obtain a small amount of sperm condition. The enrichment process was driven by a continuous SAW, which was recorded by a high-speed camera mounted in an inverted microscope. A circle with a diameter of 0.5 mm in the center of the droplet was chosen as the area of interest to estimate the enrichment quality. Different input power (360 mW, 510 mW, 900 mW) were employed to investigate their impact on the sperm enrichment process. Fig. 4(a–d) depicts the enrichment effect under the influence of 900 mW input power for one minute. Images were selected every 20 s to calculate their MGVs from the experiment videos. The gray value of the sperm sample decreased over time indicating the occurrence of sperm enrichment. In Fig. 4(e), the normalized MGVs decreased with the increased input power, suggesting enhanced sperm enrichment at higher power levels.The higher density of sperm heads leads to a greater gravitational force,48 causing them to sediment more readily, which poses a challenge in the enrichment of sperm. Compared to accumulating PS microparticles, we extended the duration of acoustic treatment to efficiently accumulate the sperm. It has been demonstrated that enrichment of sperm was achieved within 1 min. Consequently, in order to obtain better fertilization results, in the subsequent experiments involving fertilization between sperm and the oocyte, an acoustic input power of 900 mW was employed.
Acoustic enhancement the success rate of IVF
Based on PS particle and sperm enrichment results, we proceeded to investigate the enrichment and fertilization of sperm around oocytes in vitro. To mimic an extreme fertilization condition with moderate oligozoospermia, we deposited a 1 μL diluted sperm suspension through a micropipette on the LN substrate beyond the axis of SAW propagation. Approximately 8000 sperm were used in the experiment, and they were not subjected to selection. For each experiment, a single cumulus–oocyte complex was aspirated into a micropipette and introduced into the sperm sample. This limited sperm and oocyte condition was applied to investigate the possibility of fertilization based on acoustic technique in an extreme environment. The acoustic input electronic power was 900 mW based on the particle and sperm enrichment experimental results with a duration of 5 min.To reduce polyspermic fertilization, we implemented three strategies in our experiment. Firstly, drawing inspiration from Li's research,49 we intentionally maintained a notably lower sperm-to-oocyte ratio of approximately 8 × 10³![[thin space (1/6-em)]](https://www.rsc.org/images/entities/char_2009.gif) :
:![[thin space (1/6-em)]](https://www.rsc.org/images/entities/char_2009.gif) 1 during IVF, significantly deviating from the conventional IVF range (5 × 10⁵–10 × 105
1 during IVF, significantly deviating from the conventional IVF range (5 × 10⁵–10 × 105![[thin space (1/6-em)]](https://www.rsc.org/images/entities/char_2009.gif) :
:![[thin space (1/6-em)]](https://www.rsc.org/images/entities/char_2009.gif) 1).50 This adjustment aimed to reduce the likelihood of multiple sperm penetrating a single oocyte, thereby minimizing polyspermic fertilization.51 Secondly, we utilized fresh oocytes for their zona pellucida and oocyte membrane block functionality. These natural defenses serve as effective barriers against multiple sperm entry, further lowering the risk of polyspermic fertilization.52,53 Finally, we retained the cumulus cells surrounding the oocytes. The presence of these cells acts as an additional physical barrier, further restricting sperm access to the oocyte and contributing to a decreased occurrence of polyspermic fertilization.49 Together, these strategies worked in concert to significantly reduce the likelihood of polyspermic fertilization in our experiments.
1).50 This adjustment aimed to reduce the likelihood of multiple sperm penetrating a single oocyte, thereby minimizing polyspermic fertilization.51 Secondly, we utilized fresh oocytes for their zona pellucida and oocyte membrane block functionality. These natural defenses serve as effective barriers against multiple sperm entry, further lowering the risk of polyspermic fertilization.52,53 Finally, we retained the cumulus cells surrounding the oocytes. The presence of these cells acts as an additional physical barrier, further restricting sperm access to the oocyte and contributing to a decreased occurrence of polyspermic fertilization.49 Together, these strategies worked in concert to significantly reduce the likelihood of polyspermic fertilization in our experiments.
The process of enrichment under a persistent ultrasonic excitation was observed through microscopy, as depicted in Fig. 5. Movie S3† shows the trajectory of sperm around the oocyte by asymmetric SAW-induced acoustic streaming. After 5 min of acoustic treatment, the majority of the sperm were enriched on the surface of the oocyte, which increased the opportunities for sperm to collide with the oocyte and may induce a higher fertilization rate.
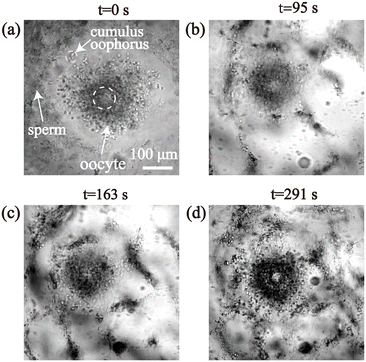 | ||
| Fig. 5 (a) Fertilization process of sperm and oocyte before applying power to the IDT. (b) Sperm clusters formed after 64 s actuation, (c) 163 s actuation, and (d) 291 s actuation. | ||
To evaluate the concentration of the live and dead sperm around the oocyte before and after streaming, fluorescently staining and real-time recording were conducted. Calcein-AM and PI were utilized to indicate the live and dead sperm. A non-fluorescent PS particle with a diameter of 100 μm was utilized to indicate the oocyte. Fig. S2† demonstrates that the majority of the sperm accumulated on the oocyte surface was live sperm (green fluorescence).
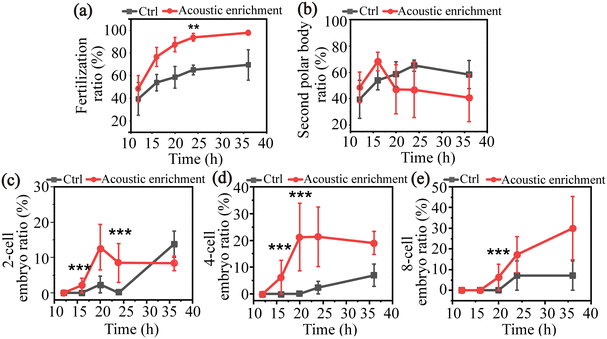
The IVF experiment was conducted three times with 15 oocytes for each trial to investigate its fertilization with/without the acoustic treatment. The control group underwent all the procedures and parameters as same as the acoustic treated group except for the acoustic enrichment. After acoustic treatment, in order to facilitate cell culture, the sperm and oocyte mixed solution was moved to HTF solution and subsequently placed in an incubator for further cultivation. After 12 h, the presence of a second polar body was observed in both the experimental and control groups, signifying the successful fertilization of a subset of oocytes. In the acoustic treatment group, embryos progressed to 2-cell, 4-cell, and 8-cell stages within 36 h, as depicted in Fig. 6. The progression of embryo development demonstrates the potential of acoustic enrichment in facilitating successful fertilization and subsequent healthy embryo formation.
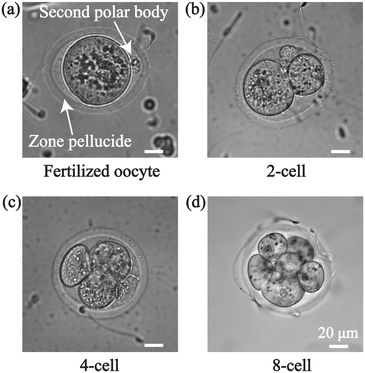 | ||
| Fig. 6 Fertilization and embryo development after acoustic manipulation. (a) Second polar body, (b) 2-cell, (c) 4-cell, and (d) 8-cell formed after 36 h of acoustic treatment. | ||
Fig. 7(a) shows that 48.5 ± 11.6% of the oocytes exhibited successful fertilization at 12 h post-acoustic enrichment and a higher fertilization ratio of 98.0 ± 2.0% was obtained at 36 h. While for the control group without acoustic enrichment, a 39.5 ± 14.4% fertilization ratio was observed at 12 h, which grew to 69.5 ± 13.4% at 36 h. The fertilization ratio of the treatment group was significantly higher than that of the control group at 24 h. Fig. 7(c and d) demonstrates significantly higher fertilization rates for two-cell and four-cell embryos in the treatment group compared to the control group at 16 h. Ultimately, at 36 h post-acoustic treatment, 57.4% of multiple-cell embryos were successfully developed, which is 2-fold than the control group. In Fig. 7(b), for the acoustic enrichment, the second polar body ratio decreased as early as 16 h. An increasing number of fertilized oocytes progressed into multiple-cell embryos over time, resulting in the two-cell and four-cell embryo ratio reducing with a subsequent rise in the eight-cell embryo ratio. This is consistent with the second polar body ratio curve (Fig. 7(b)). In Fig. 7(c and d), two-cell and four-cell embryos appeared earlier than the control group at 16 h, and in Fig. 7(e), eight-cell embryos appeared at 20 h post-acoustic enrichment. This suggests that acoustic enrichment may have the ability to enhance the development of multiple-cell embryos. These phenomena indicate that acoustic enrichment could significantly improve the fertilization rate and promote embryo development.
At an extreme condition with short amounts of sperm and oocyte, the SAWs realized effective sperm enrichment encompassing a single oocyte, which raised the collision probability between the sperm and the oocyte. The increased presence of 2-cell, 4-cell, and 8-cell states further confirm its fertilization ability with few sperm. These findings confirm that SAW is capable of enhancing fertilization outcomes for moderate oligozoospermia. Moreover, this further validates the potential of acoustic waves as a non-invasiveness and non-destructive method for IVF applications in the future.
Safety of sperm and oocytes after acoustic treatment
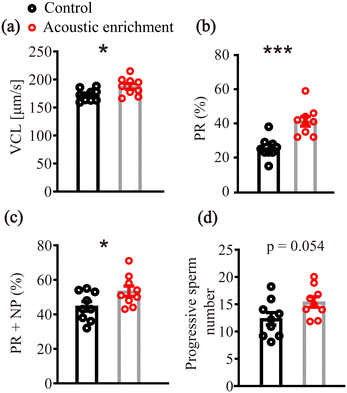
To further detect the quality of the fertilized sperm and oocytes, sperm motility estimation, sperm DNA fragmentation test and oocyte viability examination were conducted post-acoustic enrichment.For sperm motility evaluation, several important parameters such as VCL (sperm instantaneous swimming velocity along its trajectory), PR (%), PR + NP (%) and progressive sperm number were significantly improved by acoustic treatment (Fig. 8), indicating that ultrasound exposure was capable of enhancing sperm motility. This phenomenon is highly consistent with the results of the most recent literature.54 These confirmed that the quality of sperm after acoustic enrichment was not altered. Instead, the sperm motility was significantly improved.
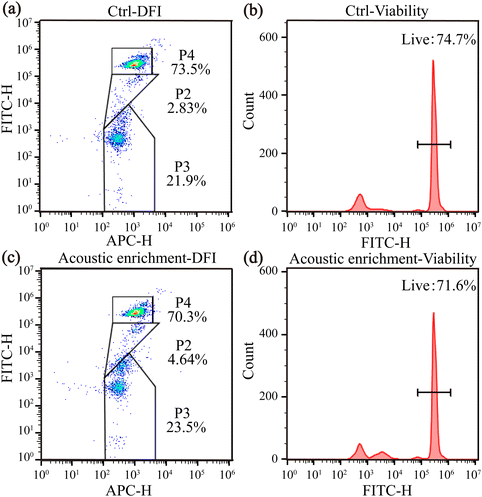
Sperm chromatin structure analysis was also conducted post-acoustic enrichment to assess whether the acoustic treatment induced DNA fragmentation. These abnormal protein–DNA complexes allow greater access of acridine orange dye (AO) to sperm DNA thus producing a high DNA Stainable (green fluorescence) fraction (HDS). The SCSA utilizes the metachromatic properties of the fluorescent stain AO, and the shift from green fluorescence (double-stranded, native DNA) to red fluorescence (single-stranded, denatured DNA). The DFI and HDS of the acoustic-enriched sperm did not show a significant difference compared to the control group, which means the acoustic enrichment didn't induce significant additional DNA fragmentation (Fig. 9(a and c)).
Viability assessments in Fig. 9(b and d) show that the control and the acoustic enrichment groups maintained their viability more than 70%. No significant difference in viability was found between the acoustic enrichment and control groups. These results further confirmed the enriched sperm were live, motile and healthy. Moreover, all the oocytes in the experiments remained alive post-acoustic enrichment, which provided an embryo developmental potential. During the long-term embryo observation, the number of the multiple-cell embryos increased over time, and more than 30% of fertilized oocytes developed into healthy 8-cell embryos, furtherly confirming the safety of acoustic enrichment.
Furthermore, to ensure that the temperature elevation of the device did not affect the viability of the cells, we measured the temperature change of droplet in real-time using an infrared camera (InfRec R300SR, Nippon Avionics, Japan). Fig. S3† shows the variation of the temperature of the droplet over time. With an input power of 900 mW, the device reached the maximum temperature of about 30.2 °C within 300 s, which may not cause side effects of oocyte viability. These results confirm the safety and biocompatibility of this device.
Conclusions
In summary, we present a novel approach to improve in vitro fertilization using acoustic streaming and secondary ARF induced by SAW. Our SAW device exhibits an asymmetric distribution of the acoustic energy within the droplet on the substrate. Under the influence of the SAW, the particle concentration in a 1 μL droplet was increased by approximately 6-fold. The tracking of the particle's motion confirmed their vortex-like movement toward the center under acoustic streaming. The 1 μm fluorescent particles within the droplet were attracted to the 75 μm fluorescent particles due to secondary ARF, resulting in their enrichment on the surface of the larger particles.We introduce an acoustofluidic enrichment method to enrich sperm toward the oocyte surface. This method aims to improve fertilization efficiency at a limited condition, such as moderate oligozoospermia with relatively slow motility and immobility. Post-acoustic enrichment, ultrasound significantly improved sperm motility and did not obviously induce additional DNA fragmentation. Moreover, oocytes remained viable and healthy after 5 min acoustic enrichment. The fertilization ratio of the acoustic enrichment group was significantly higher than the control group at 24 h. Multiple-cell embryos appeared earlier than in the control group. These results demonstrate that acoustic enrichment enables to result in a higher fertilization rate and promote embryo development in a biocompatibility manner. In comparison to alternative fertilization methods, our device offers simplicity in design and operation, ease of control, cost-effectiveness, high biocompatibility, and the ability to handle moderate oligozoospermia.
Data availability
All data needed to evaluate the conclusions in the paper are present in the paper and/or the ESI.†Author contributions
C. Q. Zhang: conceptualization, methodology, investigation, validation, data curation, formal analysis, visualization, writing – original draft, writing – review & editing. N. Rong: conceptualization, methodology, investigation, supervision, formal analysis, writing – review & editing. Z. Y. Lin: investigation, validation, data curation, formal analysis, writing – review & editing. P. Q. Li: software, formal analysis, writing – review & editing. J. Y. Shi & W. Zhou: visualization, formal analysis, writing – review & editing. L. L. Niu & F. Li: conceptualization, formal analysis, writing – review & editing. R. X. Tang, L. Li & L. Meng: resources, writing – review & editing. All authors reviewed the manuscript.Conflicts of interest
There are no conflicts to declare.Acknowledgements
This work was supported by Strategic Priority Research Program of the Chinese Academy of Sciences (XDB0930000), National Natural Science Foundation of China (Grant No. 12227809, U23A20479, T2122023, and 32301208) and Natural Science Foundation of Guangdong Province (202381515040008).Notes and references
- E. T. Y. Leung, C.-L. Lee, X. Tian, K. K. W. Lam, R. H. W. Li, E. H. Y. Ng, W. S. B. Yeung and P. C. N. Chiu, Nat. Rev. Urol., 2022, 19, 16–36 Search PubMed.
- D. C. Kieslinger, C. G. Vergouw, L. Ramos, B. Arends, M. H. J. M. Curfs, E. Slappendel, E. H. Kostelijk, M. H. E. C. Pieters, D. Consten, M. O. Verhoeven, D. E. Besselink, F. Broekmans, B. J. Cohlen, J. M. J. Smeenk, S. Mastenbroek, C. H. De Koning, Y. M. Van Kasteren, E. Moll, J. Van Disseldorp, E. A. Brinkhuis, E. A. M. Kuijper, W. M. Van Baal, H. G. I. Van Weering, P. J. Q. Van Der Linden, M. H. Gerards, P. M. Bossuyt, M. Van Wely and C. B. Lambalk, Lancet, 2023, 401, 1438–1446 CrossRef.
- T. Chinnasamy, J. L. Kingsley, F. Inci, P. J. Turek, M. P. Rosen, B. Behr, E. Tüzel and U. Demirci, Adv. Sci., 2018, 5, 1700531 CrossRef.
- G. D. Adamson, F. Zegers-Hochschild and S. Dyer, Fertil. Steril., 2023, 120, 473–482 CrossRef.
- A. Richardson, M. Taylor, J. P. Teoh and T. Karasu, Obstet. Gynaecol., 2020, 22, 34–44 Search PubMed.
- A. Thwaites, J. Hall, G. Barrett and J. Stephenson, Hum. Reprod., 2023, 38, 1590–1600 CrossRef.
- S. S. Malchau, A. A. Henningsen, J. Forman, A. Loft, A. Nyboe Andersen and A. Pinborg, Hum. Reprod., 2019, 34, 171–180 CrossRef.
- K. H. Beilby, E. Kneebone, T. J. Roseboom, I. M. van Marrewijk, J. G. Thompson, R. J. Norman, R. L. Robker, B. W. J. Mol and R. Wang, Hum. Reprod. Update, 2023, 29, 272–290 CrossRef.
- M. H. Johnson, Int. J. Dev. Biol., 2019, 63, 83–92 CrossRef.
- V. N. Bolton, M. J. Perez, G. Hughes, T. Moodley, M. Dean, A. Fernandez-Ponce, G. Southall-Brown and J. Kasraie, Hum. Fertil., 2023, 26, 414–432 CrossRef.
- R. van Eekelen, I. Scholten, R. I. Tjon-Kon-Fat, J. W. van der Steeg, P. Steures, P. Hompes, M. van Wely, F. van der Veen, B. W. Mol, M. J. Eijkemans, E. R. te Velde and N. van Geloven, Hum. Reprod., 2017, 32, 346–353 CrossRef.
- T. G. Cooper, E. Noonan, S. von Eckardstein, J. Auger, H. W. G. Baker, H. M. Behre, T. B. Haugen, T. Kruger, C. Wang, M. T. Mbizvo and K. M. Vogelsong, Hum. Reprod. Update, 2010, 16, 231–245 CrossRef.
- C. Gachet, M. Prat, C. Burucoa, P. Grivard and M. Pichon, J. Clin. Med., 2022, 11, 1505 CrossRef.
- S. Medenica, D. Zivanovic, L. Batkoska, S. Marinelli, G. Basile, A. Perino, G. Cucinella, G. Gullo and S. Zaami, Diagnostics, 2022, 12, 2979 CrossRef.
- W. Asghar, V. Velasco, J. L. Kingsley, M. S. Shoukat, H. Shafiee, R. M. Anchan, G. L. Mutter, E. Tüzel and U. Demirci, Adv. Healthcare Mater., 2014, 3, 1671–1679 CrossRef.
- M. Muratori, N. Tarozzi, F. Carpentiero, S. Danti, F. M. Perrone, M. Cambi, A. Casini, C. Azzari, L. Boni, M. Maggi, A. Borini and E. Baldi, Sci. Rep., 2019, 9, 7492 CrossRef.
- Y. Fang, R. Wu, J. M. Lee, L. H. M. Chan and K. Y. J. Chan, TrAC, Trends Anal. Chem., 2023, 160, 116959 CrossRef.
- M. Yaghoobi, A. Abdelhady, A. Favakeh, P. Xie, S. Cheung, A. Mokhtare, Y. L. Lee, A. V. Nguyen, G. Palermo, Z. Rosenwaks, S. H. Cheong and A. Abbaspourrad, Lab Chip, 2024, 24, 210–223 RSC.
- T. M. Said, S. Grunewald, U. Paasch, M. Rasch, A. Agarwal and H.-J. Glander, Fertil. Steril., 2005, 83, 1442–1446 CrossRef.
- L. Meng, F. Cai, F. Li, W. Zhou, L. Niu and H. Zheng, J. Phys. D: Appl. Phys., 2019, 52, 273001 CrossRef.
- P.-Q. Li, W. Zhou, B. Peng, C. Zhang, X.-F. Zhu, L. Meng and H. Zheng, Phys. Rev. Appl., 2023, 20, 064003 CrossRef.
- Y. Yang, Y. Yang, D. Liu, Y. Wang, M. Lu, Q. Zhang, J. Huang, Y. Li, T. Ma, F. Yan and H. Zheng, Nat. Commun., 2023, 14, 3297 CrossRef.
- A. Mokhtare, B. Davaji, P. Xie, M. Yaghoobi, Z. Rosenwaks, A. Lal, G. Palermo and A. Abbaspourrad, Lab Chip, 2022, 22, 777–792 RSC.
- L. Meng, X. Liu, Y. Wang, W. Zhang, W. Zhou, F. Cai, F. Li, J. Wu, L. Xu, L. Niu and H. Zheng, Adv. Sci., 2019, 6, 1900557 CrossRef.
- L. Meng, F. Cai, Z. Zhang, L. Niu, Q. Jin, F. Yan, J. Wu, Z. Wang and H. Zheng, Biomicrofluidics, 2011, 5, 044104 CrossRef.
- W. Zhou, J. Wang, K. Wang, B. Huang, L. Niu, F. Li, F. Cai, Y. Chen, X. Liu, X. Zhang, H. Cheng, L. Kang, L. Meng and H. Zheng, Lab Chip, 2017, 17, 1725–1731 RSC.
- K. Wang, W. Zhou, Z. Lin, F. Cai, F. Li, J. Wu, L. Meng, L. Niu and H. Zheng, Sens. Actuators, B, 2018, 258, 1174–1183 CrossRef.
- N. Sridhar, A. K. Fajrial, R. L. Doser, F. J. Hoerndli and X. Ding, Lab Chip, 2022, 22, 4882–4893 RSC.
- J. Gai, E. Dervisevic, C. Devendran, V. J. Cadarso, M. K. O'Bryan, R. Nosrati and A. Neild, Adv. Sci., 2022, 9, 2104362 CrossRef.
- J. Gai, R. Nosrati and A. Neild, Lab Chip, 2020, 20, 4262–4272 RSC.
- C. P. Clark, K. Xu, O. Scott, J. Hickey, A.-C. Tsuei, K. Jackson and J. P. Landers, Forensic Sci. Int.: Genet., 2019, 41, 42–49 CrossRef.
- J. Gai, C. Devendran, A. Neild and R. Nosrati, Lab Chip, 2022, 22, 4409–4417 RSC.
- T.-Y. Wan, H.-L. Hwa, T.-T. Lee and Y.-W. Lu, Lab Chip, 2024, 24, 434–445 RSC.
- W. Wang, Y. Chen, U. Farooq, W. Xuan, H. Jin, S. Dong and J. Luo, Appl. Phys. Lett., 2017, 110, 143504 CrossRef.
- Y. Toyoda and M. Yokoyama, J. Mamm. Ova Res., 2016, 33, 3–10 CrossRef.
- C. W. Bak, S. H. Song, T. K. Yoon, J. J. Lim, T. E. Shin and S. Sung, Int. J. Urol., 2010, 17, 937–943 CrossRef.
- B.-J. Wu, H.-Y. Xue, L.-P. Chen, Y.-F. Dai, J.-T. Guo and X.-H. Li, J. Integr. Agric., 2013, 12, 1066–1072 CrossRef.
- M. Wigger, M. Schneider, A. Feldmann, S. Assenmacher, B. Zevnik and S. E. Tröder, BMC Res. Notes, 2023, 16, 184 CrossRef.
- W. Thielicke and R. Sonntag, J. Open Res. Softw., 2021, 9, 12 CrossRef.
- W. Thielicke and E. J. Stamhuis, J. Open Res. Softw., 2014, 2, e30 Search PubMed.
- S. Z. Cai, S. C. Zhou, C. Xu and Q. Gao, Exp. Fluids, 2019, 60, 1–16 CrossRef.
- P.-Q. Li, Y.-X. Shen, Z.-G. Geng, P.-C. Cao, Y.-G. Peng and X.-F. Zhu, J. Phys. D: Appl. Phys., 2020, 53, 155502 CrossRef.
- J. Uggeri, R. Gatti, S. Belletti, R. Scandroglio, R. Corradini, B. M. Rotoli and G. Orlandini, Histochem. Cell Biol., 2004, 122, 499–505 CrossRef.
- H. Zhao, J. Oczos, P. Janowski, D. Trembecka, J. Dobrucki, Z. Darzynkiewicz and D. Wlodkowic, Cytometry, Part A, 2010, 77A, 399–405 CrossRef.
- R. P. Amann and D. Waberski, Theriogenology, 2014, 81, 5–17 CrossRef.
- L. C. Crowley, B. J. Marfell, M. E. Christensen and N. J. Waterhouse, Cold Spring Harb. Protoc., 2016, 2016, pdb.prot087155 CrossRef.
- M. R. Virro, K. L. Larson-Cook and D. P. Evenson, Fertil. Steril., 2004, 81, 1289–1295 CrossRef.
- A. J. Wyrobek, M. L. Meistrich, R. Furrer and W. R. Bruce, Biophys. J., 1976, 16, 811–825 CrossRef.
- R. Li, Y. Liu, H. Pedersen and H. Callesen, Reprod. Domest. Anim., 2017, 53, 1009–1012 CrossRef.
- D. P. Wolf, W. Byrd, P. Dandekar and M. M. Quigley, Biol. Reprod., 1984, 31, 837–848 CrossRef.
- Y. Sun and A. Zhu, Gynecol. Endocrinol., 2023, 39, 2217270 CrossRef.
- E. Bianchi and G. J. Wright, Annu. Rev. Genet., 2016, 50, 93–111 CrossRef.
- G. B. Wortzman and J. P. Evans, Mol. Hum. Reprod., 2005, 11, 1–9 CrossRef.
- A. Vafaie, M. R. Raveshi, C. Devendran, R. Nosrati and A. Neild, Sci. Adv., 2024, 10, eadk2864 CrossRef.
Footnotes |
| † Electronic supplementary information (ESI) available. See DOI: https://doi.org/10.1039/d4lc00604f |
| ‡ This authors contributed equally to this work. |
| This journal is © The Royal Society of Chemistry 2024 |

