 Open Access Article
Interface-modulated morphological transition of biodegradable poly(ε-caprolactone) crystals†
Bingbing
Li
 *a and
Alan R.
Esker
b
aDepartment of Chemistry and Biochemistry, Central Michigan University, Mount Pleasant, MI 48859, USA. E-mail: li3b@cmich.edu
bDepartment of Chemistry, Virginia Tech, Blacksburg, VA 24061, USA
First published on 8th April 2024
Abstract
Poly(ε-caprolactone)(PCL)-based blends exhibit immense potential for the design of various environmentally friendly disposable or short-lived materials. The degradation of PCL components is determined by their crystallinity and crystal morphology, which is strongly correlated to the laboratory or industrial processing conditions of the blends. By using PCL/poly(t-butyl acrylate) (PtBA) mixed Langmuir monolayers as a model system, this study reports a striking interface-modulated morphological transition of PCL crystals, from highly branched symmetric dendrites, to six-arm dendrites, four-arm dendrites, seaweed-like crystals and distorted rectangular crystals. The results further demonstrate that the PCL chain folding reacts quickly to the change in the degree of undercooling (i.e., surface pressure), which controls the overall crystal morphologies through the interplay of the diffusion coefficient, surface tension, and surface tension anisotropy.
Introduction
In recent years, biodegradable polyesters have drawn significant attention from the worldwide research community to facilitate circular economy transition in the plastic industry. For semicrystalline biodegradable polyesters, their strength, toughness, biodegradability, and compostability are all strongly related to materials' semicrystalline morphologies, which are often determined by processing conditions in laboratories or manufacturing facilities. Semicrystalline morphologies are often far from equilibrium owing to the slow relaxation of polymer chains in comparison to the time frame required in polymer processing. Therefore, studies on the crystallization behaviour of biodegradable polyesters, e.g., poly(ε-caprolactone) (PCL), can provide valuable insights into the design of novel processing pathways that can potentially lead to desirable properties of various biodegradable products. For instance, the biodegradation of PCL is mainly enabled through enzyme-promoted hydrolytic reactions, which take places faster in amorphous phase than that in crystalline phase, attributing to the greater free volume of amorphous chains.Among various semicrystalline morphologies, the dendritic pattern formation of semicrystalline polymers has been one of the most intriguing topics in polymer physics and broadly condensed matter physics. Dendritic growth of condensed phase in two-dimensional confined geometries is a nonequilibrium solidification process and strongly depends on the growth conditions. For instance, poly(ethylene oxide) (PEO) exhibited dendritic morphology as PEO film thickness approaches ∼10 nm or below.1–5 A dendritic-to-faceted pattern transition of PEO crystals was observed for PEO thin films when increasing crystallization temperature.5 Upon elevating the crystallization temperature, similar transition from diffusion-limited dendritic growth to nucleation-controlled faceted crystals was also observed for isotactic polystyrene (it-PS) crystallized in thin films with a thickness of ∼11 nm.6 Furthermore, the complex evolution of PEO crystal morphology in PEO/poly(methyl methacrylate) (PMMA) thin films was found to depend on blend composition, PMMA molar mass, and crystallization temperature through tuning crystal growth rate and local diffusion field near the growth fronts of crystalline phase.7–10 Dendritic growth of polymer crystals in thin films has also been reported for other semicrystalline polymers, including poly(S-lactide),11 poly(L-lactide-b-ethylene oxide) diblock copolymer,12 and poly(L-lactide)/poly(D-lactide) blends.13 Poly(ε-caprolactone) (PCL), another important model for studying polymer crystallization, also exhibits dendritic growth in 6 nm or thinner spin-coated films at room temperature.14
Experimental parameters such as molar mass, composition, undercooling, etc. affect the dendritic growth of polymer crystals mainly through their influence on the characteristic diffusion length, by lD = 2D/G, where D represents self-diffusion coefficient of polymer chains and G is growth rate. The experimental parameters exert their influences on dendritic growth in a diffusion field near the interface between a liquid and a growing solid crystal. The diffusion field is commonly generated by either thermal or concentration gradients. However, the thermal diffusion may not give rise to interfacial instabilities in polymeric systems because the growth rate is usually too slow to compete with the thermal diffusion length.6 As a result, the effect of thermal diffusion is minimal. Meanwhile, for dendritic crystallization of single-component melts in thin films, simple concentration gradients can be ruled out. Taguchi and co-workers suggested that the diffusion field is generated by the gradient of melt thickness from the edge of the growing crystals to the surrounding polymer melts, which destabilizes the interface and leads to the formation of dendritic branches.6 However, thickness gradients of polymer melts can be converted to the surface concentration of polymer chains. Thus, this type of diffusion field can still be correlated to the concentration gradient. Nevertheless, a full understanding of the dendritic growth for polymeric systems down to molecular level is still incomplete, though numerous studies have focused on this issue.1–14
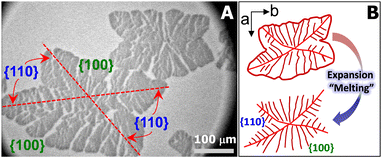
For the aforementioned studies, the model polymer thin films are usually prepared on solid substrates by spin-coating or solution casting and the film thickness is adjusted by varying the concentration of polymer solution. In contrast, the Langmuir films formed at the air/water (A/W) interface upon dynamic compression are very uniform approaching true monolayer thickness.15–19 Meanwhile, the ultrapure water minimizes the possible defects on solid substrates, providing a model surface for probing crystallization in thin films.20–22 In the past, we have reported the crystallization of PCL in metastable monolayer regime at 22.5 °C.20Fig. 1A shows the optical micrograph of a typical PCL crystal grown at the A/W interface and transferred onto silicon substrates spin-coated with polystyrene (PS). The PCL crystal exhibits two fully grown {100} sectors and two less fully grown {110} sectors, indicating that molecular diffusion from a limited material reservoir is more spatially constrained in {110}.20,22 During the expansion of crystalized Langmuir films, PCL chains unfold from crystalline phase and slither back to the liquid expansion (LE) phase on the surface of water sub-phase, resembling the “melting process” of crystals (Fig. 1B).20 The “melting” PCL crystals exhibit interesting dendritic structures, which inspired us to further explore the interfacial crystallization behaviour of PCL. For instance, when PCL/poly(t-butyl acrylate) (PtBA) mixed monolayers were dynamically compressed past the collapse transition of LE phase, compositional PCL dendrites were observed, as reported in our previous study.22 However, these early experiments were performed by controlling the compassion speed of movable barriers at a constant rate, while surface pressure, Π, the interfacial analogy of “degree of undercooling”, is indeed a variable.22
Materials and methods
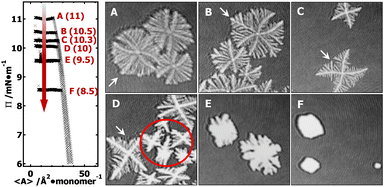
To grow PCL crystals at well-controlled Π values, in this study, a series of isobaric (i.e., constant Π) area-relaxation experiments were performed for PCL/PtBA monolayers at the A/W interface. PtBA (weight average molar mass, Mw = 25.7 kg mol−1; polydispersity index, Mw/Mn = 1.07) and PCL (Mw = 10 kg mol−1; Mw/Mn = 1.25) were purchased from Polymer Source, Inc. and used as received. Spreading solutions were prepared by dissolving the PCL/PtBA blend with PtBA mole fraction of XPtBA ∼ 0.14 in chloroform (∼0.5 mg g−1, HPLC grade). The solution was spread onto the surface of ultrapure water (18.2 MΩ cm, Milli-Q Gradient A-10, Millipore) using a Hamilton gas-tight glass syringe in a Langmuir trough (700 cm2, Nima Technology, T = 22.5 ± 0.1 °C; relative humidity = 70–75%). During isobaric area-relaxation experiments, the spreading solvent was allowed to evaporate by waiting for a suitable period of time (∼20 min) before the monolayer was compressed to a desired target Π (e.g., 11, 10.5, 10.3, 10, 9.5, and 8.5 mN m−1) at a constant compression rate of 8 cm2 min−1. The average surface area per repeating unit, 〈A〉, was then allowed to relax to smaller values while maintaining Π at a constant value. The Π was monitored by Wilhelmy plate technique. Brewster angle microscopy studies (MiniBAM with a CCD camera, NanoFilm Technologies GmbH, linear resolution ≤ 20 μm) were carried out simultaneously during the isobaric experiments. The entire instrument including the Langmuir trough, BAM and Plexiglas box rests on a floating optical table to minimize vibrations.Results and discussion
In the supersaturated monolayer regime (i.e., metastable state, Π > 6 mN m−1) for PCL systems, nucleation can be initiated at any thicker sites arising from local mass fluctuation during dynamic compression experiments. Following the formation of stable 3D nuclei, further compression leads to the rapid deposition of folded PCL chains onto the growing front of the newly formed edge-on crystallites.20–22 Previous studies have shown that the average thickness of PCL dendritic crystals grown in PCL/PtBA blends is ∼7.1 nm,22 comparable to that of single-component PCL crystals grown under comparable conditions at the A/W interface.20 In this study, all isobaric experiments were performed at a target Π value greater than 6 mN m−1 (e.g., 11, 10.5, 10.3, 10, 9.5, and 8.5 mN m−1). The target Π value for each isobaric experiment is indicated on Π − 〈A〉 isotherms in Fig. 2. The 1.6 × 1.6 mm2 BAM micrographs A–F in Fig. 2 were cut from the original 4.8 × 6.4 mm2 BAM images (Fig. S1, ESI†) in order to show morphological details of PCL dendrites. BAM images were taken at 〈A〉 ∼ 8–10 Å2 per monomer and represent different crystallization time of (A) 0.3, (B) 0.7; (C) 1.5, (D) 2.7, (E) 6.8, and (F) 7.6 hours. The crystallization time includes the time for nucleation and growth instead of total relaxation time. The morphological transition of the “winning” branches in {100} sectors are highlighted by white arrows in images A through D.BAM micrographs taken during an isobaric experiment at Π = 11 mN m−1, equivalent to a relatively “high degree of undercooling”. The BAM image (Fig. 2A) clearly shows the dendritic branches in the {100} sectors grow faster than in the {110} sectors. The reason for the faster growth rate is that a greater pool of crystallizable polymer chains is present in the growth front of the {100} sectors. The length of all side-branches in each {100} sector show an almost symmetric parabolic size distribution, leading to a maximum interfacial area between growing dendrites and the surrounding monolayer reservoir, which is statistically preferred to maximize the number of crystallizable PCL chains in the diffusion field.
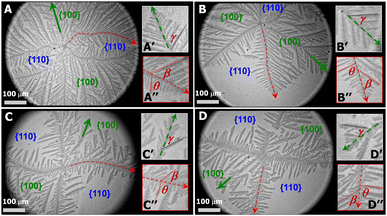
PCL dendrites grown during isobaric experiments were also transferred onto silicon substrates possessing a spin-coated polystyrene layer (1 wt% PS in toluene). The PS layer allows to see nanoscale thick dendrites under optical microscopy (OM operated at reflection mode, Axiotech Vario 100 HD, Carl Zeiss Inc.) due to an interference effect arising from differences in the optical path lengths between the PS layer and the PS layer + PCL crystal for visible light reflected from the film/air and film/substrate interfaces. Fig. 3A, a PCL dendrite grown at Π = 11 mN m−1 (correlated to Fig. 2A), clearly shows that the growth of four main dendritic trunks (highlighted by red dotted line), corresponding to the boundary lines between {100} and {110} sectors, are forced toward preferred directions. As a result, the diffusion of PCL chains from monolayers to the growth fronts of secondary side-branches in {110} sectors is even more spatially hindered. Fig. 3A′ shows the dendritic tip of a secondary side-branches in a {100} sector. Growth directions of small tertiary side-branches that develop along the secondary branches all point toward the growth front of the dendrites, with a branching angel of γ ∼ 50.2 ± 3.6 (Table 1). Fig. 3A′′ highlights the tip of one main dendritic truck (red dotted line) in Fig. 3A. The secondary side-branches grown from the main dendritic trunks exhibit the branching angles of β ∼ 50.0 ± 4.6 and θ ∼ 80.1 ± 5.9 for {100} and {110} sectors, respectively. The γ, β, and θ values measured here are comparable to those measured for PCL dendrites grown during dynamic compression.22 The PCL dendrites grown at a constant Π of 11 mN m−1 are highly branched, implying a higher level of interfacial instability. Increasing the crystallization Π leads to a smaller self-diffusion coefficient, D, and greater growth rate, G. Thus, the diffusion length, given by lD = 2D/G, decreases with increasing degrees of undercooling.6 As a consequence, the stability length also decreases, λs ∼ lD1/2, leading to the highly branched PCL dendrites.
| Π/mN m−1 | γ | β | θ |
|---|---|---|---|
| 11.0 | 50.2 ± 3.6 | 50.0 ± 4.6 | 80.1 ± 5.9 |
| 10.5 | 45.6 ± 4.8 | 45.1 ± 6.6 | 77.5 ± 5.6 |
| 10.3 | 41.7 ± 4.5 | 41.4 ± 4.6 | 92.2 ± 6.0 |
| 10.0 | 43.1 ± 7.0 | 49.7 ± 9.3 | 82.9 ± 6.2 |
At a lower Π = 10.5 mN m−1, corresponding to a lower degree of undercooling or a smaller supersaturation, the PCL dendrites demonstrate two advanced branches in two {100} sectors as seen in Fig. 2B and 3B (green arrow). These two winning branches can even escape the overlapping diffusion fields with their nearby dendritic arms. As a result, the “tertiary” side-branches developed along these two winning branches can eventually impede the growth of the side-branches grown from the main dendritic trunks as indicted by a white arrow in Fig. 2B and a green arrow in Fig. 3B. This morphological feature is very similar to that observed for a XPtBA ∼ 0.26 PCL/PtBA blend crystalized during dynamic compression,22 suggesting that decreasing Π can be comparable to increasing the composition of amorphous phase, with respect to their influence on the local diffusion field at the crystal growth fronts. In addition, the effect of PtBA component on the development of PCL dendrites in both {100} and {110} sectors was thoroughly documented in our previous dynamic compression studies.22 Further decreasing the crystallization surface pressure down to Π = 10.3 mN m−1 leads to the appearance of four-arm dendritic crystals as seen in Fig. 2C (BAM image) and Fig. 3C (OM image). The winning branches in {100} sectors, appeared in PCL dendrites grown at Π ∼ 10.5 mN m−1, are no longer present and were essentially cut-off by the secondary side-branches developed along main dendritic trunks. In this case, the secondary side-branches in the {110} sectors possess a higher probability of incorporating crystallizable material from the surrounding monolayer, thereby growing faster than at higher Π value (i.e., a higher degrees of undercooling).
At even lower crystallization Π = 10 mN m−1, four-arm dendrites were found to coexist with even more fully developed crystals as highlighted by a red circle in Fig. 2D. Side-branches developed along the four primary dendritic trunks demonstrate similar features (Fig. 3D) to those grown at Π = 10.3 mN m−1 (Fig. 3C). It is worth noting that the γ, β, and θ values measured for all PCL dendrites are indeed comparable regardless the Π values, as suggested by Table 1. The side-branching angles reported here are also comparable to those measured for compositional PCL dendrites grown during dynamic compression,22 implying that the side-branching process is controlled by the lattice structure of PCL crystal.
In contrast, randomly branched fat fingers were observed during isobaric crystallization at Π = 9.5 mN m−1 as seen in Fig. 2E and 4A. The development of side-branches in this case must be more hindered because the stability length increases with decreasing degrees of undercooling. PCL crystals grown at Π = 8.5 mN m−1 show distorted rectangular morphologies as seen in Fig. 2F and 4B.
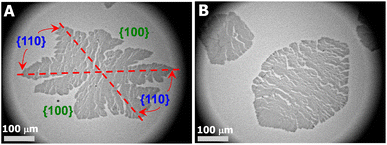 | ||
| Fig. 4 OM images of a single layer LS-film for a XPtBA ∼ 0.14 PCL/PtBA blend crystalized during an isobaric area relaxation experiment at Π ∼ (A) 9.5 and (B) 8.5 mN m−1, respectively. | ||
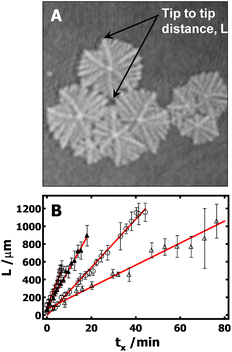
Furthermore, it is also desirable to estimate the overall growth rates from the BAM images. Unfortunately, this is not trivial, and several approximations need to be made. Crystals grown at the A/W interface are subject to flow, which means that it is impossible to keep a crystal in the BAM's field of view over the crystal's entire lifetime. In addition, nucleation does not start at the same time for all crystals, giving rise to a broad size distribution in any given BAM image. Finally, there is also a large variation of growth rate from branch to branch even in one dendritic crystal. To overcome these problems, the following procedure is used to estimate the average growth rates: (1) the tip-to-tip diagonal distance (Fig. 5A) between two main dendritic trunks grown on the sector boundary lines for a given crystal serves as the linear dimension, L. (2) Typically, more than five crystals with representative sizes in each image are measured. Crystals that were obviously much smaller or larger than average were not included. This cut-off is arbitrary; however, it is required so that measured crystals represent crystals that underwent nucleation at a similar time in each BAM image. (3) The linear dimensions were then averaged and are plotted in Fig. 5B as a function of the crystallization time. The time at which the measurable crystals first appear in the BAM field of view was considered to be the initial time, t0. The time for each BAM image used for measuring L is considered as t. The crystallization time, tx, for the crystals measured in these BAM images was then computed as tx = t − t0. While the growth rates obtained from this procedure may not be ideal, it is the best that can be done at this time to estimate the average growth rate of PCL dendrites. It is also worth to note that, based on the above-mentioned protocol, the standard deviations of these measurements largely depend on crystal selection. One must cautiously avoid overinterpret standard deviations seen in Fig. 5B. The slopes, G = dL/dtx, from the empirical linear fits of L vs. tx in Fig. 5B, yield the average crystal growth rates (G) of 45, 27, and 12 μm min−1 for crystals grown at Π = 11, 10.5, and 10.3 mN m−1, respectively. The growth is roughly linear at very early times and the growth rate clearly decreases with decreasing the Π. While it is hard to make quantitative comparisons for these growth rates because of the measurement uncertainty, these values are apparently faster than the dendritic growth of PCL crystals in spin-coated films on silicon substrates.4
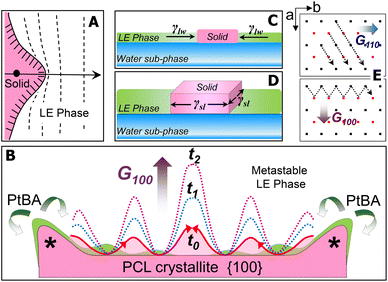
For the PCL/PtBA blend at the A/W interface, the growth of PCL crystals starts once stable nuclei form as the blend films are compressed into the supersaturated monolayer region. At the solid/liquid growth fronts of stable nuclei, the dendritic fingers initially appear as small solid protrusions, which are caused by the Mullins–Sekerka instability.23–25 Such small solid protrusions can allow the apex exposing to more PCL chains in the metastable LE phase (Fig. 6A), resulting in a locally higher growth rate of the apex (highlighted by “*” in Fig. 6B). While the growth front of the apex is competing the PCL chains in the mixed monolayer, amorphous PtBA components are rejected from the growing PCL crystallites, which occurs in the plane of flat-on lamellar. The rejected amorphous PtBA chains can then suppress the growth of solid fronts nearby the apex, leading to the initial growth direction of the four main dendritic trucks, as seen earlier in this study.
The thickness of the PCL dendrites discussed here is about 7–8 nm, while the average tip to tip distance of these dendrites is above several hundred micrometres. Thus, these PCL dendrites can be treated as quasi-two-dimensional (2D) crystals. At the A/W interface, surface tension, γlw, exerts the force at the water/LE monolayer interface to expand the surface area of LE phase and therefore decrease the surface tension of water sub-phase. For a growing quais-2D dendrite, the surface tension, γlw, also acts to minimize the expansion of crystalized solid surface from the LE phase (Fig. 6C). Thus, γlw, is inversely proportional to Π, as γlw = γ0 − Π, where γ0 (a constant at a given temperature) is the surface tension of water in the absence of a monolayer. Therefore, increasing the Π value, equivalent to decreasing γlw (i.e., the force that prevents the quasi-2D growth of the PCL dendrites), leads to a greater overall growth rate of the quasi-2D PCL crystals.
On the other hand, chain orientation in the fronts of a growing crystal is defined by the crystal's lattice structure, which shows anisotropic surface free energy and therefore the anisotropic interfacial tension. Interfacial tension, γsl, acts on the solid/LE interface ⊥ A/W interface (Fig. 6D). For the quasi-2D growth of PCL, the γsl exerts force mainly on the lateral direction at the solid/LE interface. While it is impossible to directly measure γsl, this anisotropic interfacial tension must interplay with the local diffusion field to determine the numbers, the angles, and the growth rates of side-branches in different sectors. Fig. 6E shows the projection of a–b plane in the PCL lattice and the growth directions in {110} and {100} sectors. The growth in {110} sector is spatially constrained, regardless the Π values. In contrast, the interfacial area between crystal growth front and the metastable LE phase in {100} sector is much larger than that in {110} sector. Thus, the gross morphology of PCL dendrites is primarily controlled by the dendritic grown in {100} sectors. The number and the location of the initial dendritic protrusions are determined by the interfacial instability propagated laterally on the {100} face (Fig. 6B). Increasing Π results in a smaller diffusion length in the LE phase and therefore a decreased stability length, which favours the propagation of interfacial instability, leading to highly branched PCL dendrites. Such interfacial instability is apparently very sensitive to a small change in Π. Detailed quantitative analyses are still required to establish a mathematic model by assembling all experimental factors discussed above. Nevertheless, in this study, we further demonstrate that the true monolayer formed at the A/W interface provides a simple yet significant research model for understanding sophisticated crystallization mechanism, in particular, the mechanism involved in those interesting interfacial crystallization phenomena.26–28
Conclusions
In summary, PCL crystals grown under different surface pressure demonstrate a striking morphological transition from highly branched symmetric dendrites to six-arm dendrites, four-arm dendrites, seaweed-like crystals, and distorted rectangular crystals, indicating that the degree of undercooling (i.e., Π values) plays a key role for controlling crystal morphologies through the interplay of the diffusion coefficient, surface tension, and surface tension anisotropy. The overall growth rate of these quasi-2D dendrites was also found to increase with increasing Π, i.e., decreasing γlw that acts to prevent expanding of PCL dendrites. The gross morphology of PCL dendrites was primarily controlled by the number, the location, and the growth rates of dendritic fingers developed on the {100} face. Increasing Π results in a smaller diffusion length in the LE phase and therefore a decreased stability length, which favours the propagation of interfacial instability, leading to highly branched PCL dendrites. In addition, the noise level (compositional fluctuations) varies with crystallization Π and the blend composition, which can be considered as another effective parameter for morphological selection in the diffusion-limited growth regime. Such striking morphological transition of PCL dendrites has not been previously reported. Future work focusing on surface pressure Π – modulated morphological transition of PCL crystals in other PCL-based blends and PCL-based block copolymers will further shed light on the molecular-level impact of Π and composition on the development of PCL semicrystalline morphologies.Conflicts of interest
There are no conflicts to declare.Acknowledgements
The authors would like to thank National Science Foundation (CHE-0239633) for financial support.References
- G. Reiter and J.-U. Sommer, Phys. Rev. Lett., 1998, 80, 3771 CrossRef CAS.
- G. Reiter and J.-U. Sommer, J. Chem. Phys., 2000, 112, 4376 CrossRef CAS.
- J.-U. Sommer and G. Reiter, J. Chem. Phys., 2000, 112, 4384 CrossRef CAS.
- G. Zhang, Y. Can, L. Jin, P. Zheng, R. M. Van Horn, B. Lotz, S. Z. D. Cheng and W. Wang, Polymer, 2011, 52, 1133 CrossRef CAS.
- G. Zhang, L. Jin, Z. Ma, X. Zhai, M. Yang, P. Zheng, W. Wang and G. Wegner, J. Chem. Phys., 2008, 129, 224708 CrossRef PubMed.
- K. Taguchi, H. Miyaji, K. Izumi, A. Hoshino, Y. Miyamoto and R. Kokawa, Polymer, 2001, 42, 7443 CrossRef CAS.
- V. Ferreiro, J. F. Douglas, E. J. Amis and A. Karim, Macromol. Symp., 2001, 167, 73 CrossRef CAS.
- V. Ferreiro, J. F. Douglas, J. A. Warren and A. Karim, Phys. Rev. E, 2002, 65, 042802 CrossRef PubMed.
- B. Okerberg, H. Marand and J. F. Douglas, Polymer, 2008, 49, 579 CrossRef CAS.
- B. Okerberg and H. Marand, J. Mater. Sci., 2007, 42, 4521 CrossRef CAS.
- Y. Kikkawa, H. Abe, T. Iwata, Y. Inoue and Y. Doi, Biomacromolecules, 2001, 2, 940 CrossRef CAS PubMed.
- S. Huang, S. Jiang, X. Chen and L. An, Langmuir, 2009, 25, 13125 CrossRef CAS PubMed.
- X. Wang and R. E. Prud'homme, Macromolecules, 2014, 47, 668 CrossRef CAS.
- V. H. Mareau and R. E. Prud'homme, Macromolecules, 2005, 38, 398 CrossRef CAS.
- B. Li and A. R. Esker, Langmuir, 2007, 23, 574 CrossRef CAS PubMed.
- J. Yuan and M. Liu, J. Am. Chem. Soc., 2003, 125(17), 5051 CrossRef CAS PubMed.
- M. Liu, L. Zhang and T. Wang, Chem. Rev., 2015, 115(15), 7304 CrossRef CAS PubMed.
- X. Huang, C. Li, S. Jiang, X. Wang, B. Zhang and M. Liu, J. Am. Chem. Soc., 2004, 126(5), 1322 CrossRef CAS PubMed.
- A. Das, S. Noack, H. Schlaad, G. Reiter and R. Reiter, Langmuir, 2020, 36(28), 8184 CrossRef CAS PubMed.
- B. Li, Y. Wu, M. Liu and A. R. Esker, Langmuir, 2006, 22, 4902 CrossRef CAS PubMed.
- B. Li and A. R. Esker, Langmuir, 2007, 23, 2546 CrossRef CAS PubMed.
- B. Li, H. Marand and A. R. Esker, J. Polym. Sci., Part B: Polym. Phys., 2007, 45, 3200 CrossRef.
- W. W. Mullins and R. F. Sekerka, J. Appl. Phys., 1963, 34, 323 CrossRef CAS.
- W. W. Mullins and R. F. Sekerka, J. Appl. Phys., 1964, 35, 444 CrossRef.
- J. S. Langer, Rev. Mod. Phys., 1980, 52, 1 CrossRef CAS.
- H. Qi, W. Wang and C. Y. Li, ACS Macro Lett., 2014, 3, 675 CrossRef CAS PubMed.
- H. Qi, W. Wang and C. Y. Li, ACS Macro Lett., 2014, 3, 175 CrossRef PubMed.
- W. Wang, Z. Huang, E. D. Laird, S. Wang and C. Y. Li, Polymer, 2015, 59, 1 CrossRef CAS.
Footnote |
| † Electronic supplementary information (ESI) available. See DOI: https://doi.org/10.1039/d4lf00073k |
| This journal is © The Royal Society of Chemistry 2024 |

