 Open Access Article
Bile-salt templated green fluorescent copper nanoclusters: detection of 4-nitrophenol in nanomolar range†
Shivangi
a,
Mandeep
Kaur
 a,
Neeraj
Sohal
ab,
Mallika
Phull
 a and
Banibrata
Maity
 *a
*a
aDepartment of Chemistry and Biochemistry, Thapar Institute of Engineering and Technology, Patiala 147004, India. E-mail: sshivangi_msc21@thapar.edu; mkaur3_phd19@thapar.edu; neeraj.30716@lpu.co.in; phullmallika6@gmail.com; banibrata.maity@thapar.edu
bDepartment of Chemistry, Lovely Professional University, Phagwara, 144411, India
First published on 20th May 2024
Abstract
Owing to severe environmental contamination, the detection of hazardous nitro-aromatic chemicals has emerged as a potential research subject in the contemporary context. Nanomaterials are widely used in cutting-edge assays for the selective and sensitive detection of a wide range of analytes. Nanoclusters (NCs) are a novel emerging type of nanomaterials in terms of their outstanding stability and ease of fabrication. Herein, two different types of green emissive copper nanoclusters (CuNCs) were synthesized using sodium cholate (NaC) and sodium taurocholate (NaTC) as bile salts, which act as templating agents and hydrazine hydrate as a reducing agent in ambient conditions. The as-prepared CuNCs exhibited highly fluorescent, outstanding solubility in an aqueous medium and significant Stokes shift. The particle size of both CuNCs (NaC@CuNCs and NaTC@CuNCs) was examined using high-resolution transmission electron microscopy (HRTEM) analysis, which confirms their size within the 2.2–2.7 nm range. The surface functionality and chemical compositions of both CuNCs were determined using X-ray photoelectron spectroscopy (XPS) and Fourier transform infrared (FTIR) spectroscopy. The prepared CuNCs showed good pH stability and ionic stability. Both nanoprobes have high sensitivity and selectivity for the determination of 4-NP. The values of quantum yield and average lifetime have been evaluated to confirm the inner filter effect (IFE) quenching mechanism. Based on this, simple and accurate turn-off fluorescent nanoprobes, NaC@CuNCs and NaTC@CuNCs were created to detect 4-NP with a detection limit of 47.1 nM and 58.4 nM, respectively. Real sample analyses were performed to assess the viability of the detection technique, revealing good recovery rates and relative standard deviations towards the proposed probes. Therefore, the developed nanoprobe may be applied for on-site and fast detection of 4-NP.
1. Introduction
Nitrophenols are prevalent environmental contaminants and significant byproducts in the production of essential pharmaceuticals, dyes, and insecticides. The popular drug paracetamol (N-acetyl-4-aminophenol) is made using 4-nitrophenol (4-NP), which also serves as a breakdown product and chemical precursor in the synthesis of organophosphorus pesticide derivatives called parathion.1 4-NP not only causes severe damage to the kidney, liver, and central nervous system but also contaminates blood more thoroughly and degrades slowly in the environment. 4-NP is released into the environment as a waste product from several industrial sources and is found in groundwater,1 river water,1,2 wastewater,1 sewage effluent sludge,3 and soil.4 It can also be found in fog, rain, and suspended particulate matter in the atmosphere as a result of automobile exhaust gas emissions.1 The effects of 4-NP on mammals, including cancer,5 mutagenesis6–9 and cytotoxicity,7 are well documented. The fatal dosage of 4-NP for mammals is 247 mg kg−1 orally and >900 mg kg−1 topically.10 As a result, there is a clear need for accurate and efficient techniques to calculate 4-NP.Several methods have been proposed for identifying nitrophenols in environmental samples. For the time being, a variety of techniques, including chromatographic,11,12 electrochemical,13,14 chemiluminescence15 and fluorescence detection16,17 have been used for the measurement of 4-NP in water. Fluorescence detection is the most widely used approach because of its low cost, fast system, sensitivity, and simplicity. All other methods are expensive, time-consuming, and require trained operators. Many fluorescent sensing platforms based on nanomaterials such as nanoparticles (NPs), quantum dots (QDs), nanoclusters (NCs), and nanocomposites have been developed in recent decades for sensing pollutants,18 metal ions,19 biomolecules,20 and other analytical detections.21–27 Nanomaterials serve as highly efficient fluorescent sensors, showcasing their effectiveness in detecting various substances or conditions. Recent years have seen a rise in the popularity of nanoclusters among the several types of nanomaterials because of their distinctive optical, electrical, magnetic, and reactivity capabilities as well as other unique qualities that fall in between those of bulk and single-particle species.28 Nanoclusters are monodispersed particles with an average diameter of less than 10 nm, having cluster core less than 2 nm. These clusters are then stabilized by surrounding protective groups, which may increase their overall size.28
Metal nanoclusters (MNCs) are a subclass of nanoclusters, having sizes nearing the fermi wavelength of electrons and exhibiting remarkable molecular-like properties. MNCs are consequently believed to function as a bridge between molecules and nanoparticles because of the discrete electronic transition that results from the quantum confinement of free electrons.29 Research in the realm of MNCs has become increasingly prominent owing to their minute size, remarkable ability to interact favorably with biological systems, enduring stability, exceptional catalytic prowess, as well as their distinctive optical and electrochemical attributes.30 NCs made up of transition metals exhibit outstanding photoluminescence and extraordinary photostability due to their favorable valence orbital overlap and extended d-orbitals. Transition MNCs (Au, Pd, and Ag NCs)30–34 have achieved substantial research gains over the past few years because of their exact designs and improved physical properties.
The stability of MNCs hinges significantly on the interplay among factors such as the atom count, valence electron configuration, and the quantity and nature of surrounding ligands. MNCs were synthesized using various biomolecules as encapsulating ligands. Wu et al. developed a fluorescent approach with a 1.5 ng mL−1 detection limit for trypsin measurement via the strong electrostatic interactions between cationic polyelectrolytes and single-stranded DNA (ssDNA) templated Au nanoclusters (AuNCs). Furthermore, successfully applied it to find trypsin content in human serum samples.35 Zhang et al. created a novel fluorescent sensing strategy for the detection of alkaline phosphatase activity (ALP) using highly luminescent glutathione-stabilized copper nanoclusters (GSH-CuNCs) as a fluorescent probe with a detection limit of 0.02 mU mL−1. ALP was also evaluated in a real sample to evaluate the detection strategy's feasibility.36 Wu et al. created a simple, quick, and sensitive fluorescence sensor for detecting tetracycline (TC) employing adenine thymine (AT)-rich single-stranded DNA (ssDNA) templated copper nanoclusters (CuNCs) as a fluorescent probe with a limit of detection as low as 0.5 nM. In addition, the sensor was effectively used to detect TC in milk samples.37 Self-assembling copper nanoclusters (CuNCs) were created by Wang et al., which substantially enhanced the fluorescence emission intensity of tetracycline (TC). With a 40 nM detection limit, the test allows for the highly sensitive detection of TC. Additionally, the method is used to find the concentration of TC in urine and milk samples.38 Based on the L-histidine–DNA interaction, Wang et al. created an efficient fluorescent approach to enhance the fluorescence emission of poly (A) DNA-templated AuNCs. The suggested method has been used to find drugs in pharmacy samples with imidazole.39 Except for all these biomolecules, compounds of biological origin, such as bile salts, have also been used to synthesize stable metal nanoparticles.40,41 The development of copper nanoclusters has been challenging given the ease of oxidation of Cu compared to Ag and Au. The synthesis of CuNCs includes different reaction conditions (such as temperature, solvent, and pH) and different biomolecules like amino acids, peptides, DNA, and proteins, which act as surface encapsulating ligands.42 Xie et al., in 2009, described a straightforward and environmentally friendly method for synthesizing gold nanoclusters (Au25NCs) by utilizing bovine serum albumin (BSA) as a capping agent. This technique produces highly stable red-emissive nanoclusters with a high quantum yield.43 Later, Chandirasekar et al. introduced bile salts as a capping ligand for the synthesis of AuNPs for calorimetric detection of DNA.40
Bile salts (BSs) are naturally occurring, biological surfactants that differ from conventional surfactants in their interface and self-assembly properties. The interior of bile salt micelles is more complicated than the micelles formed by conventional surfactants.40 As a result, the mode of interaction is also different. Sodium salts of cholic, deoxycholic, and taurocholic acids are becoming increasingly popular bile salts. Sodium cholate (NaC) (C24H39NaO5) is a tri-hydroxy bile salt with a CMC value of 9–15 mM and used as a digestive aid in dietary supplements. Sodium taurocholate (NaTC) (C26H44NNaO7S) is a major component in predatory animal bile, having a CMC value of 3–9 mM.40 Chandirasekar et al. reported a unique method for synthesizing gold nanoparticles (AuNPs) at room temperature employing naturally occurring bile salts, sodium cholate (NaC) and sodium deoxycholate (NaDC) as reducing and capping agents.40 Muthuramalingam et al. developed sodium deoxycholate-capped silver nanoparticles and discovered that continuous light exposure of NaDC-capped AgNPs in close proximity to plant tissues resulted in the slow dissolution of silver ions and the capping agent.41 Mandal et al. synthesized silver nanoparticles (AgNPs) in situ in micelles made of the bile salt, sodium deoxycholate (NaDC). It is an initial report on using metal nanoparticles in the disruption of components of gall stones/pigment stones, and hence, the work has significant physiological significance.44 Yang et al. developed nanostructured lipid carriers (NLCs) comprising a bile salt formulation (sodium glycocholate, SGC) for gypenosides (GPS) and assessed the GPS-SGC-NLCs' potential as an oral delivery system.45
Nitroaromatics pose hazardous environmental and biological effects. Therefore, Chauhan et al. synthesized red-emitting BSA-stabilized copper nanoclusters that were used to detect vitamin B6 cofactors and nitroaromatics via energy and electron transfer mechanisms.46 Wang et al. deployed glutathione-stabilized copper nanoclusters for the selective and sensitive detection of p-nitrophenol and alkaline phosphatase activity using the inner filter effect.47 As a result, the development of simple, quick, and user-friendly methods of preparation of fluorescent Cu NCs is still required.
Herein, we have reported the bottom-up synthesis of NaC and NaTC encapsulated CuNCs, where bile salts act as a template and hydrazine hydrate as a reducing agent. CuNCs exhibit outstanding water solubility and reveal intense green fluorescence. The as-prepared nanoprobe shows excellent selectivity and sensitivity towards 4-NP with a limit of detection as low as in the nanomolar range. The fluorescence quenching of CuNCs on the addition of 4-NP could be attributed to the inner filter effect. We believe that this was the first study to establish a simple and fast fluorescent technique based on bile salt-encapsulated CuNCs for the detection of 4-NP. The simplicity and low-cost synthesis have improved its potential for future production and usefulness.
2. Experimental section
2.1 Materials and reagents
NaC (98%), NaTC (for bacteriology), copper(II) nitrate trihydrate and hydrazine hydrate (80%), 4-NP, 3-NP, 2-NP, picric acid (PA), potassium chloride (KCl), nickel(II) chloride hexahydrate (NiCl2·6H2O), barium chloride dihydrate (BaCl2·2H2O), mercuric chloride (HgCl2), magnesium chloride hexahydrate (MgCl2·6H2O), ferric chloride hexahydrate (FeCl3·6H2O), manganese(II) chloride tetrahydrate (MnCl2·3H2O), cobalt chloride hexahydrate (CoCl2·6H2O), ferrous chloride (FeCl2), lead nitrate [Pb(NO3)2], sodium hydroxide pellets (NaOH), sodium chloride (NaCl), glutathione, hydrochloric acid (HCl), quinine sulphate, glucose and tetracycline (TCH) were bought from Loba Chemie, India, and used as received without any further purification. Cysteine, methionine, tryptophan, arginine, isoleucine, tyrosine, lysine, asparagine, glutamic acid, and threonine were bought from Sigma Aldrich and used as received without any additional purification. Ultrapure deionized (DI) water was used for preparing all stock solutions.2.2 Instrumentation
CuNCs particle size and shape analysis were performed using a Tecnai G2 F20 high-resolution transmission electron microscope (HRTEM, FEI). The PHI 500 Versa Probe III (Physical Electronics) X-ray photoelectron spectroscopy (XPS) was used to examine the chemical composition and oxidation state of Cu NCs. The existence of different functional groups on the surface of CuNCs was elucidated through Fourier transform infrared spectroscopy (FTIR) using IRTracer-100 (Shimadzu). Fluorescence and ultraviolet-visible (UV-vis) spectra were examined using an RF-6000 fluorescence spectrophotometer (Shimadzu) and a UV-vis spectrophotometer (Shimadzu), respectively. The lifetimes of CuNCs were investigated using DeltaFlex modular fluorescence life-time spectrofluorimeter (HORIBA Scientific). The Bruker, QUANTAX 200 energy-dispersive X-ray spectroscopy (EDS) was used to determine the elements present in bile salt-encapsulated CuNCs.2.3 Preparation of CuNCs
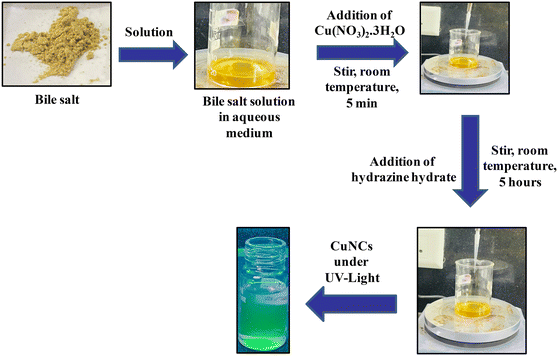
As shown in Scheme 1 for synthesizing CuNCs, bile salt solutions were prepared at room temperature by dissolving NaTC (64 mg, 10 mM) and NaC (93 mg, 18 mM) in separate beakers containing 12 ml of water each. Then, 40 μL of 0.1 M Cu(NO3)2·3H2O solution was added to both the beakers and the solutions were mixed by stirring for 5 minutes. Next, 40 μL of hydrazine hydrate was added to both the mixtures and the stirring was continued for 5 hours. Finally, the light brown solutions of CuNCs were stored in the refrigerator for further studies.2.4 Optimizing reaction time
The photoluminescence (PL) intensity of CuNCs was largely affected by stirring time. In accordance with this, CuNCs were synthesized by changing the stirring time from 2.5 to 15 hours. It was found that both NaC@CuNCs and NaTC@CuNCs, synthesized with a stirring time of 5 hours showed the maximum PL emission. The PL emission of NaC@CuNCs and NaTC@CuNCs on varying reaction times is depicted in Fig. S1a and b,† respectively.2.5 Method for the preparation of metal ion solutions for selectivity of the prepared sensing platform
1 mM of stock solutions of various metal ions like K+, Mn2+, Pb2+, Ni2+, Fe3+, Fe2+, Hg2+, Co2+, Ba2+, and Mg2+ was prepared by the addition of relevant quantities of metal salts to deionized water. Then, 200 μL of each metal ion solution was transferred separately to 2 ml solution of NaC@CuNCs and NaTC@CuNCs in a cuvette. Further, the PL spectra of various aliquots were recorded after proper mixing through retro-pipetting at room temperature to check the effect of the PL intensity of both NaC@CuNCs and NaTC@CuNCs in the presence of metal ions.2.6 Method for the preparation of biomolecule solutions for selectivity of the prepared sensing platform
1 mM of stock solutions of various biomolecules like glutathione, cysteine, glucose, methionine, tryptophan, arginine, isoleucine, tyrosine, lysine, asparagine, glutamic acid, threonine, 2-NP, 3-NP, PA and tetracycline were prepared in Milli-Q water. After that, 200 μl of each biomolecule solution was added separately to the system containing 2 ml solution of NaC@CuNCs and NaTC@CuNCs in a cuvette to check the effect of the PL intensity of both NaC@CuNCs and NaTC@CuNCs in the presence of the biomolecules.2.7 Methodology for 4-NP detection using CuNCs as a fluorescent sensor
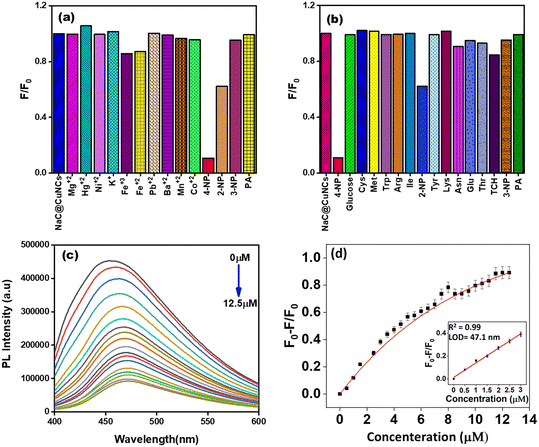
4-NP solution ranging from 5 μM to 125 μM was added into the cuvette containing 2 ml of CuNCs solution. After that, the fluorescent intensities of both NaC@CuNCs and NaTC@CuNCs systems were measured at room temperature using an excitation wavelength of 380 nm. To study the selectivity of CuNCs as a fluorescent nanosensor for 4-NP detection, the PL intensities of both CuNCs with various controls, such as metals and biomolecules, were measured.2.8 Real sample analysis
The experiment was carried out to check the applicability of the prepared sensing material with a real water sample (lake water). The water samples were collected from Patiala, Punjab, India. After spiking the real water sample with different concentrations of 4-NP, the solution of both the NaC@CuNCs and NaTC@CuNCs were added separately to these concentrations, and PL measurements were recorded at a wavelength of 380 nm.2.9 Quantum yield calculations
The quantum yield (QY) value of CuNCs was examined by using the following equation | (1) |
3. Result and discussion
3.1 Characterization
TEM analysis was performed to study the morphology of CuNCs. The average diameter of the as-synthesized NaC@CuNCs was found to be 2.2 nm. Fig. 1(a) and (b) depict the TEM image and histogram plot of the NaC@CuNCs, respectively. For NaTC@CuNCs, the size was found to be 2.7 nm. Fig. 1(c) and (d) depict the TEM image and histogram plot of NaTC@CuNCs, respectively.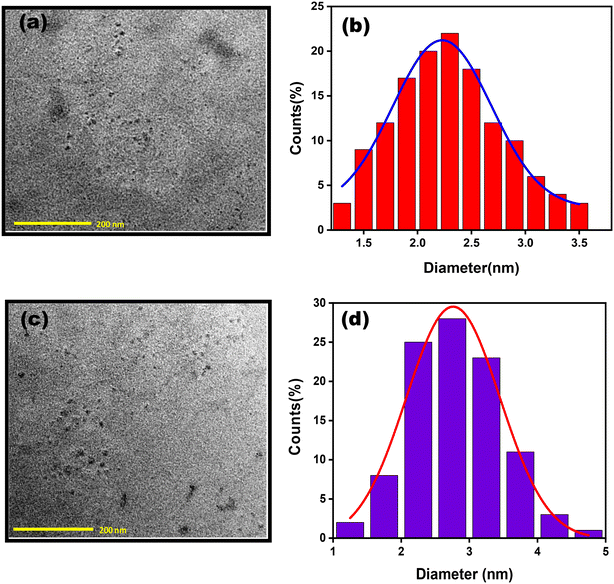 | ||
| Fig. 1 (a) TEM image of NaC@CuNCs, (b) histogram plot of NaC@CuNCs, (c) TEM image of NaTC@CuNCs and (d) histogram plot of NaTC@CuNCs. | ||
The elemental composition of prepared NaC@CuNCs and NaTC@CuNCs can be investigated by EDS. The EDS spectra of NaC@CuNCs and NaTC@CuNCs (Fig. S2a and b†), respectively, show the presence of carbon (C), sodium (Na), copper (Cu) and oxygen (O) in NaC@CuNCs, whereas C, Cu, Na, O, sulphur (S) and nitrogen (N) in NaTC@CuNCs as major elements. The atomic percentage and weight percentage of each element are displayed in the inset table (Fig. S2a and b†).
The elemental compositions of the synthesized CuNCs were determined by XPS analysis. Fig. 2(a) shows the survey spectra of NaC@CuNCs in which four distinct peaks were obtained at around 285 eV, 531 eV, 932 eV and 952 eV, which unveil the presence of C 1s, O 1s, Cu 2p3/2 and Cu 2p1/2, respectively.48 On deconvolution, two peaks with binding energies of 284.8 eV and 288.3 eV in the deconvoluted spectra of C 1s, as displayed in Fig. 2(b), are attributed to C–C and O–C![[double bond, length as m-dash]](https://www.rsc.org/images/entities/char_e001.gif) O, respectively.48,49 The deconvoluted spectra of O 1s, as seen in Fig. 2(c), show two peaks with binding energies of 531.2 eV and 535.6 eV, which reveal that oxygen may exist in the form of C
O, respectively.48,49 The deconvoluted spectra of O 1s, as seen in Fig. 2(c), show two peaks with binding energies of 531.2 eV and 535.6 eV, which reveal that oxygen may exist in the form of C![[double bond, length as m-dash]](https://www.rsc.org/images/entities/char_e001.gif) O and C–OH, respectively.48 The two peaks with binding energies 932.7 eV and 952.1 eV in the deconvoluted spectra of Cu2p, as displayed in Fig. 2(d), stand for Cu 2p3/2 and Cu 2p1/2. Additionally, we did not find any peak around 942 eV, which reveals that Cu2+ was reduced to C0 and Cu+.48
O and C–OH, respectively.48 The two peaks with binding energies 932.7 eV and 952.1 eV in the deconvoluted spectra of Cu2p, as displayed in Fig. 2(d), stand for Cu 2p3/2 and Cu 2p1/2. Additionally, we did not find any peak around 942 eV, which reveals that Cu2+ was reduced to C0 and Cu+.48
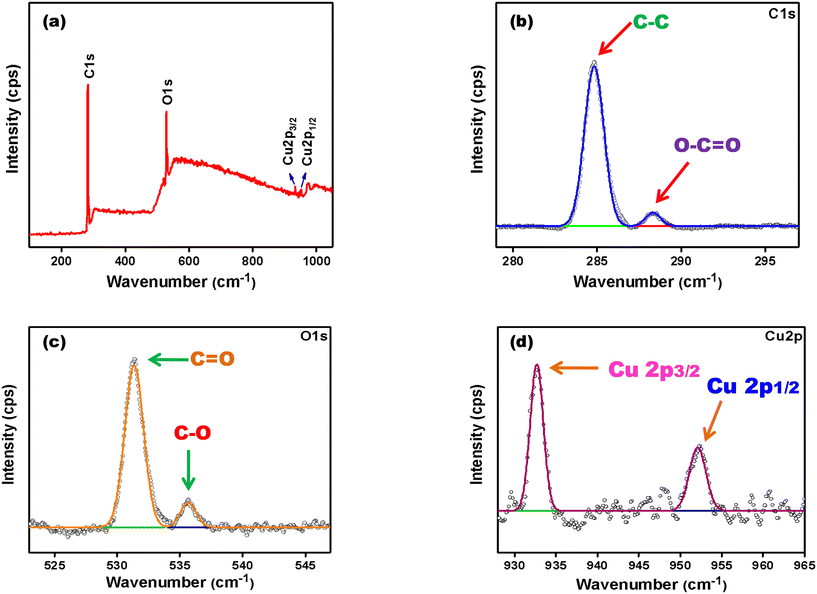 | ||
| Fig. 2 (a) XPS survey spectra of NaC@CuNCs; (b) deconvoluted XPS spectra of C 1s; (c) deconvoluted XPS spectra of O 1s; (d) deconvoluted XPS spectra of Cu2p. | ||
In the survey spectra of NaTC@CuNCs (Fig. S3†), six distinct peaks were obtained at 285 eV, 531 eV, 399 eV, 168 eV, 932 eV and 952 eV, which unveil the presence of C 1s, O 1s, N 1s, S 2p, Cu 2p3/2 and Cu 2p1/2, respectively.48,49 The deconvoluted spectra of C 1s (Fig. S3(c)†) show two peaks with binding energies of 284.6 eV and 286.7 eV, revealing the presence of C–C and C![[double bond, length as m-dash]](https://www.rsc.org/images/entities/char_e001.gif) O, respectively.48 Two peaks with binding energies of 531.3 eV and 535.8 eV in the deconvoluted spectra of O 1s (Fig. S3(d)†) are attributed to C
O, respectively.48 Two peaks with binding energies of 531.3 eV and 535.8 eV in the deconvoluted spectra of O 1s (Fig. S3(d)†) are attributed to C![[double bond, length as m-dash]](https://www.rsc.org/images/entities/char_e001.gif) O and C–O, respectively.49,50 Two peaks with binding energies 932.6 eV and 952.7 eV in the deconvoluted spectra of Cu 2p (Fig. S3(b)†) stand for Cu 2p3/2 and Cu 2p1/2, respectively.48 On deconvoluting the XPS spectra of S2p (Fig. S3(e)†), four different energy states at 161.0 eV, 164.5 eV, 167.9 eV, 169.1 eV are obtained, corresponding to C–S–C 2p3/2, C–S–C 2p1/2, –SO2/–SO3 2p3/2, –SO2/–SO3 2p1/2.49,50 Additionally, we did not find any peak around 942 eV, revealing that Cu2+ was reduced to C0 and Cu+.48
O and C–O, respectively.49,50 Two peaks with binding energies 932.6 eV and 952.7 eV in the deconvoluted spectra of Cu 2p (Fig. S3(b)†) stand for Cu 2p3/2 and Cu 2p1/2, respectively.48 On deconvoluting the XPS spectra of S2p (Fig. S3(e)†), four different energy states at 161.0 eV, 164.5 eV, 167.9 eV, 169.1 eV are obtained, corresponding to C–S–C 2p3/2, C–S–C 2p1/2, –SO2/–SO3 2p3/2, –SO2/–SO3 2p1/2.49,50 Additionally, we did not find any peak around 942 eV, revealing that Cu2+ was reduced to C0 and Cu+.48
FTIR analysis verified the existence of several functional groups on the surface of CuNCs. In the case of NaC@CuNCs (Fig. S4(a)†), the peaks at 3305 cm−1, 2925 cm−1, 2853 cm−1, 1546 cm−1, 1392 cm−1 and 1048 cm−1 represent O–H stretching, C–H stretching, N–H stretching, C![[double bond, length as m-dash]](https://www.rsc.org/images/entities/char_e001.gif) O stretching, O–H bending, and C–O stretching, respectively,52 whereas in the case of NaTC@CuNCs (Fig. S4 (b)†), the peaks at 3277 cm−1, 2925 cm−1, 2857 cm−1, 1551 cm−1, 1389 cm−1 and 1027 cm−1 correspond to O–H stretching, C–H stretching, N–H stretching, C
O stretching, O–H bending, and C–O stretching, respectively,52 whereas in the case of NaTC@CuNCs (Fig. S4 (b)†), the peaks at 3277 cm−1, 2925 cm−1, 2857 cm−1, 1551 cm−1, 1389 cm−1 and 1027 cm−1 correspond to O–H stretching, C–H stretching, N–H stretching, C![[double bond, length as m-dash]](https://www.rsc.org/images/entities/char_e001.gif) O stretching, S
O stretching, S![[double bond, length as m-dash]](https://www.rsc.org/images/entities/char_e001.gif) O stretching, and C–O stretching, respectively.51
O stretching, and C–O stretching, respectively.51
3.2 Optical properties of CuNCs
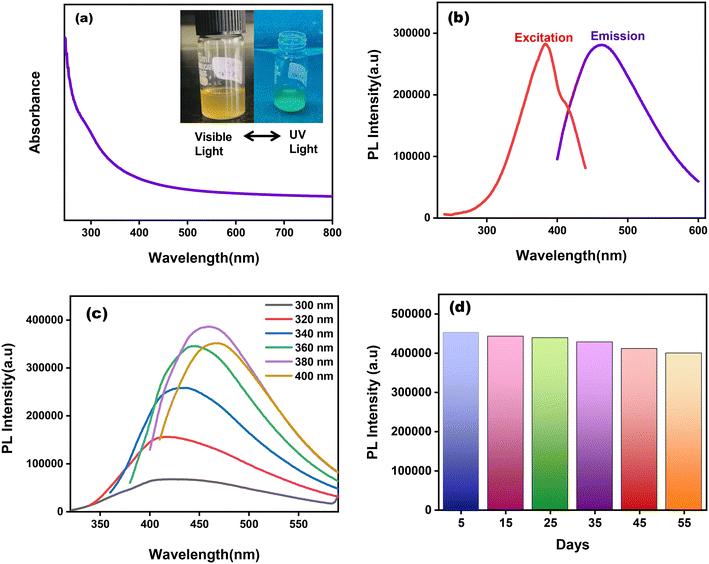
The as-prepared CuNCs were observed to be light brown in color under normal visible light but exhibit greenish fluorescence when subjected to UV irradiation (inset of Fig. 3(a) and S5(a)†). NaC@CuNCs has stepped absorption spectra with minor peaks emerging at 295 nm, as suggested in Fig. 3(a). NaTC@CuNCs also have step-like absorption spectra with slight peaks at 298 nm, as depicted in Fig. S5(b).† The lack of apparent peaks of CuNCs at wavelengths extending from 400 to 600 nm demonstrated the absence of big copper nanoparticles.48 The maximum excitation and emission wavelengths for NaC@CuNCs, as shown in Fig. 3(b), were found at 380 nm and 460 nm, respectively, whereas in the case of NaTC@CuNCs, it was observed at 380 nm and 450 nm, respectively Fig. S5(b)†).With varying excitation wavelengths ranging from 300 nm to 400 nm, the impact of excitation wavelength on emission wavelength was examined. These as-prepared CuNCs had an excitation-dependent behavior, where the emission wavelength did not have a constant value under various excitation wavelengths. Redshift is observed in the emission wavelength of both cases with a change in excitations from 300–400 nm. The excitation-dependent behavior of NaC@CuNCs is represented in Fig. 3(c) and that of NaTC@CuNCs is represented in Fig. S5(c),† respectively. Moreover, this behavior was connected to particle size distribution.48 The photoluminescence quantum yield (PLQY) of NaC@CuNCs and NaTC@CuNCs was calculated to be 3.72% and 2.04%, respectively, using quinine sulphate solution as reference (Φr = 0.546).42,48
The stability of the synthesized CuNCs was analyzed under different conditions. For 55 days, CuNCs were kept and fluorescence spectra were obtained at regular intervals, indicating no significant change in PL intensity of both NaC@CuNCs (Fig. 3(d)) and NaTC@CuNCs (Fig. S5(d)†). It confirms CuNCs stability. Additionally, the inherent pH was found to be 9 for both NaC@CuNCs and NaTC@CuNCs. The influence of pH on the PL intensity was examined by the addition of NaOH and HCl, thereby varying the pH of both the solutions from 3 to 13 (Fig. S6(a) and (b)†). CuNCs show maximum PL intensity at their inherent pH of 9 in both cases. It was observed that the PL intensity was found to decrease with an increase in the pH of the solution. It may be attributed to the deprotonation of distinct oxygen-containing functional moieties existing on the surface of CuNCs, which resulted in the accumulation of negative charge. As a result, the electronic transition of various emissive traps was restricted due to the occupancy of these energy levels. Similarly, with a decrease in pH, PL intensity decreases, which may be attributed to the protonation of oxygen-containing functional moieties existing on the surface of CuNCs.19 Also, the bile salt encapsulated on the surface of copper may get converted into bile acid, thus breaking the clusters, which may result in decreasing the PL intensity of CuNCs. Therefore, all further studies were carried out with their inherent pH.
It was observed that with increasing NaCl concentration from 0 μM to 37.5 μM, both CuNCs display a minor reduction in the PL intensity, which suggests that it has a strong salt tolerance power and can further be used for analytical purposes. The Fig. S6(c) and (d)† show the ionic strength of NaC@CuNCs and NaTC@CuNCs, respectively.
3.3 Detection of 4-NP
The calibration curve for NaC@CuNCs, as shown in Fig. S8(a),† was derived from the Stern–Volmer graph with the regression line equation F0/F = 4.16[4-NP] + 0.73, with the high correlation coefficient (R2 = 0.989). Similarly, the linear calibration curve for NaTC@CuNCs, as depicted in Fig. S8(b),† was derived from the Stern–Volmer graph with the regression line equation F0/F = 7.88[4-NP] + 0.35, with the high correlation coefficient (R2 = 0.984). Table 1 depicts the sensing efficacy of as-prepared NaC@CuNCs and NaTC@CuNCs for 4-NP and Table 2 highlights the higher sensitivity and lower detection limit as compared to other nanosensors reported in the literature.
| Parameters | NaC@CuNCs with 4-NP | NaTC@CuNCs with 4-NP |
|---|---|---|
| Detection range | 0–0.3 μM | 0–0.3 μM |
| Limit of detection (LOD) | 47.1 nM | 58.4 nM |
| Regression equation | 1.27143 [4-NP] + 0.01357 | 1.48832 [4-NP] + 0.02471 |
| Stern–Volmer constant (Ksv) | 4.16 μM−1 | 7.88 μM−1 |
| Sr. no. | Sensor system | Detection range | Limit of detection | Ref. |
|---|---|---|---|---|
| 1 | CDs-YVO4:Eu3+@MIPs | 0–12 μM | 0.15 μM | 55 |
| 2 | MIP-encapsulated Mn-doped ZnS QDs | 0.1–40 μM | 76 nM | 15 |
| 3 | MIP-C-dots | 0.2–50 μM | 0.06 μM | 56 |
| 4 | Molecularly imprinted core–shell CdSe@SiO2/CDs | 0.051–13.7 μM | 0.026 μM | 57 |
| 5 | Carbon nanotube film electrode | 0.14–4.86 μM | 0.012 μM | 58 |
| 6 | NaC@CuNCs | 0–12.5 μM | 47.1 nM | Current work |
| 7 | NaTC@CuNCs | 0–12.5 μM | 58.4 nM | Current work |
3.4 Plausible quenching mechanism
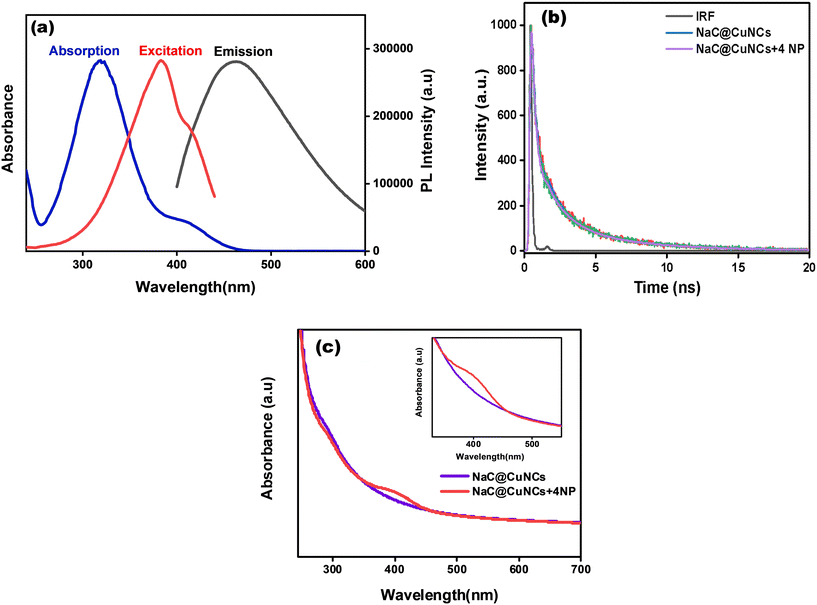
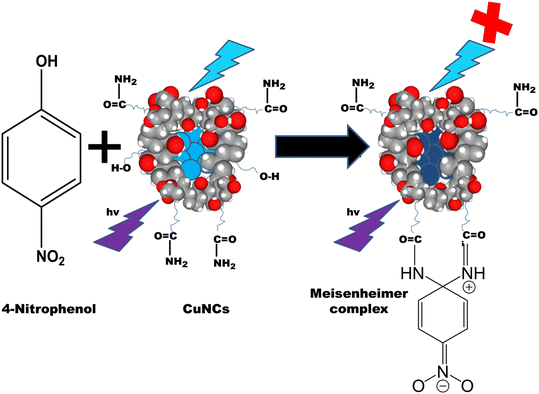
For fluorescence nanomaterials, different quenching mechanisms were reported, for e.g., static quenching, inner-filter effect (IFE), dynamic quenching and fluorescence resonance energy transfer (FRET). According to Fig. 5(a) and Fig. S9(a),† the fluorescence excitation peak of NaC@CuNCs and NaTC@CuNCs, respectively, and the UV-vis absorption peak of 4-NP overlapped. According to this spectrum overlap phenomenon, 4-NP occupied the excitation energy of CuNCs. Therefore, it is assumed that the sensing mechanism could be the IFE and FRET.52 For FRET to occur, the excited state energy transfer of the probes was responsible for the fluorescence reduction and decrease in fluorescence lifetime.54 Fluorescence quenching could occur with IFE, with the lifetime essentially unaffected.52–55 The fluorescence mean lifetime values of NaC@CuNCs and NaTC@CuNCs remain unaltered in the presence of 4-NP, as shown in Fig. 5(b) and S9(b),† respectively, which clearly exclude the FRET mechanism. The lifetime of NaC@CuNCs was 0.95 ns, and the lifetime of NaC@CuNCs with 4-NP was found to be 0.86 ns (Table S1†). Similarly, for NaTC@CuNCs, the lifetime was found to be 0.68 ns, and the lifetime of NaTC@CuNCs with 4-NP was 0.70 ns. There is no significant change in the lifetime, which suggests that IFE will be the preferred quenching mechanism. Besides this, the dilution effect was observed on both the probes [NaC@CuNCs + 4-NP] and [NaTC@CuNCs + 4-NP] comprising 40 μL of 4-NP in aqueous mixture. To the quenched systems, water was gradually added in increments of 100 μL and as dilution proceeded, fluorescence levels exhibited a consistent increase, directly supporting the IFE phenomenon, as shown in Fig. S10.†Moreover, the UV-vis spectra of NaC@CuNCs and NaC@CuNCs after adding 4-NP are analyzed and it is found that a characteristic shoulder band appeared in the latter one, which particularly shows the emergence of a certain complex in the ground state that further proves the IFE mechanism. A similar trend is seen in NaTC@CuNCs and NaTC@CuNCs after adding 4-NP. Fig. 5(c) and S9(c)† depict this trend. Besides this, the dilution effect was observed on both the probes [NaC@CuNCs + 4-NP] and [NaTC@CuNCs + 4-NP] comprising 40 μL of 4-NP in aqueous mixture, shown in Fig. S10.† To the quenched systems, water was gradually added in increments of 100 μL and as dilution proceeded, fluorescence levels exhibited a consistent increase, directly supporting the phenomenon IFE. Additionally, the formation of the zwitterionic spiro cyclic Meisenheimer complex can also be the major reason behind the quenching of CuNCs, as depicted in Scheme 2. In this case, the negative charge is held by the nitro group and the cyclohexadiene ring, and the positive charge is held by the iminium group. When 4-NP is added, the energy transfer caused by the charge localization might significantly reduce the fluorescence of CuNCs.53,54
3.5 Analysis of real sample
Table 3 depicts the feasibility and usefulness of as-prepared CuNCs towards sensing of 4-NP in lake water. The results indicated a high recovery rate and a low relative standard deviation (% RSD). The observed values had acceptable precision levels, authenticating that the as-prepared CuNCs can prove to be eminent for sensing 4-NP in real water samples.| System of detection | Amount of 4-NP added (μM) | Amount of 4-NP detected (μM) | Recovery rate (%) | RSD (%) |
|---|---|---|---|---|
| NaC@CuNCs | 0.1 | 0.098 | 98.00 | 1.65 |
| 0.25 | 0.257 | 102.80 | 1.87 | |
| 0.5 | 0.492 | 98.40 | 1.40 | |
| NaTC@CuNCs | 0.1 | 0.103 | 103.00 | 1.36 |
| 0.25 | 0.244 | 97.60 | 1.78 | |
| 0.5 | 0.493 | 98.60 | 1.66 |
4. Conclusion
In the current study, we offer a straightforward, low-cost, environmentally friendly method for synthesizing bile salt-encapsulated CuNCs (NaC@CuNCs and NaTC@CuNCs) that are useful for 4-NP detection. Cu (NO3)2·3H2O and either NaC or NaTC can be used as precursors to generate these CuNCs at room temperature. When exposed to UV light, these CuNCs exhibit a greenish fluorescence. By using HRTEM, the size of both CuNCs is verified. The average diameter of NaC@CuNCs is 2.2 nm, while the average diameter of NaTC@CuNCs was determined to be 2.7 nm. While EDS confirmed the elemental components present in both CuNCs, FTIR and XPS results validated the surface functionalization. Both of the produced CuNCs exhibited strong ionic strength and good pH stability. According to the particle size distribution, these as-prepared CuNCs exhibited excitation-dependent behavior with an emission spanning from 300 to 400 nm. CuNCs encapsulated with bile salt reacted well with 4-NP. The PL intensity of both CuNCs progressively drops as the concentration of 4-NP rises. The lifespan study, UV-vis graph of CuNCs, CuNCs + 4-NP, and spectral overlap between the excitation of CuNCs and absorbance of 4-NP all support the idea that IFE is the quenching mechanism. For NaC@CuNCs and NaTC@CuNCs, the LOD values were 47.1 nM and 58.4 nM, correspondingly. The formation of the zwitterionic spiro cyclic Meisenheimer complex is the only thing that can make this occur. Therefore, utilizing this recently discovered CuNCs-based fluorescence approach provides an easy and quick way to identify 4-NP. This approach has a great deal of potential for detecting 4-NP in other sectors and real samples as well. The synthesis is more promising for future production due to its ease of use and cost-effectiveness.Conflicts of interest
The authors declare that there are no interpersonal or financial conflicts that could have affected this study.Acknowledgements
The authors are thankful to Thapar Institute of Engineering and Technology, Patiala, for the infrastructural facilities. We gratefully acknowledge financial assistance from the Science and Engineering Research Board (SERB) for the SRG grant to B. M. (SRG/2022/000942) as well as TIET, Patiala for seed money grant to B. M. The authors acknowledge Prof. Vijay Luxami, SCBC, TIET, Patiala, for her kind permission to use the TCSPC instrument.References
- C. Nistor, A. Oubiña, M.-P. Marco, D. Barceló and J. Emnéus, Anal. Chim. Acta, 2001, 426, 185–195, DOI:10.1016/S0003-2670(00)00825-4.
- J. Long, W. House, A. Parker and J. Rae, Sci. Total Environ., 1998, 210–211, 229–253, DOI:10.1016/S0048-9697(98)00015-1.
- M. Webber and S. Lesage, Waste Manage. Res., 1989, 7, 63–82, DOI:10.1016/0734-242X(89)90009-8.
- M. D. Webber and C. Wang, Can. J. Soil Sci., 1995, 75, 513–524, DOI:10.4141/cjss95-073.
- H. S. Rosenkranz and G. Klopman, Mutagenesis, 1990, 5, 425–432, DOI:10.1093/mutage/5.5.425.
- P. Fernandez, M. Grifoll, A. M. Solanas, J. M. Bayona and J. Albaiges, Environ. Sci. Technol., 1992, 26, 817–829, DOI:10.1021/es00028a024.
- M. C. Elia, R. D. Storer, T. W. McKelvey, A. R. Kraynak, J. E. Barnum, L. S. Harmon, J. G. Deluca and W. W. Nichols, Environ. Mol. Mutagen., 1994, 24, 181–191, DOI:10.1002/em.2850240307.
- I. J. Massey, M. D. Aitken, L. M. Ball and P. E. Heck, Environ. Toxicol. Chem., 1994, 13, 1743–1752, DOI:10.1002/etc.5620131105.
- Q. Huang, L. Wang and S. Han, Chemosphere, 1995, 30, 915–923, DOI:10.1016/0045-6535(94)00450-9.
- P. Mulchandani, Y. Lei, W. Chen, J. Wang and A. Mulchandani, Anal. Chim. Acta, 2002, 470, 79–86, DOI:10.1016/S0003-2670(02)00606-2.
- X. Liu, Y. Ji, Y. Zhang, H. Zhang and M. Liu, J. Chromatogr. A, 2007, 1165, 10–17, DOI:10.1016/j.chroma.2007.07.057.
- K. C. Honeychurch and J. P. Hart, Electroanalysis, 2007, 19, 2176–2184, DOI:10.1002/elan.200703989.
- X. Guo, H. Zhou, T. Fan and D. Zhang, Sens. Actuators, B, 2015, 220, 33–39, DOI:10.1016/j.snb.2015.05.042.
- C. Zhang, S. Govindaraju, K. Giribabu, Y. S. Huh and K. Yun, Sens. Actuators, B, 2017, 252, 616–623, DOI:10.1016/j.snb.2017.06.039.
- J. Liu, H. Chen, Z. Lin and J.-M. Lin, Anal. Chem., 2010, 82, 7380–7386, DOI:10.1021/ac101510b.
- G. Ren, M. Tang, F. Chai and H. Wu, Eur. J. Inorg. Chem., 2018, 2018, 153–158, DOI:10.1002/ejic.201701080.
- M. Mao, C. Deng, Y. He, Y. Ge and G. Song, J. Fluoresc., 2017, 27, 1421–1426, DOI:10.1007/s10895-017-2080-8.
- M. I. Gaviria-Arroyave, J. B. Cano and G. A. Peñuela, Talanta, 2020, 2, 100006, DOI:10.1016/j.talo.2020.100006.
- N. Sohal, S. K. Bhatia, S. Basu and B. Maity, New J. Chem., 2021, 45, 19941–19949, 10.1039/D1NJ04551B.
- X. Han, Y. Wang, Y. Huang, X. Wang, J. Choo and L. Chen, J. Hazard. Mater., 2022, 431, 128527, DOI:10.1016/j.jhazmat.2022.128527.
- N. Ahmad, A. S. Al-Fatesh, R. Wahab, M. Alam and A. H. Fakeeha, J. Mater. Sci.: Mater. Electron., 2020, 31, 11927–11937, DOI:10.1007/s10854-020-03747-3.
- A. Rana, A.-N. Kawde and M. Ibrahim, J. Electroanal. Chem., 2018, 820, 24–31, DOI:10.1016/j.jelechem.2018.04.055.
- W. J. Zhang, S. G. Liu, L. Han, Y. Ling, L. L. Liao, S. Mo, H. Q. Luo and N. B. Li, Anal. Methods, 2018, 10, 4251–4256, 10.1039/C8AY01357H.
- H. R. Rajabi, M. Shamsipur, A. A. Khosravi, O. Khani and M. H. Yousefi, Spectrochim. Acta, Part A, 2013, 107, 256–262, DOI:10.1016/j.saa.2013.01.045.
- M. Shamsipur and H. R. Rajabi, Mater. Sci. Eng. Carbon, 2014, 36, 139–145, DOI:10.1016/j.msec.2013.12.001.
- G. Li, W. Kong, M. Zhao, S. Lu, P. Gong, G. Chen, L. Xia, H. Wang, J. You and Y. Wu, Biosens. Bioelectron., 2016, 79, 728–735, DOI:10.1016/j.bios.2015.12.094.
- Y. Wang and A. Hu, J. Mater. Chem. C, 2014, 2, 6921, 10.1039/C4TC00988F.
- H. Park, D. J. Shin and J. Yu, J. Chem. Educ., 2021, 98, 703–709, DOI:10.1021/acs.jchemed.0c01403.
- S. Han, Y. Zhao, Z. Zhang and G. Xu, Molecules, 2020, 25, 5208, DOI:10.3390/molecules25215208.
- R. Jin, C. Zeng, M. Zhou and Y. Chen, Chem. Rev., 2016, 116, 10346–10413, DOI:10.1021/acs.chemrev.5b00703.
- D. Bain, S. Maity, B. Paramanik and A. Patra, ACS Sustainable Chem. Eng., 2018, 6, 2334–2343, DOI:10.1021/acssuschemeng.7b03794.
- I. Chakraborty and T. Pradeep, Chem. Rev., 2017, 117, 8208–8271, DOI:10.1021/acs.chemrev.6b00769.
- D. Bain, S. Maity and A. Patra, Chem. Commun., 2020, 56, 9292–9295, 10.1039/D0CC03565C.
- Z. Zhuang, Q. Yang and W. Chen, ACS Sustainable Chem. Eng., 2019, 7, 2916–2923, DOI:10.1021/acssuschemeng.8b06637.
- N.-N. Wu, L.-G. Chen, M.-Z. Xiao, R.-Y. Yuan and H.-B. Wang, Determination of trypsin using protamine mediated fuorescent enhancement of DNA templated Au nanoclusters, Microchim. Acta, 2023, 190, 158, DOI:10.1007/s00604-023-05754-7.
- H. Zhang, B.-B. Tao, N.-N. Wu, L.-G. Chen and H.-B. Wang, Inter filter effect between fluorescent copper nanoclusters and Cr(VI) and its application for probing the activity of alkaline phosphatase, Microchem. J., 2023, 193, 109066, DOI:10.1016/j.microc.2023.109066.
- N.-N. Wu, L.-G. Chen and H.-B. Wang, A Sensitive Fluorescence Sensor for Tetracycline Determination Based on Adenine Thymine-Rich Single-Stranded DNA-Templated Copper Nanoclusters, Appl. Spectrosc., 2023, 77(10), 1206–1213, DOI:10.1177/00037028231192124.
- H.-B. Wang, B.-B. Tao, A.-L. Mao, Z.-L. Xiao and Y.-M. Liu, Self-assembled copper nanoclusters structure-dependent fluorescent enhancement for sensitive determination of tetracyclines by the restriction intramolecular motion, Sens. Actuators, B, 2021, 348, 130729, DOI:10.1016/j.snb.2021.130729.
- H. B. Wang, A.-L. Mao, B.-B. Tao, H.-D. Zhang, Z.-L. Xiao and Y.-M. Liu, L-Histidine-DNA interaction: a strategy for the improvement of the fluorescence signal of poly(adenine) DNA-templated gold nanoclusters, Microchim. Acta, 2021, 188, 198, DOI:10.1007/s00604-021-04853-7.
- S. Chandirasekar, G. Dharanivasan, J. Kasthuri, K. Kathiravan and N. Rajendiran, J. Phys. Chem. C, 2011, 115, 15266–15273, DOI:10.1021/jp2044465.
- T. Raja Muthuramalingam, C. Shanmugam, D. Gunasekaran, N. Duraisamy, R. Nagappan and K. Krishnan, RSC Adv., 2015, 5, 71174–71182, 10.1039/C5RA13306H.
- S. Maity, D. Bain, S. Chakraborty, S. Kolay and A. Patra, ACS Sustainable Chem. Eng., 2020, 8, 18335–18344, DOI:10.1021/acssuschemeng.0c07431.
- J. Xie, Y. Zheng and J. Y. Ying, J. Am. Chem. Soc., 2009, 131, 888–889, DOI:10.1021/ja806804u.
- R. P. Mandal, G. Mandal, S. Sarkar, A. Bhattacharyya and S. De, “Theranostic” role of bile salt-capped silver nanoparticles - gall stone/ pigment stone disruption and anticancer activity, J. Photochem. Photobiol., B, 2017, 175, 269–281, DOI:10.1016/j.jphotobiol.2017.08.040.
- G. Yang, F. Wu, M. Chen, J. Jin, R. Wang and Y. Yuan, Formilation design, characterization, and in vitro and in vivo evaluation of nanostructured lipid carriers containing a bile salt for oral delivery of gypenosides, Int. J. Nanomed., 2019, 14, 2267–2280 CrossRef CAS PubMed.
- C. Chauhan, V. Bhardwaj and S. K. Sahoo, Microchem. J., 2021, 170, 106778, DOI:10.1016/j.microc.2021.106778.
- H.-B. Wang, B.-B. Tao, N.-N. Wu, H.-D. Zhang and Y.-M. Liu, Spectrochim. Acta, Part A, 2022, 271, 120948, DOI:10.1016/j.saa.2022.120948.
- Z. Cai, Y. Zhang, M. Jin, M. Hao, H. Yang, Y. Peng, J. Lu, Y. Zhang, J. Dong, J. Ren, R. Zhang and Y. Wang, Spectrochim. Acta, Part A, 2023, 300, 122940, DOI:10.1016/j.saa.2023.122940.
- C. Lu, Q. Zhu, X. Zhang, H. Ji, Y. Zhou, H. Wang, Q. Liu, J. Nie, W. Han and X. Li, ACS Sustainable Chem. Eng., 2019, 7, 8542–8553, DOI:10.1021/acssuschemeng.9b00322.
- J. Noh, E. Ito, K. Nakajima, J. Kim, H. Lee and M. Hara, J. Phys. Chem. B, 2002, 106, 7139–7141, DOI:10.1021/jp020482w.
- A. B. D. Nandiyanto, R. Oktiani and R. Ragadhita, Indones. J. Sci. Technol., 2019, 4, 97, DOI:10.17509/ijost.v4i1.15806.
- J. Zhang, R. Zhou, D. Tang, X. Hou and P. Wu, TrAC, Trends Anal. Chem., 2019, 110, 183–190, DOI:10.1016/j.trac.2018.11.002.
- R. F. Bogale, Y. Chen, J. Ye, Y. Yang, A. Rauf, L. Duan, P. Tian and G. Ning, Sens. Actuators, B, 2017, 245, 171–178, DOI:10.1016/j.snb.2017.01.177.
- A. Kundu, B. Maity and S. Basu, ACS Omega, 2023, 8, 22178–22189, DOI:10.1021/acsomega.3c02474.
- W. Li, H. Zhang, S. Chen, Y. Liu, J. Zhuang and B. Lei, Biosens. Bioelectron., 2016, 86, 706–713, DOI:10.1016/j.bios.2016.07.034.
- T. Hao, X. Wei, Y. Nie, Y. Xu, Y. Yan and Z. Zhou, Microchim. Acta, 2016, 183, 2197–2203, DOI:10.1007/s00604-016-1851-2.
- M. Liu, Z. Gao, Y. Yu, R. Su, R. Huang, W. Qi and Z. He, Nanoscale Res. Lett., 2018, 13, 27, DOI:10.1186/s11671-018-2440-6.
- F. C. Moraes, S. T. Tanimoto, G. R. Salazar-Banda, S. A. S. Machado and L. H. Mascaro, Electroanalysis, 2009, 21, 1091–1098, DOI:10.1002/elan.200804522.
Footnote |
| † Electronic supplementary information (ESI) available. See DOI: https://doi.org/10.1039/d4lf00143e |
| This journal is © The Royal Society of Chemistry 2024 |

