 Open Access Article
High-performance humidity sensor based on Ag-doped ZnGa2O4/ZnO composite nanofibers
Chunhua
Sun†
a,
Wenjing
Li†
a,
Ze
Lv
*b and
Ying
Guo
 *a
*a
aState Key Laboratory of Chemical Resource Engineering, Beijing University of Chemical Technology, P. O. Box 98, Beijing, 100029, P. R. China. E-mail: guoying@mail.buct.edu.cn
bSchool of Chemistry and Chemical Engineering, Nanjing University of Science and Technology, Nanjing, 210094, P. R. China. E-mail: lvze@njust.edu.cn
First published on 27th June 2024
Abstract
Ag-doped ZnGa2O4/ZnO composite nanofibers (ZG-Ag) were synthesized using electrostatic spinning followed by calcination. Compared to undoped ZnGa2O4/ZnO composite nanofibers (ZG), Ag-doped ZnGa2O4/ZnO composite variants exhibited superior room-temperature humidity sensing capabilities. Notably, the humidity-sensitive performance of the Ag-doped ZnGa2O4/ZnO composite nanofibers can be tuned by adjusting the Ag content, achieving a reliable wet hysteresis of 2.81% and a rapid response and recovery time of 1.5 and 2 seconds, respectively. The humidity sensing mechanism of the composites was also investigated. Compounding ZnO with ZnGa2O4 was found to mitigate the hysteresis issue, while the porous nanofiber structure and doping with Ag increased oxygen vacancies and conductivity. These enhancements collectively contributed to an improved sensitivity to water molecules.
Introduction
Relative humidity (RH) is an important index in drying technology, food processing, biomedicine, agriculture, etc.1–5 Humidity sensors have been developed as convenient devices for detecting RH in various environments. For practical applications, humidity sensors must possess high sensitivity and selectivity, fast response and recovery speed, as well as long-term stability and repeatability.6,7 However, an important challenge for humidity sensors today is to have the ability to respond and recover quickly with a small wet hysteresis. In response to these requirements, a wide variety of humidity-sensitive materials has been developed, including metal oxide semiconductors,8 polymers,9 carbon materials,10 one/two/three-dimensional (1D/2D/3D) functional materials, etc.11–14 The important reason for designing these sensing materials is to enhance the performance of humidity sensors so that they can be practically used in daily life. Metal oxide semiconductors, known for their high surface activity, excellent surface-to-volume ratio, ease of fabrication and low cost, have been widely utilized in humidity sensing over many years.15–18 Among the metal oxides, zinc oxide (ZnO) stands out as a versatile II–VI semiconductor with an energy gap of 3.37 eV and a high exciton binding energy of about 60 meV. It has been used in the humidity sensing field due to its unique chemical, optical, and electronic properties.19,20 However, conventional ZnO humidity sensors have the disadvantage of large hysteresis and the response sensing performance needs to be improved. In order to solve these problems, combination of ZnO with other substances is considered to improve humidity characteristics. ZnGa2O4 is a wide band gap semiconductor, with band gap energy between 4.5 and 5.2 eV. The high electron mobility of ZnGa2O4, which enables electrons to migrate rapidly from the interior to the surface for the reaction and the ability to sense and respond to external changes more quickly, suggests that the hysteresis effect of ZnGa2O4 is small.21 Therefore, compounding ZnO with ZnGa2O4 has the potential to solve the hysteresis problem of ZnO.In addition to this, oxygen vacancy is known to be an important factor in the humidity-sensitive properties of materials. It has been shown that noble metal doping can increase the number of oxygen vacancies in the material. Tao Shen et al. report that the uniformly distributed Ag particles on ZnO/graphene make ZnO/graphene have abundant active sites on the surface and more oxygen vacancies to capture more water molecules which increases the humidity sensing performance.22
Moreover, one of the important factors affecting the moisture-sensitive performance is the specific surface area. Constructing the material as a one-dimensional nanofiber structure can effectively increase the specific surface area, which can provide more adsorption sites for water molecules to enhance the moisture-sensitive performance. One of the methods to construct one-dimensional nanostructures is the electrostatic spinning method. For example, Alireza Nikfarjam et al. have reported single TiO2 and Au-doped TiO2 nanofibers obtained by electrostatic spinning and the structure helps to show high response to CO at low concentration.23
Therefore, in order to solve the disadvantage of large hysteresis and improve the moisture-sensitive properties of ZnO, a new kind of 1D nanofiber, Ag-doped ZnGa2O4/ZnO composite (ZG-Ag) with high specific surface area and electrical conductivity was obtained by calcining the precursor prepared by electrostatic spinning in this paper. The content of Ag was controlled to tune the oxygen vacancies. By studying the humidity sensing properties, the multi-material was found with the best performance such as high response, low humidity hysteresis, and fast response and recovery. Furthermore, based on the complex impedance curves of the composite materials, equivalent circuit simulations were performed as an aid to the analysis. The results show that moisture-sensitive sensors, as electronic devices, produce different resistive as well as capacitive structures as the ambient humidity increases, and that the combination of the two enables a better analysis of the sensing mechanism.
Experiments
Materials
Zinc nitrate (Zn(NO3)2·6H2O) and polyvinylpyrrolidone (PVP) were purchased from Aladdin (Shanghai, China, https://www.aladdin-e.com). Gallium nitrate (Ga(NO3)3·9H2O), dimethylformamide (DMF), and polyethylene oxide–polypropylene oxide–polyethylene oxide (PEO–PPO–PEO, P123) were purchased from Macklin (Shanghai, China, https://www.macklin.cn). Silver nitrate (AgNO3) and ethanol (CH3CH2OH) were purchased from Sinopharm Chemical Reagent Co., Ltd (Shanghai, China, https://www.reagent.com.cn). All the reagents used were of analytical grade (AR) and no further purification was required.Synthesis of the samples
To prepare the precursor solutions, 0.7574 g of zinc nitrate and 0.5115 g of gallium nitrate were added to a 50 mL solvent mixture of ethanol and DMF in a 1![[thin space (1/6-em)]](https://www.rsc.org/images/entities/char_2009.gif) :
:![[thin space (1/6-em)]](https://www.rsc.org/images/entities/char_2009.gif) 1 volume ratio, designated as solution A. For the second solution, 1.500 g of PVP, 0.4000 g of P123 and varying amounts of silver nitrate were dissolved together under stirring, designated as solution B. The molar ratios of silver nitrate to zinc nitrate were set at 0.05, 0.10, 0.15 and 0.20, respectively. Subsequently, solution A and B were combined and subjected to electrostatic spinning under the parameters of 15 kV of voltage, 15 cm of receiving distance, and a sample flow rate of 1 mL h−1 of, resulting in a series of nanofibers. These nanofibers were then calcined at 600 °C for 4 hours with a heating rate of 2 °C h−1, yielding Ag-doped ZnGa2O4/ZnO nanofibers, labeled as ZG-Ag-1, ZG-Ag-2, ZG-Ag-3, and ZG-Ag-4 according to the varying silver content. Additionally, a control group without silver nitrate was prepared under the same conditions, resulting in the formation of a nanofiber named ZG.
1 volume ratio, designated as solution A. For the second solution, 1.500 g of PVP, 0.4000 g of P123 and varying amounts of silver nitrate were dissolved together under stirring, designated as solution B. The molar ratios of silver nitrate to zinc nitrate were set at 0.05, 0.10, 0.15 and 0.20, respectively. Subsequently, solution A and B were combined and subjected to electrostatic spinning under the parameters of 15 kV of voltage, 15 cm of receiving distance, and a sample flow rate of 1 mL h−1 of, resulting in a series of nanofibers. These nanofibers were then calcined at 600 °C for 4 hours with a heating rate of 2 °C h−1, yielding Ag-doped ZnGa2O4/ZnO nanofibers, labeled as ZG-Ag-1, ZG-Ag-2, ZG-Ag-3, and ZG-Ag-4 according to the varying silver content. Additionally, a control group without silver nitrate was prepared under the same conditions, resulting in the formation of a nanofiber named ZG.
Characterization
X-ray diffraction (XRD) measurement was performed on a D8A25 Advance diffractometer with Cu Kα radiation (λ = 0.15418 nm) (Bruker, Karlsruhe, Germany). Scanning electron microscopy (SEM) was performed using a Supra-55 scanning electron microscope (Zeiss). The binding energy was characterized using a Thereto VGESCAL 250 X-ray photoelectron spectroscope (XPS) to confirm the valence of every element and chemical composition. The specific surface area and pore size distribution images were performed using an ASAP-2460 automatic specific surface area and porosity analyzer (BET, Micromeritics, USA). The high resolution transmission images were taken with a JEM-2100 transmission electron microscope (HRTEM) (Hitachi, Japan).Fabrication and measurements of humidity sensors
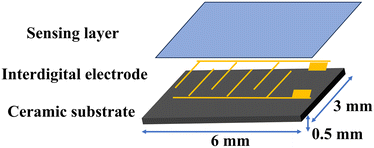
The resistive humidity sensor consists of an Al2O3 ceramic substrate, Ag–Pd interdigital electrodes, and a humidity-sensitive material layer, as illustrated in Fig. 1. The fabrication process of the humidity sensor involves several steps. Initially, 10 mg of the sample material was finely ground using a mortar and pestle. Subsequently, 2 mL of deionized water was added to the sample to form a homogeneous paste. This paste was carefully and evenly applied to the surface of the Al2O3 ceramic substrate using a small brush, ensuring complete coverage of the interdigital electrodes to a thickness of 0.02 mm. Special care was taken to avoid contact between the material and the solder joints during application to prevent potential short circuits during subsequent testing.To investigate the moisture-sensitive properties of the samples, the resistance of the sensor was measured using a Chemical Humidity Sensing-1 (CHS-1) measurement system (Beijing Elite Technology Co., Ltd.) at room temperature (25 °C) and 1.25 V AC. To control the humidity levels, supersaturated aqueous solutions of LiCl, MgCl2, Mg(NO3)2, NaCl, KCl, and KNO3 were prepared and placed in airtight glass containers at room temperature, generating relative humidity (RH) levels of approximately 11%, 33%, 54%, 75%, 85%, and 95%.
Results and discussion
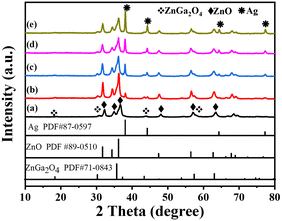
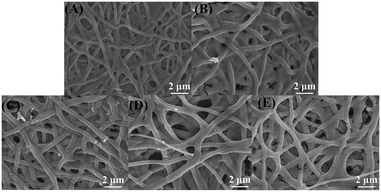
The XRD patterns of ZG, ZG-Ag-1, ZG-Ag-2, ZG-Ag-3, and ZG-Ag-4 are shown in Fig. 2. All samples show high crystallinity due to their clear and sharp peaks.24 The ZG nanofiber (Fig. 2a) exhibits six distinct characteristic diffraction peaks of ZnO at 2θ = 31.84°, 34.50°, 36.33°, 47.65°, 56.73°, and 63.01°, respectively, corresponding to the (100), (002), (101), (102), (110), and (103) crystal planes of hexagonal ZnO (JCPDS#89-0510). The characteristic diffraction peaks of ZnGa2O4 at 2θ = 18.43°, 30.32°, 35.72°, and 43.41°, corresponding to the (111), (220), (311), and (400) crystal planes of ZnGa2O4 (JCPDS#71-0843), are observed from the composite of ZG as expected.25 After Ag doping (Fig. 2b–e), these nanofibers all show four distinct characteristic diffraction peaks of Ag at 2θ = 38.11°, 44.29°, 64.44°, and 77.39° (JCPDS#87-0597), indicating the generation of elemental silver in the multi-materials. Moreover, the XRD patterns reveal that Ag is only doped on the surface of the nanofibers rather than doped in the crystal lattice as the 2θ of the peaks of ZnO and ZnGa2O4 do not show any obvious shift.26Fig. 3 shows the SEM images of ZG and ZG-Ag composites. The SEM image of ZG shown in Fig. 3(A) has a fibrous structure with a rough surface and a diameter of about 0.3–0.5 μm, which is due to the volatilization of residual solvents and inorganic salts during the calcination process. Meanwhile, PVP and P123 were decomposed into CO2, which eventually formed the complex of Ag and ZnGa2O4 of ZnO. As shown in Fig. 3(B–D), after roasting, the conversion of silver ions into elemental silver and nitrate ions into NOx leads to the development of a porous rough surface on the doped fibers. The diameter of the fibers becomes bigger, about 0.5–1 μm. Moreover, with an increase in silver nitrate, the ZG-Ag fibers become rougher with the amount of silver. In particular, the composites of ZG-Ag-1, ZG-Ag-2, and ZG-Ag-3 show a significant increase in the number and distribution of the mesoporous structure. However, when adding too much silver nitrate in the fibers, such as in ZG-Ag-4, as shown in Fig. 3(E), it shows a fractured structure. This is because too much doping may lead to lattice distortion, making the crystal structure of the material unstable and prone to fracture.
Fig. 4(A) shows the HRTEM images of ZG-Ag-2 fibers. It is obvious that the ZG-Ag-2 fibers are composed of uniformly distributed nanoparticles of approximately 20 nm in size. The lattice fringes of ZnO, ZnGa2O4 and Ag can be observed in Fig. 4(B). The lattice spacing of ZnO is 0.255 nm, corresponding to the (101) crystal planes of hexagonal ZnO, and the lattice spacing of ZnGa2O4 is 0.478 nm, corresponding to the (111) crystal planes of ZnGa2O4. Meanwhile, the lattice spacing of Ag is 0.231 nm, corresponding to the (111) crystal planes of Ag. These findings confirm that the roasted fiber is a mixture consisting of ZnO, ZnGa2O4 and elemental silver. Therefore, it can be concluded that Ag-doped ZnGa2O4/ZnO composite nanofibers have been successfully prepared.27
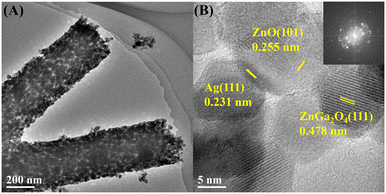 | ||
| Fig. 4 HRTEM images for ZG-Ag-2 sample at different magnifications (A: low magnification and B: high magnification). | ||
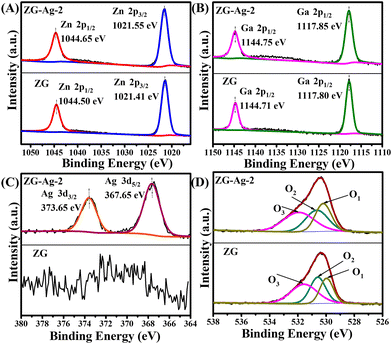
As shown in Fig. 5, XPS was used to better understand the chemical composition of ZG and ZG-Ag-2 composites. The XPS spectra of Zn 2p for ZG and ZG-Ag-2 are presented in Fig. 5(A), which confirms the existence of Zn2+ ions in the ZnO lattice, indicated by the peaks with binding energies of 1044.50 eV (Zn 2p1/2) and 1021.41 eV (Zn 2p3/2). The binding energies of the Ga 2p1/2 and Ga 2p3/2 peaks are observed to be 1144.71 eV and 1117.80 eV, respectively, as shown in Fig. 5(B). The double peaks imply the presence of oxidizing Ga3+ ions.28
Furthermore, compared with the binding energies of Zn and Ga in ZG, a tiny shift of the binding energies of Zn and Ga of ZG-Ag-2 can be observed, potentially due to the Ag doping. In addition, a slight increase in the binding energies of Zn and Ga can be observed for ZG-Ag-2 as compared to the binding energies of Zn and Ga in ZG, which may be attributed to the fact that the electronegativity of Zn (1.65) and Ga (1.81) is smaller than that of Ag (1.93), and the lower electronegativity indicates that their atoms are less capable of attracting electrons in the compounds, resulting in the loss of electrons and an increase in the binding energy. However, this shift cannot provide a strong force between Ag and metal oxides.29 As shown in Fig. 5(C), elemental silver is demonstrated to exist in ZG-Ag-2 with peaks at binding energies of 373.65 eV and 367.65 eV, corresponding to Ag 3d3/2 and Ag 3d5/2, compared with no Ag peak in ZG fiber. As illustrated in Fig. 5(D), three peaks can be fitted to the O 1s peaks of ZG at 530.25 eV, 530.65 eV, and 531.95 eV, and three peaks can be fitted to the O 1s peaks of ZG-Ag-2 at 530.02 eV, 530.61 eV, and 531.59 eV, representing lattice oxygen (O1), oxygen vacancy defects (O2), and surface adsorption of oxygen and H2O (O3) on metal oxides. The specific percentages of O1, O2 and O3 content are listed in Table 1. The doping of Ag results in an effective increase in the number of oxygen vacancies in ZG-Ag-2, as evidenced by the change in the O2/O1 ratio from 0.93 in ZG to 1.32 in ZG-Ag-2. As mentioned by other researchers, the presence of oxygen vacancies facilitates the adsorption of water on the surface and the decomposition of water molecules.30,31 Apparently, in this paper, ZG-Ag-2 exhibits a large number of oxygen vacancies that can dissociate the water molecules adsorbed on the surface, leading to the formation of H3O+ conductive ions. This phenomenon later contributes to the enhanced humidity sensing performance of the sensor.
| Samples | O1 (%) | O2 (%) | O3 (%) | O2/O1 |
|---|---|---|---|---|
| ZG | 32.55 | 30.27 | 37.18 | 0.93 |
| ZG-Ag-2 | 27.36 | 36.12 | 36.52 | 1.32 |
The N2 adsorption–desorption isotherms were used to measure the specific surface area of ZG and ZG-Ag, which are all composed of aggregated nanoparticles with porous structures. According to Table 2, the specific surface area of the fibers shows an increasing trend with the increase of Ag doping. Furthermore, the increasing amount of silver nitrate in the spinnable solution leads to the release of more NOx gas during calcination, which promotes the formation of porous and coarse fibers.
| Samples | ZG | ZG-Ag-1 | ZG-Ag-2 | ZG-Ag-3 | ZG-Ag-4 |
|---|---|---|---|---|---|
| Specific surface area (m2 g−1) | 23.6697 | 24.5881 | 26.3396 | 31.5679 | 37.1421 |
The N2 adsorption–desorption isotherms and pore size distributions of ZG, ZG-Ag-1, ZG-Ag-2, ZG-Ag-3, and ZG-Ag-4 fibers are presented in Fig. 6. It can be seen that the curve of the ZG composite in Fig. 6(A) shows a H3-type hysteresis return line and IV-type adsorption isotherm, which implies that these fibers have a mesoporous structure formed by CO2 and NOx gases released from PVP, P123, and nitrate during the heating process. Also, Fig. 6(A) shows that after co-doping with Ag, the curves of ZG-Ag-1 and ZG-Ag-2 display H4-type hysteresis return lines and type IV adsorption isotherms, indicating the presence of both micropores and mesopores in the ZG-Ag-1 and ZG-Ag-2 fibers. It is hypothesized that the formation of micropores can be attributed to the presence of elemental silver, which hinders the mesoporous structure within the metal oxide nanofibers. With the increase of the silver nitrate content, ZG-Ag-3 and ZG-Ag-4 exhibit H3-type hysteresis return lines and IV-type adsorption isotherms. Due to the increasing amount of nitrate, more NOx gas was released from nitrate, which led to the reappearance of the mesoporous structure of the fibers. The corresponding trend was obtained as shown in Fig. 6(B), where the pore size distribution of ZG fibers is concentrated around 14–16 nm. Whereas, with the addition of silver nitrate, it leads to the clogging of the pore structure; the pore size distribution of ZG-Ag-1 and ZG-Ag-2 fibers is marginally concentrated around 7–10 nm. It further confirms that the elemental silver doping leads to the formation of microporous structures.32 Meanwhile, the pore size distributions of ZG-Ag-3 and ZG-Ag-4 fibers are concentrated around 14–16 nm again.
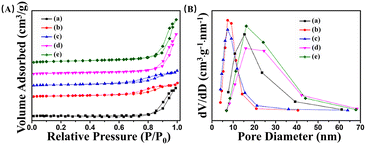 | ||
| Fig. 6 (A) N2 adsorption–desorption isotherms and (B) pore size distributions of (a) ZG, (b) ZG-Ag-1, (c) ZG-Ag-2, (d) ZG-Ag-3 and (e) ZG-Ag-4. | ||
The operating frequency is an important parameter that affects the performance of the humidity sensor. The curves for the determination of the operating frequency are similar for all samples, so we selected a representative of the ZG-Ag-2 sample to describe how the operating frequency was determined. First, the impedances of the ZG-Ag-2 sensor were tested at various frequencies (50 and 100 Hz, and 1, 10, and 100 kHz) as shown in Fig. 7. At 50 Hz, the ZG-Ag-2 humidity sensor exhibits the highest response and linearity. However, the impedances of the sensor are too large to test at 11% RH. In contrast, at frequencies of 1, 10, and 100 kHz, the ZG-Ag-2 humidity sensor does not show a significant response to water molecules at low relative humidity levels due to the difficulty in polarizing water molecules at such high operating frequencies. It can be seen that only at 100 Hz, the ZG-Ag-2 humidity sensor achieves the best linearity and response. Therefore, the optimum operating frequency for further sensing tests was determined as 100 Hz.
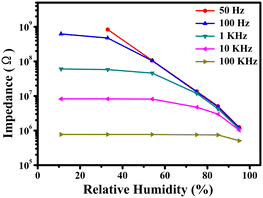 | ||
| Fig. 7 Relationship between impedance and RH for the ZG-Ag-2 humidity sensor with working frequencies of 50 and 100 Hz, and 1, 10, and 100 kHz. | ||
The response–recovery curves of the ZG and ZG-Ag humidity sensors are shown in Fig. 8(A–E). The corresponding hysteresis loops for these sensors are shown in Fig. 8(F–J). The humidity sensing performances of these sensors are presented in Table 3. The sensitivity of the sensors was calculated using the formula S = ΔR/ΔRH, where ΔR represents the impendence difference from a% RH to b% RH and ΔRH is the difference in relative humidity from a% RH to b% RH (with values of a = 11 and b = 95 in this study). The hysteresis error of the sensors was determined using the formula H = ΔHmax/S, where ΔHmax denotes the maximum hysteresis value.33 Additionally, the response/recovery time of the humidity sensor is defined as the time taken for the impedance of the sensor to reach 90% of its total impedance change.34
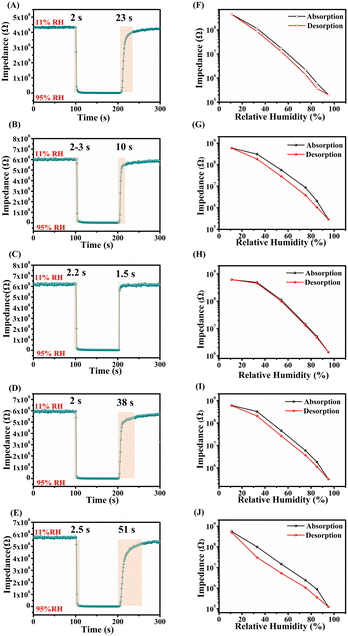 | ||
| Fig. 8 The response–recovery curves of (A) ZG, (B) ZG-Ag-1, (C) ZG-Ag-2, (D) ZG-Ag-3, and (E) ZG-Ag-4; the hysteresis loops of (F) ZG, (G) ZG-Ag-1, (H) ZG-Ag-2, (I) ZG-Ag-3, and (J) ZG-Ag-4. | ||
| Samples | Sensitivity (MΩ/% RH) | Response time (s) | Recovery time (s) | Hysteresis (% RH) |
|---|---|---|---|---|
| ZG | 4.86 | 2 | 23 | 4.88 |
| ZG-Ag-1 | 7.06 | 2–3 | 10 | 18.20 |
| ZG-Ag-2 | 7.36 | 2.2 | 1.5 | 2.81 |
| ZG-Ag-3 | 6.62 | 2 | 38 | 10.61 |
| ZG-Ag-4 | 7.26 | 2.5 | 51 | 16.25 |
From Fig. 8(A–E) and Table 3, it can be seen that the response time of the ZG sample is only 2 s, and the sensitivity is 4.83 MΩ/% RH, but the recovery time is 23 s, which still indicates a long recovery time. This is because the mesoporous structure of the fiber provides a large number of oxygen vacancies capable of capturing water molecules rapidly, explaining its rapid humidity response. However, this unique structure also hinders conduction and desorption of water molecules, resulting in a prolonged recovery time. After Ag doping, it can be seen that all the response times of the composites of ZG-Ag are still around 2 s, but there is a significant change in the recovery time. Compared with ZG, the sensitivity of ZG-Ag-1 increased to 7.06 MΩ/% RH and the recovery time was shortened to 10 s. Combined with the specific surface area and pore size analysis, it can be concluded that the increase in sensitivity can be attributed to the increase in specific surface area. Also, a small amount of silver doping will cause the sensor to produce a microporous structure, which is favorable to the desorption of water molecules, making the recovery time shorter. The sensitivity of ZG-Ag-2 was further increased to 7.36 MΩ/% RH and the recovery time was drastically shortened to only 1.5 s, which indicates that the ZG-Ag-2 fiber has excellent adsorption and desorption ability for water molecules. This is attributed to the moderate amount of silver doping, which further increases the specific surface area of the sensor and moderates the pore size.
Additionally, the abundance of oxygen vacancies on the surface of ZG-Ag-2 fibers facilitates the decomposition of water molecules into H3O+ species, contributing to the conduction. The electrical conductivity of the fibers is significantly enhanced by the Ag+ doping. As for the ZG-Ag-3 and ZG-Ag-4 sensors, when too much silver nitrate was added, the structure of the sensor was fractured and the mesopores were regenerated. Although the structure was fractured to further increase the specific surface area, the emergence of the mesoporous structure made the desorption of water molecules more difficult, thus resulting in longer recovery times, such as 38 and 51 s, respectively.
From Fig. 8(F–J) and Table 3, it can be seen that ZG-Ag-2 has the smallest hysteresis parameter, which confirms that the addition of an appropriate amount of silver can improve the moisture-sensitive performance of the sensor.
Fig. 9(A–E) show the impedance changes of the ZG sensor and ZG-Ag sensors under certain relative humidity which were changed from 11% RH to 95% RH for five cycles. Apparently, all the sensors show good stability and repeatability in humidity sensing tests. Even after repeated tests for up to 6 months, all the sensors show similar humidity sensing behavior without significant degradation, which shows the long-term stability of these sensors.
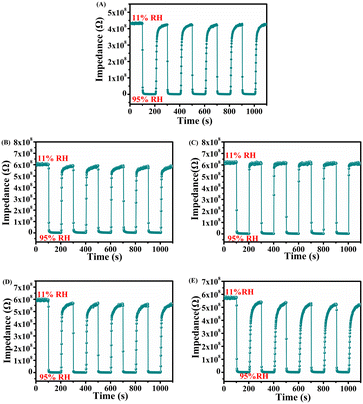 | ||
| Fig. 9 Humidity performance cycle curves of (A) ZG, (B) ZG-Ag-1, (C) ZG-Ag-2, (D) ZG-Ag-3, and (E) ZG-Ag-4. | ||
Table 4 provides a comparative analysis of the performance of the ZG-Ag-2 humidity sensor against other previously reported humidity sensors. The comparative study indicates that the ZG-Ag-2 sensor exhibits superior performance metrics, particularly in terms of rapid response and recovery times. Additionally, the ZG-Ag-2 sensor demonstrates a reduced wet hysteresis, which contributes to its enhanced sensitivity to humidity levels. These attributes collectively underscore the advanced humidity-sensitive performance of the ZG-Ag-2 sensor in relation to its counterparts.
Complex impedance spectroscopy (CIS), which was tested in the frequency range from 30 Hz to 100 kHz, and the equivalent circuit (EC) models were utilized to explore the humidity-sensitive mechanism of ZG-Ag-2 fibers (Fig. 10). At 11% RH, the CIS curve exhibits half of a semicircle due to the low RH environment, resulting in a large impedance. This is caused by the limited number of adsorbed water molecules on the surface of ZG-Ag-2 fibers. The EC is represented by a constant phase element (CPE).42 At 33% RH, the CIS curve shows a semicircle with a downward slope. During this stage, oxygen vacancies decompose water molecules on the fiber surface into OH− and H+, where H+ conducts electricity by jumping between hydroxyl groups. Additionally, a small number of escaping electrons from the fiber surface join the conduction process due to the adsorption of water molecules. In this case, the EC can be modeled by a parallel circuit composed of resistance (Rf) and capacitance (Cf).43 At RH levels of 54%, 75%, and 85%, all the CIS curves display a straight line in the low-frequency region and a semicircle in the high-frequency region. The straight line in the low-frequency region is attributed to the Warburg impedance (Zw),44 resulting from the diffusion process of ions at the sensing membrane/electrode interface and presenting the diffusion process of water molecules or charge carriers. It indicates that at this humidity, the carrier diffusion process begins. On one hand, a significant number of water molecules are adsorbed on the surface of ZG-Ag-2 fibers, and these molecules ionize into abundant charge carriers, H3O+ and OH−, through the reaction H2O + H2O → H3O+ + OH−. On the other hand, the ion transport theory of Grotthuss, H3O+ + H2O → H3O+ + H2O, further enhances the electrical conductivity.45 In these cases, the EC can include Cf, Rf and Zw. At high RH levels, such as 95% RH, the adsorption of water molecules on the fiber surface increases, leading to the formation of a continuous network structure and the dominant factor of conductivity becoming ionic migration. In this situation, the CIS curve appears as a line in the low-frequency region with a weakened semicircle and display a straight line in the high-frequency region. The EC can be represented by Zw and Cf in series.
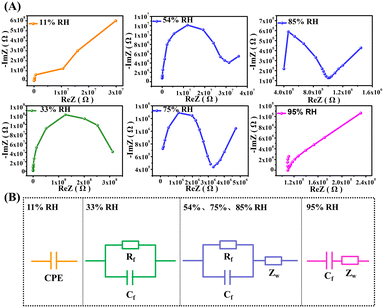 | ||
| Fig. 10 (A) Complex impedances and (B) corresponding equivalent circuit models of the ZG-Ag-2 sensor. | ||
Conclusions
Ag-doped ZnGa2O4/ZnO composite nanofibers (ZG-Ag) were prepared by electrostatic spinning and calcination process. The composite nanofibers exhibit superior room temperature and humidity sensing performance. By optimizing the Ag doping amount, the ZG-Ag composite exhibit excellent linearity, small hysteresis (2.81%), high humidity sensitivity and rapid response and recovery times of 2.2 s and 1.5 s, respectively. The remarkable humidity sensitivity of ZG-Ag can be attributed to the following: First, the one dimensional nanofiber structure provides great specific surface area. Second, the porous structure provides more oxygen vacancies, enhancing the sensitivity to water molecules. Third, the doping of silver ions noticeably increases electrical conduction. All the evidences presented above demonstrate that doping ZnGa2O4/ZnO composite nanofibers with silver significantly enhances their humidity-sensing properties, especially when combined with one-dimensional (1D) morphology. Moreover, the material exhibits a rapid response time and minimal wet hysteresis, making it a promising candidate for future applications in monitoring human respiration.Data availability
The authors confirm that the data supporting the findings of this study are available within the article.Author contributions
Chunhua Sun: analysis and writing, Wenjing Li: experiments and characterization, Ze Lv: mechanistic analysis, Ying Guo: supervision, review, editing, and funding acquisition.Conflicts of interest
There are no conflicts of interest to declare.Acknowledgements
This work was supported by the National Natural Science Foundation of China (NSFC 52072022).References
- R. N. Dean, A. K. Rane, M. E. Baginki, J. Richard, Z. Hartzog and D. J. Elton, IEEE Trans. Instrum. Meas., 2012, 61, 1105–1112 Search PubMed.
- A. S. Ismail, M. H. Mamat, M. F. Malek, M. M. Yusoff, R. Mohamed, N. D. M. Sin, A. B. Suriani and M. Rusop, Mater. Sci. Semicond. Process., 2018, 81, 127–138 CrossRef.
- X. Cha, F. Yu, Y. Fan, J. Chen, L. Wang, Q. Xiang, Z. Duan and J. Xu, Sens. Actuators, B, 2018, 263, 436–444 CrossRef CAS.
- X. Le, X. Wang, J. Pang, Y. Liu, B. Fang, Z. Xu, C. Gao, Y. Xu and J. Xie, Sens. Actuators, B, 2018, 255, 2454–2461 CrossRef CAS.
- N. M. Isa, N. Irawati, S. W. Harun, F. Ahmad, H. A. Rahman and M. H. M. Yusoff, Sens. Actuators, A, 2018, 272, 274–280 CrossRef CAS.
- D. M. Alessandro, F. M. Elena, P. Vittorio and I. Giuliana, Mater. Sci. Semicond. Process., 2017, 69, 44–51 CrossRef.
- R. B. Mani and S. K. Samdarshi, Mater. Sci. Eng., B, 2014, 182, 21–28 CrossRef.
- F. Li, P. Li and H. Zhang, Sensors, 2022, 22, 293–306 CrossRef CAS PubMed.
- T. Pisarenko, N. Papež, D. Sobola, Ş. Ţălu, K. Částková, P. Škarvada, R. Macků, E. Ščasnovič and J. Kaštyl, Polymer, 2022, 14, 593–611 CAS.
- J. Feng, X. Kang, Q. Zuo, C. Yuan, W. Wang, Y. Zhao, L. Zhu, H. Lu and J. Chen, Sensors, 2016, 16, 314–323 CrossRef PubMed.
- Z. Yap, W. Lim, A. Kalkal, P. Gopinath and N. Ramakrishnan, IEEE Trans. Instrum. Meas., 2023, 72, 1–8 Search PubMed.
- E. Modaresinezhad and S. Darbari, Sens. Actuators, B, 2016, 237, 358–366 CrossRef CAS.
- N. Li, X. D. Chen, X. P. Chen, X. Ding and X. Zhao, IEEE Electron Device Lett., 2017, 38, 806–809 CAS.
- W. D. Lin, Y. C. Lin, R. J. Wu and M. Chavali, Polymer, 2021, 13, 1623–1635 CAS.
- S. J. Young and L. T. Lai, IEEE Trans. Electron Devices, 2021, 68, 775–779 CAS.
- W. Li, Y. Ren and Y. Guo, Sens. Actuators, B, 2017, 253, 1071–1078 CrossRef.
- Y. Zhen, J. Zhang, W. Wang, Y. Li, X. Gao, H. Xue, X. Liu, Z. Jia, Q. Xue, J. Zhang, Y. Yan, N. S. Alharbi and T. Hayat, Sens. Actuators, B, 2020, 303, 127137 CrossRef CAS.
- P. Pascariua, A. Airinei, N. Olarua, I. Petrila, V. Nica, L. Sacarescu and F. Tudorache, Sens. Actuators, B, 2016, 222, 1024–1031 CrossRef.
- F. Meng, N. Hou, Z. Jin, B. Sun, Z. Guo, L. Kong, X. Xiao, H. Wu, M. Li and J. Liu, Sens. Actuators, B, 2015, 209, 975–982 CrossRef CAS.
- F. Meng, Y. Chang, W. Qin, Z. Yuan, J. Zhao, J. Zhang, E. Han, S. Wang, M. Yang, Y. Shen and M. Ibrahim, ACS Appl. Nano Mater., 2019, 2, 2734–2742 CrossRef CAS.
- V. Munusami, K. Arutselvan and S. Vadivel, Diamond Relat. Mater., 2021, 111, 108167 CrossRef CAS.
- T. Shen, A. Gong, J. Chen, C. Liu, X. Liu, Y. Feng and S. Duan, Opt. Laser Technol., 2022, 153, 108275 CrossRef CAS.
- A. Nikfarjam, S. Hosseini and N. Salehifar, ACS Appl. Mater. Interfaces, 2017, 9, 15662–15671 CrossRef CAS PubMed.
- S. Yu, H. Zhang, J. Zhang and Z. Li, Sensors, 2019, 19, 5267–5278 CrossRef CAS PubMed.
- S. H. Chio, B. H. Jang, J. S. Park, R. Demadrille, H. L. Tuller and D. Kim, ACS Nano, 2014, 8, 2318–2327 CrossRef PubMed.
- S. Yu, H. Zhang, C. Chen and C. Lin, Sens. Actuators, B, 2019, 287, 526–534 CrossRef CAS.
- W. Yang, H. Shen, H. Min and J. Ge, J. Mater. Sci., 2020, 55, 10399–10411 CrossRef CAS.
- N. Makeswaran, A. K. Battu, R. Swadipta, F. S. Manciu and C. V. Ramana, ECS J. Solid State Sci. Technol., 2019, 8, 3249–3253 CrossRef.
- K. T. G. Carvalho, O. F. Lopes, D. C. Ferreira and C. Ribeiro, J. Alloys Compd., 2019, 797, 1299–1309 CrossRef CAS.
- W. Gu, H. Zhang, C. Chen and J. Zhang, Curr. Appl. Phys., 2022, 34, 112–121 CrossRef.
- E. B. Kim, M. Imran, M. S. Akhtar, H. Shin and S. Ameen, J. Hazard. Mater., 2021, 404, 124069 CrossRef CAS PubMed.
- V. K. Tomer, S. Devi and R. Malik, Microporous Mesoporous Mater., 2016, 219, 240–248 CrossRef CAS.
- Z. Lv, Q. Chen and Y. Guo, Solid State Sci., 2020, 109, 106393 CrossRef CAS.
- A. S. Pawvake, R. G. Waykar, D. J. Late and S. R. Jadkar, ACS Appl. Mater. Interfaces, 2016, 8, 3359–3365 CrossRef PubMed.
- S. A. Arote, A. S. Pathan, Y. V. Hase, P. P. Bardapurkar, D. L. Gapale and B. M. Palve, Ultrason. Sonochem., 2019, 55, 313–321 CrossRef CAS PubMed.
- P. Li, S. Yu and H. Zhang, Sensors, 2021, 21, 857–866 CrossRef CAS PubMed.
- F. Li, P. Li and H. Zhang, Sensors, 2022, 22, 293–306 CrossRef CAS PubMed.
- H. Parangusan, J. Bhadra, Z. Ahmad, S. Mallick, F. Touatic and N. Al-Thani, RSC Adv., 2021, 11, 28735–28743 RSC.
- Q. Liang, H. Xu, J. Zhao and S. Gao, Sens. Actuators, B, 2012, 165, 76–81 CrossRef CAS.
- H. Yang, Q. Ye, R. Zeng, J. Zhang, L. Yue, M. Xu, Z. Qiu and D. Wu, Sensors, 2017, 17, 2415–2426 CrossRef PubMed.
- H. Zhang, W. Gu and C. Chen, Appl. Surf. Sci., 2022, 599, 154031 CrossRef CAS.
- K. Jiang, H. Zhao, J. Dai, D. Kuang, T. Fei and T. Zhang, ACS Appl. Mater. Interfaces, 2016, 8, 25529–25534 CrossRef CAS PubMed.
- H. Bi, K. Yin, X. Xie, J. Ji, S. Wan, L. Sun, M. Terrones and M. S. Dresselhaus, Sci. Rep., 2013, 3, 2714 CrossRef PubMed.
- S. Yu, C. Chen, H. Zhang, J. Zhang and J. Liu, Sens. Actuators, B, 2021, 332, 129536 CrossRef CAS.
- D. Zhang, X. Zong, Z. Wu and Y. Zhang, Sens. Actuators, B, 2018, 266, 52–62 CrossRef CAS.
Footnote |
| † These authors contributed equally. |
| This journal is © The Royal Society of Chemistry 2024 |

