 Open Access Article
Creative Commons Attribution 3.0 Unported Licence
Correlating processing induced orientation with tensile properties for mass polymerized acrylonitrile butadiene styrene test specimens†
E.
Fernandez
a,
M.
Edeleva
 a,
L.
Cardon
a and
D. R.
D'hooge
 *bc
*bc
aCentre for Polymer and Material Technologies, Department of Materials, Textile and Chemical Engineering, Ghent University, 9000 Gent, Belgium
bLaboratory for Chemical Technology, Department of Materials, Textile and Chemical Engineering, Ghent University, 9000 Gent, Belgium. E-mail: dagmar.dhooge@ugent.be
cCentre for Textile Science and Engineering, Department of Materials, Textile and Chemical Engineering, Ghent University, 9000 Gent, Belgium
First published on 30th September 2024
Abstract
In this research, we deal with the link between tensile properties and processing-related morphology variations for mass polymerized acrylonitrile butadiene styrene (mABS). The orientation of multi-core polybutadiene (PB) particles, which are intrinsic to mABS, is investigated regarding flow, shear and cooling changes during sample production. The effect of a different sample size and annealing on the tensile responses has been verified by considering ISO 527 1A and 1BA dog bone samples. For the thin 1BA bars, multiple injection velocities and cooling rates during injection molding have been tested to obtain a more pure correlation between morphology and tensile properties. To perform comparable tensile measurements using both types of dog bone samples, a testing method has been designed for which a relation is included between the sample gauge length and cross head velocity, enabling the comparison of elastic deformation for ISO 527 1A and 1BA mABS samples. Regarding the mABS part morphology, injection molded parts display a skin-shear-core gradient morphology with respect to the PB-particle size and orientation. Annealing of both types of injection molded samples successfully removes most flow-induced orientation of the rubber particles but also results in a change in PB morphology by dissolving a small fraction of the rubber into the SAN matrix, forming PB-nanoparticles. These small particles promote shear bands upon craze-based deformation and therefore positively contribute to the sample toughness. High flow-induced orientation within mABS parts causes a significantly increased tensile stiffness, strength and toughness along the flow direction. Irrespective of the PB orientation, tensile bars with a large surface roughness experience early failure, due to premature craze and crack initiation at the sample surface.
Introduction
The global demand for acrylonitrile butadiene styrene (ABS) experiences a significant increase, driven by a growing need for durable lightweight solutions in sectors such as the automotive and household appliances industries.1 Linked to this growing demand, ABS grades are further designed to cover a broader range of material properties and applicability for several polymer processing methods.Industrial synthesis of ABS proceeds via several routes including emulsion, suspension and mass/bulk polymerization.2 Numerous publications have reported the characteristics of emulsion polymerized ABS (eABS),2–8 while the in popularity growing mass polymerized ABS (mABS) has been more concisely investigated.2,9,10 Due to a different polymerization process, both ABS material types have another morphology concerning polybutadiene (PB) shape and content, justifying a deeper analysis of mABS manufacturing.2
As shown in Fig. 1, on an overall basis the (final) morphology of ABS is represented by a continuous styrene–acrylonitrile (SAN) phase in which grafted polybutadiene (PB) rubber particles are dispersed. In case acrylonitrile would be absent, high impact polystyrene (HIPS) is obtained.12,13 ABS can be described as a multiphase terpolymer made of acrylonitrile, butadiene and styrene with the monomer content typically ranging between 40 and 70% for styrene, between 15 and 35% for acrylonitrile, and between 5 and 30% for butadiene.11
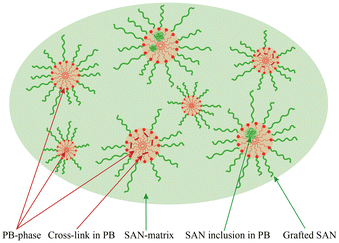 | ||
| Fig. 1 General morphology of acrylonitrile butadiene styrene polymer (ABS) material: green – SAN, red – PB. More detailed morphologies in Fig. 2. | ||
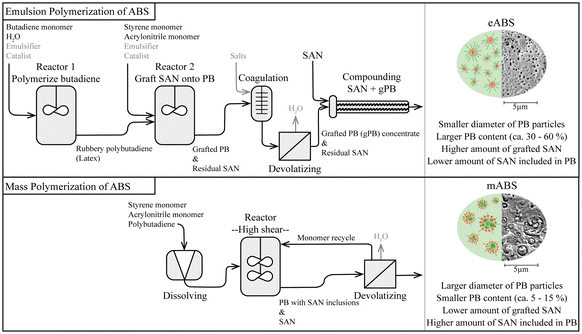
Fig. 2 displays the variations in the production processes of eABS and mABS. The diameter of the PB-particles can vary from 0.1–0.5 μm for eABS2,3,5–7 and can range up to 1–5 μm for mABS.2 Under emulsion polymerization conditions, copolymerization of acrylonitrile and styrene happens in the presence of PB-latex,3,8 while in the mass process PB is fully polymerized prior to being solved into both monomers.2 A significantly higher amount of grafted ABS is thus expected within the final product of the emulsion process compared to the product of mass polymerization. Commercial eABS production further includes a compounding step of the first polymerization product with pure SAN.8 Hence, eABS can also be interpreted as a blend of g-ABS with SAN, which is usually present in a 35–40/65–60 (mass) ratio.8 In the mass process, much higher shear occurs during polymerization, causing mABS to have a higher amount of SAN inclusions in the PB-particles. This causes a significantly larger spherical diameter while maintaining a low PB content, resulting in the well-established “salami” morphology of mABS.2
In any case, the rubber particles are added to ABS to enable a toughening, i.e. reinforcement, to tune the location of craze initiation and stabilize their propagation via shear bands.14–17 Initiation of a craze is preceded by the formation of voids, which causes local stress peaks in the matrix material18–21 upon which the craze propagation can occur by the so-called Taylor meniscus instability principle.20,21 In this process, the polymer at the tip of the craze is considered as a melt pool, which is activated by the increased local stress.20–22 Due to the load transition while forming the craze, the polymer near the craze tip is subjected to a higher amount of stress where subsequently new voids will be created.
Based on the insights and schematics from literature21,23,24 this phenomenon of craze formation in unreinforced polymers (e.g. SAN) is schematically represented in Fig. 3, forming the basis for Fig. 4 in which additional morphological variations are depicted upon deformation, due to the presence of rubber particles. Upon mechanically loading SAN in Fig. 3, two main types of crazes occur, being (i) large homogeneous crazes and (ii) smaller fibrillated crazes, which respectively result in more ductile and brittle behavior of the polymer.25 A shift from combining both craze types to only fibrillated crazes and therefore more brittle behavior has been reported for SAN after annealing.25 As shown in Fig. 4, upon toughening SAN with PB-particles and hence creating ABS, void formation upon mechanical loading is enhanced by stress concentration around the rubber particles. This will allow many crazes to be formed simultaneously. Preceding voids, one first has cavity formation within the rubber particles,16,26,27 which leads to a pressure drop at the rubber–matrix interface. Subsequent to this cavitation, yielding occurs in the matrix material around the rubber particles.15,16,26,28 Upon increasing the load, fracture of rubber particles or debonding at the PB–SAN interface causes the formation of voids in the matrix material, which eventually leads to (conventional) matrix crazing.14
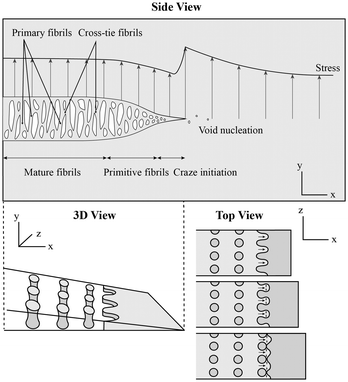 | ||
| Fig. 3 The general principle of craze formation and propagation in the absence of (rubber) particles (e.g. pure SAN; conventional crazing). The image of 3D and top view are based on the work of Kramer et al.,21 while the side view is based on the work of Estevez et al. and Van Krevelen and Nijenhuis.23,24 With rubber particles an analogous presentation is provided in Fig. 4. | ||
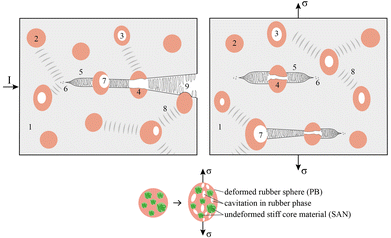 | ||
| Fig. 4 Top: Principle of crack and craze formation and shear yielding in rubber toughened thermoplastic polymers upon (left) impact and (right) tensile deformation with (1) matrix material, (2) rubber particle, (3) cavitation in a rubber particle, (4) broken rubber particle, (5) craze formation through matrix material (cf.Fig. 3), (6) void formation in matrix material near craze tip, (7) cavitation at rubber–matrix interface, (8) shear yielding through matrix material and (9) crack tip. Bottom: Example of the deformation behavior of a rubber particle with multiple cores made of stiff material, much like PB with SAN inclusions present in mABS. | ||
Interestingly, cavitation of rubber particles is reversible as this phenomenon occurs within the elastic deformation region.27 The tendency to initiate cavitation is mainly driven by a volume–strain-energy relation,15,27 with smaller rubber particles requiring a larger hydrostatic stress to overcome the cavitation threshold.27 Due to their restricted cavitation, small particles will often act as a reinforcing agent against craze propagation by shear banding instead of actually initiating crazes.5,29 Hence, particles smaller than 0.1–0.2 μm alone appear to be ineffective as toughening agents, while a small amount of large particles among many small ones immediately contributes to the toughening mechanism.30 It has been also highlighted that for increasing rubber particle sizes up to 3 μm, the elastic modulus of an ABS sample will decrease along with the stress at yield, while the strain at break and impact resistance will increase.5,6,30 The multicomponent nature of ABS can thus enable the occurrence of several failure mechanisms.
Next to size, the type of rubber particle will greatly affect the internal cavitation mechanism, going from the creation of one large void within homogeneous rubber particles, to the establishment of fibrillated voids in the shell of one-core rubber particles, and to many small voids between the filler and rubber in multiple core rubber particles (Fig. 4; bottom).15,31,32 This last type of particle occurs within mABS, where the multiple cores are made of SAN. Since the elastic modulus at room temperature of PB is about 1000 times smaller than the modulus of SAN,2 the stiff core in mABS rubber particles will not (or almost not) deform upon applying a load, as displayed in Fig. 4 (bottom).31
Overall the type, diameter and distribution of rubber particles in ABS thus characterize the size and volume of crazes which occur upon mechanical loading. In addition, the material properties of ABS are affected by the molecular properties, e.g. the chemical composition (% acrylonitrile, % butadiene, and % styrene),5 the (average) molar mass, which is known to be most important for the SAN phase,4 the degree of PB–SAN grafting,6,33 the degree of rubber crosslinking,4 and the presence of SAN inclusions within the dispersed rubber phase.2
The morphology and hence material behavior can also be affected by the processing technique. The effect of processing-induced orientation on the morphology and mechanical response of eABS has although not been investigated as such, since the many small PB-particle sizes (Fig. 2; top) are assumed to be rather insensitive to the flow behavior. For self-designed rubber-reinforced materials and HIPS, an increased impact toughness has been found if the rubber particles are oriented perpendicular to the direction of impact.31,34,35 This can be linked to their higher ability to initiate and terminate crazes in the transverse direction to the load.34
Interestingly, plastic deformation of the matrix material can become more relevant along the direction of the oriented rubber inclusions, while crack propagation in the transverse direction is impeded by their small thickness in that direction.31 This in turn causes localization of crazes, which eventually leads to cracking during tensile tests.34 However, for blends of polycarbonate (PC) and eABS with an average rubber particle size of 2 μm, the cavitation mechanism has been found to be the same whether tensile stress was applied in the direction perpendicular or parallel to the injection molded orientation.26
Notably, impact deformations are significantly faster than deformation and crazing upon tensile testing. Consistently, the amount of crazing strain in eABS and HIPS was established to decrease with increasing deformation rate.26,36
To the best of the authors’ knowledge, the effect of processing-induced orientation of PB-particles on the tensile toughness of mABS has although not yet been investigated, defining the scope of the present work. One grade of mABS is employed to eliminate the effect of differences in molecular properties on deviating material properties. We only deal with morphological variations, as a consequence of injection molding processing parameter variations, considering different geometries, various amounts of shear during processing and applying annealing or not.
It is shown that for elastic comparison a testing method with a scaled cross head velocity is needed and that small geometries are useful to study the pure relation of morphological variations and tensile properties. It is further demonstrated that the PB orientation and distribution have an influence on the tensile properties as well as annealing and surface roughness.
Materials and methods
mABS properties
The used polymeric material is mass polymerized Magnum 3404 acrylonitrile butadiene styrene (ABS) by Trinseo, DOW. More details of this ABS grade, retrieved from the polymer datasheet, can be consulted in Table 1.| Property | Value |
|---|---|
| Density (kg m−3) | 1050 |
Melt flow rate220°C,![[thin space (1/6-em)]](https://www.rsc.org/images/entities/char_2009.gif) 10 10![[thin space (1/6-em)]](https://www.rsc.org/images/entities/char_2009.gif) kg (g per 10 min) kg (g per 10 min) |
5.5 |
| Charpy notched23°C (kJ m−2) | 13 |
Tensile modulus1![[thin space (1/6-em)]](https://www.rsc.org/images/entities/char_2009.gif) mm min−1 (MPa) mm min−1 (MPa) |
2200 |
Tensile yield100![[thin space (1/6-em)]](https://www.rsc.org/images/entities/char_2009.gif) mm min−1 (MPa) mm min−1 (MPa) |
46 |
Sample types
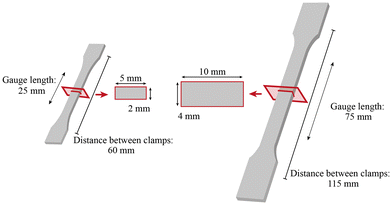
To investigate the effect of a different sample geometry on the deformation behavior of mABS tensile bars, both ISO 527 1A and 1BA specimens are investigated, with the most prominent measures displayed in Fig. 5.The 1A tensile bars are most commonly used to obtain material properties, while the use of 1BA tensile specimens experiences an increasing popularity thanks to production techniques like additive manufacturing and analysis procedures like environmental stress cracking resistance tests. The cross-section of the 1BA bar is four times smaller than the cross-section of the larger 1A bars. The deformable length, better known as the gauge length, is only three times smaller for 1BA bars compared to 1A bars, while the relative transition region between the thick section and the gauge length part is much larger in the smaller tensile specimens. Hence, it should be stressed that the geometry of 1BA bars is not a direct rescale of 1A bars.
Injection moulding sample production
Both ISO 527 1A and 1BA tensile bars were produced via injection molding with an Engel E-Victory 28t. By default, a steel mold and injection velocity of 60 mm s−1 were used. The 1BA bars were also produced with a velocity of 10 mm s−1 to enhance the amount of processing-related orientation in the narrow cavity. This low injection velocity is used for injection in a steel mold as well as in a mold manufactured by HP multi-jet fusion (MJF) using polyamide 11 (PA11).A so-called hybrid mold (HM) is employed in the latter case, which is known to cause slower cooling of the injected polymer due to its much lower thermal conductivity of 0.35 W m−1 K−1 compared to 19.66 W m−1 K−1 of a conventional steel mold.37 The slower dissipation of heat through the mold should alter the skin-shear-core flow behavior by a different shear during filling and a higher reorientation during cooling.38 This opens the door to study more morphologies by variations in processing parameters.
The mABS temperature from hopper to nozzle is defined by four zones with a temperature increase according to 220–230–240–250 °C. The steel mold temperature was set at 70 °C, while the MJF PA11 mold was not heated to avoid the deteriorated mechanical strength of the PA11 mold. Prior to injection molding, the ABS pellets were dried for 3 hours in an oven at 80 °C.
In an attempt of obtaining isotropic samples, some injection molded test bars were annealed in a similar way as reported by Song et al.39 The 1BA and 1A samples were heated at 110 °C for respectively 5 and 6 hours in an MP301-1-VK-S HML Haseneder Maschinenbau hot press. To avoid warpage due to internal relaxations, the samples were clamped between two plates at a distance of respectively 2 and 4 mm during the annealing process. Degradation of the material was minimized by performing the complete process under vacuum conditions at ca. 12 mbar.
Analysis
Morphological analysis on test bars was performed via scanning electron microscopy (SEM) with a Phenom desktop electron microscope. The test bars were cryogenically broken in liquid nitrogen in the parallel direction as compared to the polymer flow. Sample preparation for microscopic imaging was performed via etching out the PB phase with cyclohexane for 24 hours at 25 °C.5 Afterward, the samples were thoroughly rinsed with water and dried for 3 hours under vacuum in an oven at 60 °C. Lastly, a 15 nm gold layer was deposited on the samples to increase the resolution of the electron images.Note that only one specific location of the test bars has been investigated via SEM images (e.g. upper part of Fig. 7). Such images offer a good indication on the amount of orientation that results from different production techniques and post treatments. However, differences in flow behavior can also occur along the cavity cross section during injection molding, for example in the sharp corners, and might cause extra variations in the final orientation of the PB-particles. Moreover, the specific orientation of the PB-particles can vary considering their variation in height and thickness along the flow direction. Hence, the reported SEM images can correctly be used to affirm the morphology differences, but not to draw numerical conclusions from the relation between oriented zone thickness and mechanical data (e.g. tensile tests).
Tensile tests were performed on a Tinius Olsen 10ST tensile equipment with a 10 kN load cell and a Tinius Olsen vector extensometer. To ensure statistical relevance of the achieved results, 7 to 10 specimens were tested per variation in test bar type or test setting. The displayed graphs are those of the test specimen of which the results (Young's modulus, tensile strength and strain at break) are closest to the average found for the tested series of specimens. All data of the tensile tests can be consulted in the ESI (S1–S9).†
The annealed 1A test bars were used for the default tensile response, while annealed 1BA tensile samples were tested with a variety of testing velocities, which are based on the ratios of gauge lengths and grip distances. The velocity switch from modulus measurement to strength measurement happens at 0.3% extension (switch from test velocity 1 to test velocity 2 as mentioned in Table 2). The default crosshead velocity used to compare the tensile responses is 50 mm min−1. The required crosshead velocity for 1BA specimens was further optimized to achieve a comparable tensile response to 1A tensile bars. The most optimal test velocities for 1BA samples, based on the annealed samples, are subsequently applied to test the regular injection molded samples. More information about all used test velocities can be consulted in Table 2.
| Sample series | Test velocity 1 (mm min−1) | Test velocity 2 (mm min−1) |
|---|---|---|
| 1A_50 | 1 | 50 |
| 1BA_50 | 1 | 50 |
| 1BA_50-25/75 | 0.333 | 16.7 |
| 1BA_50-60/115 | 0.522 | 26.0 |
Results and discussion
The initial emphasis is on the mABS gradient morphology after injection molding for which the influence of annealing and injection velocity is studied. Attention is then shifted to the effect of the morphology on tensile properties. The effect of orientation is investigated for the 1BA specimens only, as the small geometry is most suited to investigate the impact of particle orientation. Also the effect of surface roughness is addressed to then jointly discuss the influence of PB orientation, annealing, and surface roughness on the morphological and mechanical properties.Influence of annealing and injection velocity on morphology
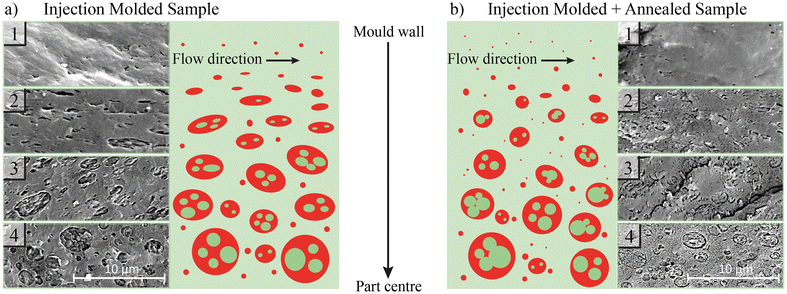
The morphology of injection-molded (IM) mABS parts displays a skin-shear-core layer gradient structure, as shown in Fig. 6(a) for the ISO 527 1BA tensile bar. A more detailed analysis reveals the presence of four zones, as indicated by the labels 1–4 and a schematic representation in the right panel of this subfigure.Immediately by the mold wall in zone 1, only the SAN phase exists, while a bit lower in zone 2, small PB-particles occur which have little to no SAN inclusions. The small sizes of the PB-particles or their absence in these zones can be assigned to the high shear rates during processing, which causes particles to deform or even breakup.40 Within zone 2, the small PB-particles are strongly oriented along the flow direction, while deeper towards the core in zone 3, larger but still oriented PB-particles with more SAN inclusions occur more frequently. The included SAN within the deformed PB-particles is also oriented along the polymer flow direction. The alignment of the PB-particles and their SAN inclusions along the flow direction in zone 2 and 3 can be assigned to high cooling and shear rates near the mold wall, creating a shear- and transition layer.41 A similar morphology was noted by Bärwinkel et al. for PC/ABS blends.33 In the actual core of the IM mABS part, which is visualized by zone 4, the PB-particles have a spherical shape, are the largest, and contain many unoriented SAN inclusions. Similar results are obtained for the other test bar.
After annealing the IM samples at 110 °C, a decrease in PB orientation in zones 2 and 3 can be achieved as visualized in Fig. 6(b) for the 1BA bar. Some PB is also detaching from the regular particles with subsequent migration into the SAN-matrix in the form of nanospheres. These small PB-particles will likely act as reinforcing agents against craze propagation by the shear band process.5,16 The SAN inclusions within the particles are also reoriented after annealing and sometimes even merged into larger fractions, resembling a single-core rubber morphology.
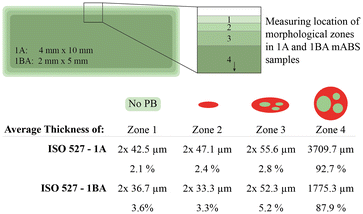
The thicknesses of the different layers in the two types of tensile bars (1A and 1BA) are studied as well focusing on the middle sections, as shown in Fig. 7. The thickness of the two outer zones in the 1BA tensile bars is smaller than the zones with similar morphology in 1A tensile bars. Zone 3 has a similar thickness in both types of test bars, causing an overall higher relative thickness of the oriented zones in 1BA bars compared to 1A bars. Hence, in general, the 1BA bars have a higher degree of orientation upon injection molding with the same injection velocity as 1A tensile bars, highlighting the relevance of test-bar variations in view of morphological gradient design.
Since annealing of mABS parts affects the morphology beyond PB phase orientation only (cf.Fig. 6a), extra unannealed ISO 527 1BA samples have been produced with a lower injection velocity of 10 mm s−1, considering different molds, to investigate the more pure effect of different degrees of PB orientation. The thicknesses of the different morphological zones can be consulted in Fig. 8. A distinct morphology with higher orientation is realized for the parts that were produced with an injection velocity of 10 mm s−1 in the steel mold (1BA-IM_10 mm s−1). Parts produced with the same injection velocity of 10 mm s−1 in a MJF PA11 mold (1BA-HM_10 mm s−1), also display a rather high amount of PB orientation, despite the long cooling time and thus larger opportunity for reorientation. This highlights the relevance of dedicated temperature control for phase transitions. The still high amount of orientation in 1BA-HM_10 mm s−1 samples can therefore be linked to the lower mold temperature, so that sufficiently fast cooling occurs to create a skin-shear morphology near the mold walls. Approaching the core region, however, the HM samples have similar or less orientation than the 1BA-IM-60 mm s−1 default specimens.
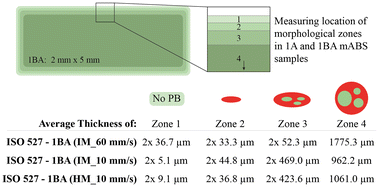 | ||
| Fig. 8 Thickness of different morphological zones in mABS 1BA tensile bars manufactured via injection molding with different injection speeds or mold types to obtain different degrees of orientation. | ||
Overall, applying low injection velocities in a thin steel mold causes a more pronounced orientation of PB-particles, and slow cooling in a mold cavity with low thermal conductivity has only a minor impact on the final orientation of the PB-particles.
Optimal tensile testing velocity for two specimen geometries
In the search of optimal tensile test settings to compare ISO 527 1A with 1BA specimens, the tensile results for the standard test velocity (Table 2) for 1A bars are first compared to the results for different test velocities for 1BA bars.The engineering stress–strain graphs of these tests are displayed in Fig. 9(a). The graphs show a lower yield strength and plastic flow stress for the 1A tensile samples, with respectively 38.2 ± 0.7 MPa and 33.1 ± 0.7 MPa (represented by the black line) compared to all 1BA sample types with on average respectively 41.9 ± 0.2 MPa and 36.3 ± 0.4 MPa (represented by the blue lines) at 25% strain, irrespective of the applied deformation rate. From the zoom-in, displayed in Fig. 9(b), it is clear that yielding occurs faster in the 1A tensile bar.
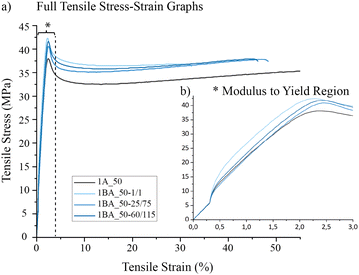 | ||
| Fig. 9 (a) Stress–strain graphs of annealed ISO 527 1A tensile bars tested at an elastic crosshead velocity of 50 mm min−1 compared to ISO 527 1BA tensile bars tested at velocities based on dimensional ratios of 1BA/1A (Table 2); (b) a zoom-in of the modulus to yield region. Tables with the specific averages can be consulted in the ESI S1–S4.† | ||
In any case, it is difficult to enable a one on one comparison of full tensile curves. Thickness measurements during tensile tests e.g. indicated that the relative reduction in cross section after yielding is more severe within 1A samples, compared to 1BA samples, with respectively 16.6% and 14.0% reduction at 25% tensile strain; the exact surface measurements are given in ESI (S10).†
Still, a strong compliance of the elastic mechanical behavior occurs upon using the same gauge length velocity. This can be seen in the zoom-in of the elastic region in Fig. 9(b). The gauge length deformation rate is obtained by multiplying the crosshead velocity with the ratio of gauge lengths of 1BA over 1A (25 mm/75 mm). For the crosshead velocity of 50 mm min−1 to test 1A samples, this results in a corrected test velocity of 16.7 mm min−1 for 1BA test specimens (entry 3 in Table 2). Since using the same gauge deformation rate offers equal elastic deformation behavior, this approach is chosen as the most ideal test setting for comparing ISO 527 1A and 1BA test bars.
Effect of annealing on tensile properties
The behavior from Fig. 9 in which annealing applied is similar for untreated IM samples, as shown in Fig. 10 comparing both unannealed and annealed data. Note that here the different yielding response is likely more linked to the stress transition intrinsic to the PB particle morphology (cf. the discussion of Fig. 6) and less to the sample geometry. | ||
| Fig. 10 Tensile response of injection molded (full line) vs. that with additional annealing (dashed line) ISO 527 (a) 1A (tested according to entry 1 in Table 2) and (b) 1BA tensile bars (tested according to entry 3 in Table 2). Different occurrence of crazes and deformation near the fracture surface (*) are displayed in (c and d) for ISO 527 1A tensile bars and along the gauge length for 1BA tensile bars in (e and f). Tables with the specific averages can be consulted in the ESI: S1, S3, S5 and S6.† | ||
Upon comparing Fig. 10(a) and (b), each covering one test bar type, lower yield stress and plastic flow stress are again present for the 1A samples. The exact differences in yield stress values are 38.1 ± 0.1 and 38.9 ± 0.1 MPa for respectively annealed and regular injection molded 1A samples, compared to 41.1 ± 0.4 and 41.5 ± 0.2 MPa for 1BA samples. A slightly decreased tensile strength and improved tensile toughness of annealed mABS (dashed lines) are also revealed, and the plastic flow upon necking becomes different for annealed and untreated IM samples, with a steady stress increase occurring for annealed mABS.
The slightly lower yield stress in annealed samples can be linked to the lower polymer and rubber orientation, which offers less resistance against chain slippage and cavitation to initiate sample yielding. A similar relationship has been highlighted for HIPS.34 After yielding however, when a neck is formed and a reduction in sample cross section occurs, a more obvious difference can be noted between the mechanical response of annealed and regular IM mABS samples. The plastic flow stress ‘plateau’ occurs sooner in the annealed samples, yet knows an increasing trend upon further elongation. This could be linked to the presence of many nanoscale rubber particles after annealing of mABS, as displayed on the right side in Fig. 6. Those small rubber particles are effective in reinforcing the matrix after sample yielding via the formation of shear bands which prevent crazes from becoming cracks.17,29 These shear bands can thus be combined with crazing,16,17 and aid in distributing the stress along the tensile direction, allowing crazes to be formed simultaneously along the entire gauge length in annealed samples. The latter can be confirmed for the investigated annealed mABS samples from the cross section analysis and visible distribution of stress whitening and crazes.
Furthermore, annealing of SAN has previously been proven to cause a change in craze character from the coexistence of homogenous and fibrillar crazes to only fibrillar ones.25 Crazes of the latter type are significantly smaller, which could explain the few visible crazes in annealed mABS samples on their surface as indicated by the ovals in Fig. 10(d) and (f). As displayed in Fig. 10(c) and (e), the crazes in the untreated injection molded test samples are thicker and more frequently occurring on the sample surface for both ISO 527 test bar types. The large crazes along the entire sample cross-section in 1BA-IM samples cause large stress concentrations where cracks can easily be created, causing final failure sooner and lowering the overall toughness upon tensile deformation. In the thicker injection molded 1A test bars, the crazes are not formed near the edges of the tensile samples. This can however not be linked to the oriented zones, as the thickness of the craze-free layer on the sides of the samples is much higher. It is therefore assumed that the occurrence of crazes in the center of the part is linked to an overall sink mark in the middle of the large tensile samples. The smaller cross-section causes a larger amount of stress in this region, promoting the more local initiation of crazes in 1A tensile specimens.
Overall it follows that the different craze behavior for annealed 1A tensile specimens with reoriented PB-phase positively contributes to mABS toughness, and even greatly improves the toughness of the thin annealed 1BA tensile samples.
Influence of injection velocity on tensile properties
As explained in Fig. 8, a variation in injection velocity for a conventional mould allows to obtain more pure variations in PB morphology. Upon analyzing the corresponding tensile stress–strain graphs, which are displayed in Fig. 11(a), polymer orientation and tensile toughness can indeed be linked. ISO 527 1BA samples which were injection molded with a velocity of 10 mm s−1 contain a much larger fraction of heavily oriented PB-phase as displayed by the thickness of oriented layers in Fig. 8. These specimens display a much larger elastic modulus and when produced in a steel mold, display a larger tensile stress as shown in the zoom-in in Fig. 11(b). A higher stiffness of mABS products can thus be achieved by enhancing the PB orientation along the deformation direction via applying high shear conditions during injection molding. In contrast, parts injection molded at 60 mm s−1 display a lower stiffness, corresponding to less oriented PB-particles.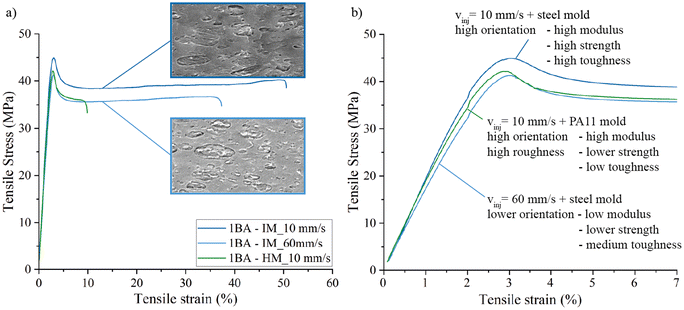 | ||
| Fig. 11 (a) Full tensile response of 1BA tensile bars injection molded in a steel mold at 60 mm s−1 (light blue line), in a steel mold at 10 mm s−1 (blue line) and in a MJF PA11 mold at 10 mm s−1 (green line) and (b) zoom-in of the elastic deformation area. Tables with the specific averages can be consulted in ESI (S7–S9).† | ||
The absolute changes in modulus and strength for the two IM samples, with respectively 2044 ± 207 MPa and 45.6 ± 0.4 MPa for 1BA-IM_10 mm s−1 samples vs. 1770 ± 145 MPa and 41.4 ± 0.8 MPa for 1BA-IM_60 mm s−1, are although less than expected based on the large difference in oriented layer thickness as displayed in Fig. 8. Hence, a pure effect of PB orientation is still not obtained but a clear contribution can be claimed.
The lower strengths in Fig. 11 comparing IM with HM parts, produced with the same injection settings, can be attributed to the larger surface roughness of parts manufactured in a MJF PA11 mold. A higher surface roughness offers more initiation sites for crazing along the surface of the test specimen. The enhanced crazing within HM test bars will subsequently cause earlier initiation of cracks, which leads to premature fracture of the specimens. For the samples produced in a steel mold for which the surface roughness is negligible, larger PB orientation results in a distinct higher tensile toughness and strain at break. A similar behavior has been reported for parts with different degrees of orientation of salami-PB-particles in HIPS.34
Connecting morphology and tensile properties: influence of annealing, process-based orientation and surface roughness
As shown in Fig. 6–11, tuning the processing settings regarding shear and cooling affects the morphology (e.g. orientation) of PB particles within mABS parts. These morphological deviations induce a different mechanical response, linked to different initiation thresholds and propagation characteristics of crazing. These insights on processing related mABS anisotropy call for attention when using this material, since it might cause unexpected part performance when transitioning from the more conventional eABS to mABS.An overview of the relations between morphology, crazing and mechanical response is given in Fig. 12, differentiating between applying annealing or not, (clear) orientation control by an injection velocity variation, and the creation of surface roughness by a geometry variation.
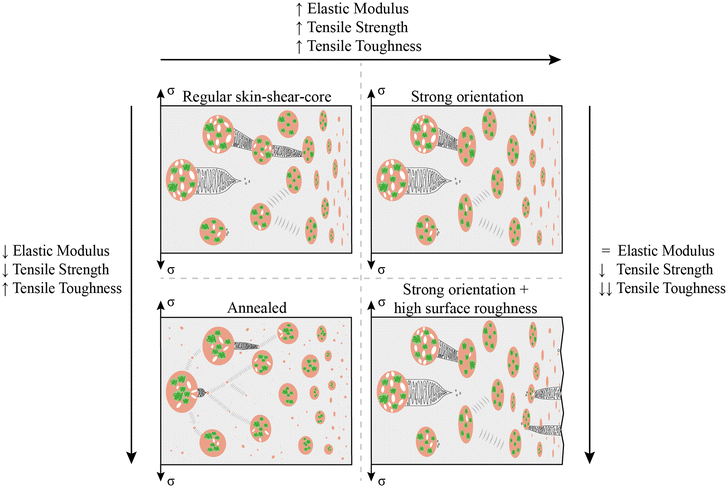 | ||
| Fig. 12 Overview of different degrees of crazing and crack propagation, and tensile property variation through mABS samples with different morphological characteristics. | ||
It follows that large unoriented PB-particles exhibit the highest tendency to deform upon application of stress, leading them to experience internal void formation, which contributes to elastic deformation of the overall sample. Hence, parts with a larger amount of unoriented rubber particles will have a lower elastic modulus (top left).
In annealed parts (bottom left), PB-nanoparticles in turn enhance the formation of shear bands within the SAN matrix, which helps to distribute stress along the sample. This enables the crazes to spread very fast along the full deformable zone of the sample, improving tensile toughness. Oppositely, IM samples without post treatment display thicker crazes on the sample surface, which evolve into cracks more easily.
If high amounts of flow-induced orientation are present in mABS parts (top right), increased tensile stiffness, strength and toughness can be achieved along the flow direction. This can be related to the ability of oriented PB-particles to create and prevent the extension of multiple crazes, due to which an overall higher amount of energy can be absorbed within the sample.
Finally, tensile bars with a large surface roughness (bottom right) will experience early failure, due to premature craze and crack initiation at the sample surface, irrespective of the PB-orientation.
Conclusions
A method has been designed to perform comparable ABS (HIPS) tensile tests using ISO 527 1A and 1BA dog bone samples for which a relation between tensile sample gauge length and cross head velocity holds. This allows comparing elastic deformation, with upon yielding at which plastic deformation is initiated, 1A tensile bars exhibiting a higher reduction in cross-section upon necking compared to 1BA bars, resulting in an overall higher tensile toughness of the latter type.A gradient behavior of the mABS part morphology is observed. IM parts were found to display skin-shear-core morphology. Small and heavily oriented PB-particles occur near part edges, while larger less oriented, more spherical PB-particles can be found in the center of the parts.
IM parts which are produced with lower injection velocities and therefore high amounts of shear display much thicker layers of heavily oriented PB-particles. Annealing of both types of tensile bars could successfully remove most of the flow-induced orientation of the rubber particles. It although also led to a change in the PB gradient morphology, since a small fraction of the rubber dissolved into the SAN matrix, forming PB-nanoparticles, while the included SAN within the rubber could reorient and merge together.
Generally, a larger amount of orientation within the mABS samples results into superior tensile properties by a significantly increased stiffness, strength, and toughness. If the orientation is combined with a high surface roughness of the samples however, crazing at the sample edges will decrease the strength and toughness considerably. The presence of PB-nanoparticles after annealing optimizes the stress distribution along the sample length, which results into an increased strain at break. Due to the strong dependence of processing settings on the final mechanical properties of mABS, it should be emphasized that mechanical results of this material should always be considered in relation to the actual processing.
Within follow-up research, more in depth analysis and imaging of the craze propagation via transmission electron microscopy (TEM) is targeted. Also the link between impact toughness and morphological orientation will be investigated. Furthermore, obtaining different degrees of orientation via extruded sheets where the tensile direction can be chosen in multiple angles pertaining to the flow direction could give new insights on the effect of orientation on the tensile behavior.
Data availability
The data supporting this article have been included as part of the ESI.†Conflicts of interest
There are no conflicts to declare.References
- Acumen Research and Consulting, Acrylonitrile Butadiene Styrene Market Size – Global Industry, Share, Analysis, Trends and Forecast 2023–2032.
- G. F. Giaconi, L. Castellani, C. Maestrini and T. Riccò, Polymer, 1998, 39, 6315–6324 CrossRef CAS.
- X. F. Xu, R. Wang, Z. Y. Tan, H. D. Yang, M. Y. Zhang and H. X. Zhang, Eur. Polym. J., 2005, 41, 1919–1926 CrossRef CAS.
- M. Dillon and M. Bevis, J. Mater. Sci., 1982, 17, 1903–1914 CrossRef CAS.
- J. H. H. Rossato, H. G. Lemos and G. L. Mantovani, J. Appl. Polym. Sci., 2019, 47075 CrossRef.
- H. Yamane, Z. I. Maekawa and H. Sakano, Mater. Sci. Res. Int., 2000, 6, 104–109 CAS.
- C. Maestrini, K. Pisoni and H. H. Kausch, J. Mater. Sci., 1996, 31, 3249–3257 CrossRef CAS.
- B. Pourabbas and H. Azimi, J. Compos. Mater., 2008, 42, 2499–2522 CrossRef CAS.
- R. Fiorio, D. R. D'hooge, K. Ragaert and L. Cardon, Polymers, 2019, 11, 25 CrossRef.
- H. Rodríguez-Tobías, G. Morales, O. Rodríguez-Fernández and P. Acuña, J. Appl. Polym. Sci., 2013, 127, 4708–4718 CrossRef.
- J. S. Reinaldo, L. M. Pereira, E. S. Silva, T. C. P. Macedo, I. Z. Damasceno and E. N. Ito, Polym. Test., 2020, 82, 106265 CrossRef CAS.
- F. L. Figueira, P. Reyes, M. Edeleva, Y. W. Marien, Y.-Y. Wu, Y.-N. Zhou, Z.-H. Luo, P. H. M. Van Steenberge and D. R. D'hooge, Chem. Eng. J., 2024, 481, 148349 CrossRef CAS.
- C. X. Zhu, J. Jin, Y. Y. Wu, F. L. Figueira, M. Edeleva, P. H. M. Van Steenberge, D. R. D'hooge, Y. N. Zhou and Z. H. Luo, AIChE J., 2023, 70, e18297 CrossRef.
- A. C. Garg and Y. W. Mai, Compos. Sci. Technol., 1988, 31, 179–223 CrossRef CAS.
- C. Fond, A. Lobbrecht and R. Schirrer, Int. J. Fract., 1996, 77, 141–159 CrossRef CAS.
- A. Lazzeri and C. B. Bucknall, J. Mater. Sci., 1993, 28, 6799–6808 CrossRef CAS.
- L. Morbitzer, D. Kranz, G. Humme and K. H. Ott, J. Appl. Polym. Sci., 1976, 20, 2691–2704 CrossRef CAS.
- A. H. Windle, A Metallurgist's Guide To Polymers, Elsevier B.V., 4th edn, 1996 Search PubMed.
- H. G. H. Van Melick, O. F. J. T. Bressers, J. M. J. Den Toonder, L. E. Govaert and H. E. H. Meijer, Polymer, 2003, 44, 2481–2491 CrossRef CAS.
- R. A. C. Deblieck, D. J. M. Van Beek, K. Remerie and I. M. Ward, Polymer, 2011, 52, 2979–2990 CrossRef CAS.
- E. J. Kramer, Polym. Eng. Sci., 1984, 24, 761–769 CrossRef CAS.
- A. S. Argon, Philos. Mag., 1973, 28, 839–865 CrossRef CAS.
- R. Estevez, M. G. A. Tijssens and E. Van Der Giessen, J. Mech. Phys. Solids, 2000, 48, 2585–2617 CrossRef CAS.
- D. W. Van Krevelen and K. Te Nijenhuis, Properties of Polymers, 2009, pp. 383–503 Search PubMed.
- G. H. Michler, J. Mater. Sci., 1990, 25, 2321–2334 CrossRef CAS.
- R. A. Bubeck, D. J. Buckley Jr., E. J. Kramer and H. R. Brown, J. Mater. Sci., 1991, 26, 6249–6259 CrossRef CAS.
- C. Fond, J. Polym. Sci., Part B: Polym. Phys., 2001, 39, 2081–2096 CrossRef CAS.
- J. P. Dear, Polym. Test., 2000, 19, 569–578 CrossRef CAS.
- M. E. Fowler, H. Keskkula and D. R. Paul, J. Appl. Polym. Sci., 1988, 35, 1563–1571 CrossRef CAS.
- M. Merlotti, M. Vighi and E. Polimeri, J. Mater. Sci., 1992, 27, 5994–6016 CrossRef.
- J. Wang, X. Zhang, L. Jiang and J. Qiao, Prog. Polym. Sci., 2019, 98, 101160 CrossRef CAS.
- G. H. Michler and H. H. K. B. Von Schmeling, Polymer, 2013, 54, 3131–3144 CrossRef CAS.
- S. Bärwinkel, A. Seidel, S. Hobeika, R. Hufen, M. Mörl and V. Altstädt, Materials, 2016, 9, 659 CrossRef.
- S. Zhang, S. Zhu, X. Feng, K. Han, Q. Huan, J. Song, Y. Ma and M. Yu, RSC Adv., 2013, 3, 6879–6887 RSC.
- A. Alfarraj and E. Bruce Nauman, Polymer, 2004, 45, 8435–8442 CrossRef CAS.
- M. A. Dundar and G. S. Dhaliwal, Polym. Test., 2020, 89, 106624 CrossRef CAS.
- E. Fernandez, M. Edeleva, R. Fiorio, L. Cardon and D. R. D’hooge, Sustainability, 2022, 14, 877 CrossRef CAS.
- E. Fernandez, M. Edeleva, H. Ohnmacht, R. Fiorio, D. R. D'hooge and L. Cardon, PPI, 2021, pp. 51–58 Search PubMed.
- P. Song, A. R. Trivedi and C. R. Siviour, Polym. Test., 2023, 121, 107986 CrossRef CAS.
- I. Charfeddine, J. C. Majesté, C. Carrot and O. Lhost, Polymer, 2020, 193, 122334 CrossRef.
- S. Hammani, N. Moulai-Mostefa, P. Samyn, M. Bechelany, A. Dufresne and A. Barhoum, Materials, 2020, 13, 926 CrossRef CAS PubMed.
Footnote |
| † Electronic supplementary information (ESI) available. See DOI: https://doi.org/10.1039/d4lp00238e |
| This journal is © The Royal Society of Chemistry 2024 |

