
 Open Access Article
 This Open Access Article is licensed under a Creative Commons Attribution-Non Commercial 3.0 Unported Licence
A novel triphenylamine based push–pull fluorophore bearing a 2-thiohydantoin unit for toxic Hg2+ ion detection: exploring its potential for live cell imaging†
Pratiksha P.
Gawas
 a,
Buthanapalli
Ramakrishna
b,
Rajesh
Pamanji
c,
Joseph
Selvin
c and
Venkatramaiah
Nutalapati
*a
a,
Buthanapalli
Ramakrishna
b,
Rajesh
Pamanji
c,
Joseph
Selvin
c and
Venkatramaiah
Nutalapati
*a
aFunctional Materials Laboratory, Department of Chemistry, Faculty of Engineering and Technology, SRM Institute of Science and Technology, Kattankulathur, Tamil Nadu 603203, India. E-mail: nvenkat83@gmail.com; venkatrv1@srmist.edu.in
bDivision of Chemistry, Vellore Institute of Technology (VIT), Chennai, Tamil Nadu 632014, India
cDepartment of Microbiology, Pondicherry University, Puducherry, 605014, India
First published on 22nd November 2023
Abstract
A novel fluorescent chemosensor (TPA-2TH) containing triphenylamine (TPA) appended in conjugation with 2-thiohydantoin (2TH) is developed and confirmed by various analytical techniques like FT-IR spectroscopy, NMR spectroscopy, HR-MS and single crystal X-ray diffraction (SC-XRD). The crystal structure analysis revealed a propeller-shaped TPA unit and a co-facial herringbone packing arrangement stabilized by N–H⋯S, N–H⋯O and C–H⋯O in the crystal lattice. TPA-2TH exhibited a strong absorption band at ∼431 nm and emitted a yellow-green fluorescence at λmax = 522 nm in THF, attributed to an efficient charge-separated state resulting from ICT between TPA and 2TH. A solvatochromic effect was observed with a red shift in the emission wavelength as the polarity of the solvent increased. TPA-2TH showed unprecedented selectivity with turn-off fluorescence upon complexation with diamagnetic Hg2+ ions, attributed to an increase in the spin–orbit coupling and a weakened ICT effect caused by Hg2+ binding. The addition of Hg2+ to TPA-2TH resulted in the formation of a 2![[thin space (1/6-em)]](https://www.rsc.org/images/entities/char_2009.gif) :1 complex (TPA-2TH–Hg2+), confirmed by the coordination of a sulphur atom of TPA-2TH with Hg2+ ions, as evidenced by 1H NMR spectroscopy and Job's plot analysis. A linear relationship between the fluorescence intensity of TPA-2TH and the concentration of Hg2+ ions is observed with a LOD of 3.3 pM. Furthermore, the toxicological effect of TPA-2TH is explored in zebrafish larvae and embryos to provide a sensitive bio-indicator for metal ion contamination and fluorescence imaging. This comprehensive approach combining fluorescence quenching and behavioural toxicity assessment offers a practical method for evaluating metal ion contamination and its potential toxic effects on aquatic organisms with acute behavioural toxicity end points using adult zebrafish.
:1 complex (TPA-2TH–Hg2+), confirmed by the coordination of a sulphur atom of TPA-2TH with Hg2+ ions, as evidenced by 1H NMR spectroscopy and Job's plot analysis. A linear relationship between the fluorescence intensity of TPA-2TH and the concentration of Hg2+ ions is observed with a LOD of 3.3 pM. Furthermore, the toxicological effect of TPA-2TH is explored in zebrafish larvae and embryos to provide a sensitive bio-indicator for metal ion contamination and fluorescence imaging. This comprehensive approach combining fluorescence quenching and behavioural toxicity assessment offers a practical method for evaluating metal ion contamination and its potential toxic effects on aquatic organisms with acute behavioural toxicity end points using adult zebrafish.
1. Introduction
Donor–Acceptor (D–A) organic molecules with π-conjugated structures possessing electron-rich donor (D) groups linked to an acceptor (A) through an olefinic core have attracted interest from academic and technological researchers for decades. However, this is still a highly active area of research focused on the development of novel organic molecules with interesting properties like enhanced charge transfer (CT), tunable energy levels, broad absorption and emission spectra, high charge mobility, nonlinear optical properties, enhanced light-harvesting efficiency, thermal stability and processing ability. These intriguing properties of D–A molecules make them highly sought-after in the scientific community, driving on-going research and exploration into their synthesis, characterization and application in a wide range of fields like in developing solvatochromic probes,1–4 nonlinear optics,5 chemosensors,6–8 electro-optics,9,10 photochromic11 and piezo-chromic materials10 and as active layers in photovoltaics.12,13In a D–A system, the intramolecular charge transfer (ICT) character depends on the HOMO–LUMO (highest occupied and lowest unoccupied molecular orbital) gap, so that its optical properties can be tailored in three ways, i.e. (i) incorporating different donor and acceptor units and assuring efficient interactions between them, (ii) extension and spatial arrangement of the π-bridge and (iii) planarization of the entire molecule.14–16 Hence, modifying the structure of donors along with the acceptor unit offers the possibility of tuning their electronic and photophysical properties. D–A molecules have been extensively used as chemical sensors due to their tunable photophysical properties. In the excited states, D–A molecules display the ICT phenomenon. Changes in the surrounding microenvironment can quickly alter the CT properties. In chemosensors, the acceptor/donor unit is the recognition site that binds to metal ions resulting in the perturbation of the ICT state. The subsequent electronic effects are reflected as changes in the wavelength maxima of the absorption and fluorescence spectra of the D–A system. Huang's group developed a D–A–D system for visual Hg2+ ion detection that consists of an ethynyl unit connected to the center of a naphthyridine molecule by two di(hydroxyethyl)aniline moieties at the terminal.17 Debdas et al. reported on a dimethyaminophenyl and diazine-based D–A system for Ag+ ion detection.18 Sreejith and co-workers reported a D–A–D based fluorophore interconnected through a vinylic bridge for ratiometric sensing and imaging of Zn2+ ions in biological media.19 Thilagar et al. designed and developed a fluorophore using triphenylamine (TPA) as a donor connected to two different acceptor groups, i.e., BODIPY and diaryl boryl, on either side, which exhibited two characteristic ICT states showing the corresponding absorption at different energy levels.20 Many potential colorimetric and fluorescent Hg2+ ion chemosensors have been reported.7,21–41 However, developing a simple probe that can monitor global contaminants like hazardous metal ions,23–29 toxic anions, biomolecules,42–44etc. at permissible levels remains challenging. Generally, the Hg2+ ion prefers to coordinate with ligands that have nitrogen, oxygen or sulphur atoms. 2TH has the ability to act as a chelator for cations, enabling the detection of various anthropogenic molecules and ions. This capability is due to the presence of sulphur and nitrogen atoms in the 2TH ring.45 It contains both amide and thioamide groups, which act as both proton acceptors and donors. This structural feature allows for the formation of diverse hydrogen bonding networks in its crystal structure.45,46 As a result of our interest in designing and developing a new fluorescence sensor, we have developed a TPA and 2TH based chemosensor (TPA-2TH) with TPA as a donor and the 2TH unit acting as an Hg2+ ion chelator and acceptor. In this report, we aim to develop a novel TPA-2TH molecular probe through Knovenagel condensation between TPA aldehyde and 2TH. The synthesized TPA-2TH is found to be highly fluorescent, showing distinct quenching in fluorescence upon complexation with diamagnetic Hg2+ ions. Hg2+ binding to TPA-2TH would decrease the electron-donating ability of TPA, thus weakening the ICT effect in the fluorophore. This fluorescent probe exhibited excellent solvatochromic behaviour, high selectivity, high sensitivity and fluorescence change response towards Hg2+. Furthermore, toxicological studies of TPA-2TH are caried out to apply it as a bio-indicator for metal ion contamination using zebrafish larvae and embryos as a model system along with acute behavioural toxicity end points using adult zebrafish.
2. Experimental section
2.1 Chemicals and materials
All chemicals were purchased from Sigma Aldrich and the solvents used were of AR grade. Double distilled water obtained from a MilliQ system (>18.2 MΩ) was used in the spectroscopic study. All experiments involving zebrafish for the purpose of live cell imaging were conducted in compliance with relevant laws and institutional guidelines (PU/IAEC/2023-24/314). The experimental protocols were approved by Pondicherry University, which oversees and ensures the ethical treatment of animals in research. Efforts were also made to minimize the number of fish used during the course of the experiments.2.2 Measurements
FT-IR (Fourier-transform infrared) spectra were recorded using a Shimadzu IR Tracer-100 in the ATR mode. 1H and 13C NMR spectra were recorded on a Bruker 500 MHz spectrometer, whereas the chemical shifts (δ) and coupling constants (J) were reported in parts per million (ppm) and Hz, respectively. ESI-MS spectra were acquired using a 6230B Time of Flight (TOF) system, Agilent technology. Single-crystal X-ray experiments were performed on an Oxford Xcalibur (Mova) diffractometer equipped with an EOS CCD detector and a microfocus sealed tube using Mo Kα radiation (λ = 0.71073 Å). Data collection was made at 100 K and the structure is solved using SHELXS,47 and OLEX2 (version 1.2)48,49 was used to solve and refine the crystal structures. All non-hydrogen atoms were refined anisotropically. Hydrogen atoms on heteroatoms were located from difference electron density maps, and all C–H atoms were fixed geometrically using the HFIX command. The WinGX package was used for final refinement, production of CIFs and the crystallographic table, and Oak Ridge Thermal Ellipsoid Plot-3 (ORTEP-3) was used for structure visualization and making the molecular representations. The packing diagram was analyzed using Mercury 2020.2.0. The Hirshfeld analysis was performed using Crystal Explorer 21.5.50 Thermogravimetric analysis (TGA) was carried out on an SDT Q600 thermal analyzer under a nitrogen atmosphere at a heating rate of 10 °C min−1. Differential scanning calorimetry (DSC) of the compounds was carried out with a DSC 214 Polyma-NETZSCH thermal analyser in the temperature range 35–600 °C with a heating rate of 10 °C per minute under nitrogen gas flow. Absorption spectra in solution and thin films were recorded using a UV-Visible (Agilent Cary 60) spectrophotometer. Steady state emission spectra were recorded using an Edinburgh FLS1000 spectrofluorometer. Time-resolved fluorescence emission decay was obtained using the time-correlated single photon counting (TCSPC) technique with a 450 nm nanosecond LED as the excitation source.2.3 Synthesis
![[double bond, length as m-dash]](https://www.rsc.org/images/entities/char_e001.gif) S), 165.47 (–CO), 125.07–151.33 (aromatic carbon), 141.77 (2TH carbon), 116.97 (ethylene carbon); HR-MS: calculated for C22H17N3OS (m/z): 371.1092; found: 372.1230 [M + H]+.
S), 165.47 (–CO), 125.07–151.33 (aromatic carbon), 141.77 (2TH carbon), 116.97 (ethylene carbon); HR-MS: calculated for C22H17N3OS (m/z): 371.1092; found: 372.1230 [M + H]+.
2.4 Zebrafish studies
To determine the toxic effects of TPA-2TH on the development of zebrafish, a range of 10, 20, 40, 60, 80, and 100 μg mL−1 concentrations were tested on 4 hpf (hours post fertilized) zebrafish embryos in a 24 well plate by following OECD 236, Fish embryo toxicity test guidelines (OECD236, 2013) for a duration of 96 h, analysed for the % of mortality and % of hatching rate during exposure tenure. In a separate set of experiments, 72 hpf larvae were used to quantify the fluorescence quenching. On day one, larvae were treated with a 10 μg mL−1 concentration of TPA-2TH along with the control and solvent control. On the next day, 10 μg mL−1 HgCl2 and CuCl2 were added to the same plate and kept for incubation. On the third day, the fluorescence images were collected using a Nikon Eclipse Ti2, New York, USA and the fluorescence was quantified using Image J software. Furthermore, the change in fluorescence before and after the addition of HgCl2 and CuCl2 was calculated. To study the effect of TPA-2TH on the behaviour, we conducted an acute behavioural toxicity assay by using adult zebrafish. A small glass tank with a dimension of 15 × 12 × 9 cm filled with 1 L of water with a single healthy fish and 10 mg L−1 of TPA-2TH was used. The concentration was selected based on the same concentration used to study the fluorescence quenching in zebrafish larvae. The experiment was repeated thrice and behavioural end points were recorded.3. Results and discussion
TPA-2TH was synthesized via a one pot Knoevenagel condensation reaction between 2TH and 4-(diphenylamino)benzaldehyde (TPA-CHO) under acidic conditions as described in Scheme 1. The ensuing compound TPA-2TH was purified by column chromatography and characterized by FT-IR, 1H and 13C NMR, HR-MS and single-crystal XRD (SC-XRD) studies. The detailed characterization is provided in the ESI† (Fig. S1–S4). The functionality –CO and –CS of the 2TH ring was observed at ∼1718 and ∼1645 cm−1, respectively in FT-IR spectra. The peak at ∼3169 cm−1 was assigned to –NH of the 2TH unit (Fig. S1, ESI†). Two different –NH protons in the 1H NMR spectrum (Fig. S2, ESI†) of TPA-2TH resonated at δ 12.28 and 11.99 ppm due to the different chemical environments around them. The aromatic protons of the TPA moiety appeared in the range δ 6.82–7.63 ppm. The peak at δ 6.41 ppm corresponds to the ethylene proton conjugated between TPA and the 2TH unit. 13C NMR (Fig. S3, ESI†) and HR-MS studies further substantiated the formation of TPA-2TH. HR-MS spectra (Fig. S4, ESI†) of TPA-2TH showed the molecular ion peak at m/z 372.1230 [M + H]+ along with other fragmented peaks, which are in excellent agreement with the respective formulations.
 | ||
| Scheme 1 Synthetic route for TPA-2TH. | ||
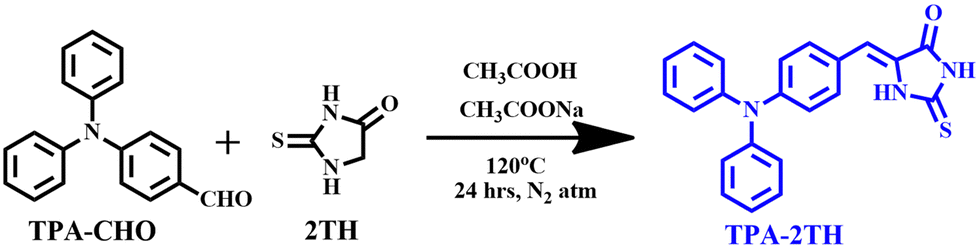
The structure of TPA-2TH was further confirmed by SC-XRD analysis. Plate-shaped orange-yellow coloured crystals were obtained from a solvent mixture of toluene/acetonitrile (3:2, v/v) using a slow solvent evaporation technique at ambient temperature51 (Fig. 1). TPA-2TH (CCDC 2278085†) crystallizes in the monoclinic crystal system with a P21/n space group and shows a co-facial herringbone molecular arrangement in the crystal lattice. Oxygen, sulphur and –NH groups of TPA-2TH are connected by strong dimeric N–H⋯S and N–H⋯O hydrogen bonds on either side with bond lengths of 2.424 Å and 1.926 Å, respectively, along with a C–H⋯O intermolecular interaction distance of 2.575 Å. The molecular arrangement is also stabilized by ethane H⋯H-aromatic (2.336 Å), CO⋯H-aromatic (2.575 Å), N–H⋯CO (2.831 Å) and CS⋯C-aromatic (3.397 Å) interactions. The π–π interaction distance between the aromatic ring (connected to ethane) and the 2TH ring appears to be 4.765 Å. Furthermore, the intramolecular C–H⋯π interaction distances among three overcrowded phenyl rings of 3.053 Å, 3.060 Å and 3.148 Å were also observed. The three phenyl rings enabled a more twisted torsional angle of 140.46° among them and a twisted torsional angle of 149.80° between the middle phenyl ring and the 2TH moiety. The detailed crystallographic data are summarized in Table 1. Fig. S5 (ESI†) depicts the Hirshfeld surfaces of TPA-2TH mapped across a dnorm range of 0.5 to 1.4. The prominent interactions between –NH and –CO oxygen atoms are shown by the bright red spots on the dnorm map. In contrast, the blue patches represent all weaker intermolecular interactions with more considerable distances (Fig. S5a, ESI†). Two prominent sharp spikes in the 2D fingerprint plot represent the O⋯H intermolecular interaction, while the intermolecular contact involving S⋯H is indicated by the two brief sideways spikes (Fig. S5b, ESI†). Fig. S5c (ESI†) illustrates the contribution of individual intermolecular interactions based on a 2D fingerprint plot of Hirshfeld analysis which revealed that H⋯H (42.8%) and C⋯H (26.1%) intermolecular interactions are primarily responsible for the molecular packing. The contributions of S⋯H, N⋯H, and O⋯H are found to be 12.2, 8.9 and 3.6%, respectively. Additionally, 3.1% of the area accounts for π⋯π interactions.
 | ||
| Fig. 1 (a) Single crystal X-ray structure of TPA-2TH with 30% of the thermal ellipsoids. (b) Supramolecular arrangement of TPA-2TH in a crystal lattice. (c) Depiction of the crystal packing of the dimeric hydrogen bonding with N–H⋯S, N–H⋯O and C–H⋯O hydrogen bonds followed by C–H⋯π intramolecular interactions. | ||
| Compound identification code | TPA-2TH |
| CCDC no. | 2278085 |
| Formula | C22H17N3OS |
| Formula weight | 371.44 |
| Temperature (K) | 100.00(10) |
| Crystal system | Monoclinic |
| Space group | P21/n |
| a (Å) | 9.4332(7) |
| b (Å) | 20.7152(16) |
| c (Å) | 9.7429(7) |
| α (°) | 90.00 |
| β (°) | 109.03(8) |
| γ (°) | 90.00 |
| Volume (Å3) | 1799.8(2) |
| Z | 4 |
| Density, ρcalc (g cm−3) | 1.371 |
| Abs. coeff., μ (mm−1) | 0.197 |
| F (000) | 776 |
| 2θ range for data collection (°) | 3.269 to 24.998 |
| Crystal size (mm3) | 0.25× 0.18 × 0.12 |
| Radiation | MoKα (λ = 0.71073) |
| Index ranges | −11 ≤ h ≤ 11, −24 ≤ k ≤ 24, −11 ≤ l ≤ 11 |
| Reflections collected | 20673 |
| Independent reflections | 2452 [Rint = 0.1208, RSigma = 0.0971] |
| Data/restraints/parameters | 2452/0/244 |
| Goodness-of-fir on F2 | 1089 |
| Final R indexes [I ≥ 2σ(I)] | R 1 = 0.0673, wR2 = 0.1104 |
| Final R indexes [all data] | R 1 = 0.1023, wR2 = 0.1241 |
To examine the thermal characteristics of TPA-2TH, differential scanning colorimetric (DSC) and thermal gravimetric analysis (TGA) measurements were performed. The DSC results displayed high thermal stability of TPA-2TH up to 355 °C with a melting point at 254 °C (Fig. S6a, ESI†). The decomposition of TPA-2TH occurred in two stages, as represented in Fig. S6b (ESI†). The initial weight loss of ∼6% started at 175 °C while a significant decomposition of ∼24% occurred at 323 °C attributed to the decomposition of the 2TH unit.
3.1 Photophysical properties
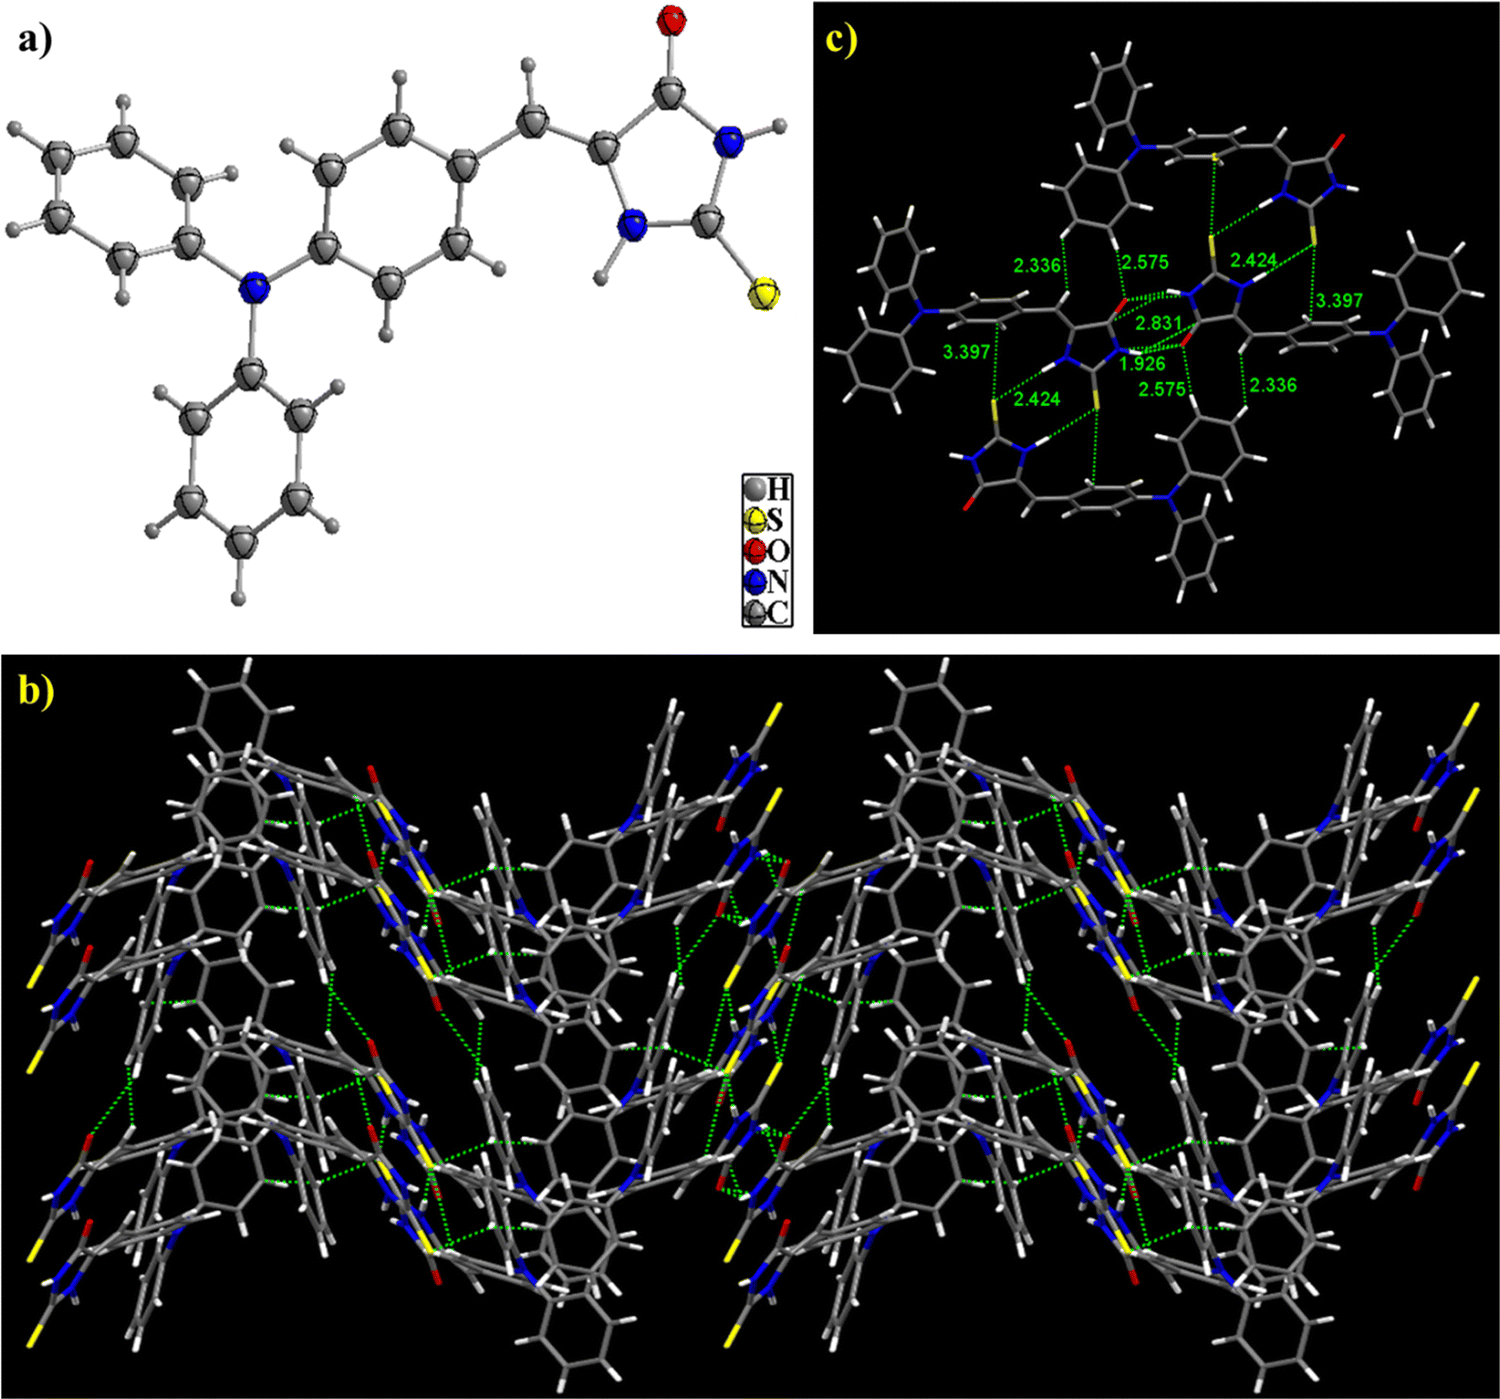
The photophysical properties of TPA-2TH were investigated by UV-Visible and photoluminescence (PL) experiments in solution and solid state methods at room temperature. Fig. 2(a) represents the absorption and emission spectra of TPA-2TH in THF. They show an intense absorption band at ∼431 nm and other small absorption bands at ∼217 and ∼299 nm, respectively. The most intense absorption peak at 217 nm corresponds to the TPA core and the weak absorption band at 299 nm is assigned to π → π* transitions. The absorption band at λmax ∼431 nm is ascribed to the efficient charge separated state produced by ICT between the TPA donor part of the molecule and the acceptor end group, i.e., 2TH. However, in the thin film, the absorption spectra exhibited two broad red-shifted peaks at 323 and 460 nm. Upon excitation at 431 nm, TPA-2TH showed a strong bluish-green emission in THF at 522 nm, predominantly due to ICT with a quantum yield (Φf) of 30%. Interestingly, the solid state emission spectra of TPA-2TH showed a red shift of ∼76 nm compared to its emission in THF exhibiting an orange-red emission at ∼598 nm (Fig. 2(b)).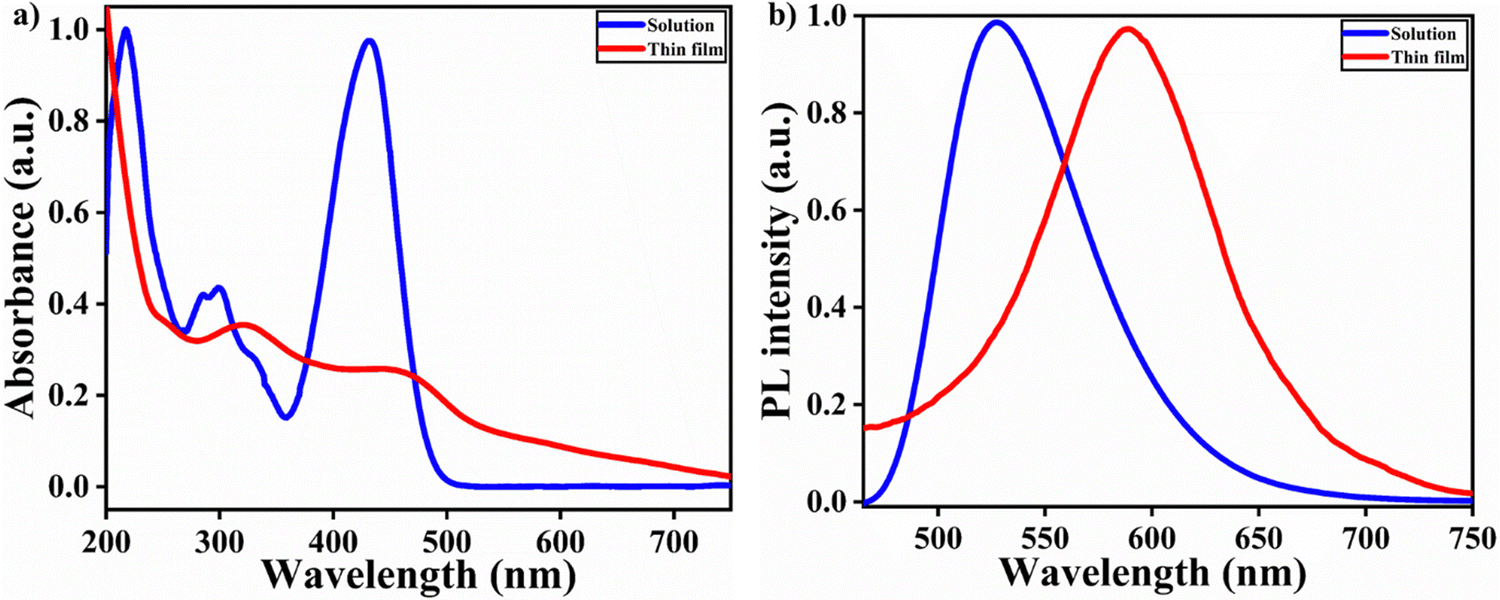 | ||
| Fig. 2 Absorption (a) and emission spectra (b) of TPA-2TH in solution and in a thin film. | ||
It is very well known that on exciting a fluorophore with a D–A interaction system, ICT takes place.52 Thus, to clearly investigate ICT, the solvatochromic effect of TPA-2TH was studied in different organic solvents of varying polarities, since the fluorescence derived from ICT depends intensely on the polarities of solvents. The absorption spectra of TPA-2TH in different solvents did not show any significant changes in λmax (430 nm in THF to 436 nm in methanol). A slight positive solvatochromism was observed in the absorption spectra (Fig. S7, ESI†). λmax showed a red shift in polar solvents in comparison to non-polar solvents. This observation reveals that the electronic excitation increases the molecule's dipole moment and the directions of the ground and excited state dipoles are similar.53,54
Unlike the absorption spectrum with a negligible effect (Fig. S7a, ESI†), varying solvent polarities exerted a dramatic influence on the emission of TPA-2TH as depicted in Fig. 3. On increasing the solvent polarity, a significant red shift in emission maxima (λem) was observed. λem of TPA-2TH in trimethylamine is 492 nm, whereas it is 573 nm in acetonitrile. On increasing the polarity from trimethylamine to acetonitrile, a bathochromic shift of ∼81 nm was observed. Based on these results, it was concluded that the effect of solvent polarities is more pronounced on λem than on λabs, suggesting that the molecule's excited state is controlled by dipole–dipole interactions and the dipole moments of excited states are higher than those of the ground states.55,56 Additionally, this insignificant change in absorption maxima and a considerable variation in fluorescence emission (λem) indicate the formation of a twisted ICT (TICT) transition.57 Furthermore, the difference in the full-width half-maximum or width of the peak confirms that polar solvent molecules stabilize the emission and the excited states giving wider spectra.58 This broad emission pattern of TPA-2TH due to the polar solvent proves the existence of the ICT transition between donor TPA to acceptor 2TH.
 | ||
Fig. 3 (a) Emission spectra of TPA-2TH (λex = 431 nm) in different solvents, (b) Lippert–Mataga plot in different solvents showing the dependence of the Stokes shift (Δ![[small nu, Greek, macron]](https://www.rsc.org/images/entities/i_char_e0ce.gif) ) of TPA-2TH on the solvent polarity function Δf and (c) photographs showing the changes in emission of TPA-2TH in different solvents under the illumination of UV light (365 nm). ) of TPA-2TH on the solvent polarity function Δf and (c) photographs showing the changes in emission of TPA-2TH in different solvents under the illumination of UV light (365 nm). | ||
Furthermore, to comprehend the solvent polarity influence of TPA-2TH in different solvents, a Lippert–Mataga plot was used, which shows that the Stokes shift (Δ) of the compound is solvent dependent and is governed by the change in the dipole moment of the molecule upon excitation, refractive index (η) and the dielectric constant (ε) of the solvent used.59Fig. 3b and Table S1 (ESI†) depict the Lippert–Mataga plot and its parameter for TPA-2TH in different solvents. The plot shows that two types of linearity, one for polar protic solvents like AcOH and MeOH and the other for polar aprotic solvents such as hexane, toluene, CCl4, DCM, CHCl3, EtOAc, etc. In aprotic solvents, TPA-2TH exhibited a general solvent effect; however, in MeOH and ACOH, it deviated from the linearity due to specific interactions, such as H-bonding.
With increasing solvent polarity, the Stoke's shift increases, but the fluorescence quantum yields were found to be decreased. This is caused by increased solvent polarity, which facilitates the non-radiative deactivation of the fluorescent state of the molecule. Table S1, ESI,† shows the results of the fluorescence quantum yield measurement of TPA-2TH at room temperature with various solvent polarities and hydrogen bonding capacities. In low polarity solvents, TPA showed a high quantum yield, but in highly polar solvents, it showed a relatively poor quantum yield. To identify the different species present in the excited state, the fluorescence lifetime of TPA-2TH in various solvents was measured (Fig. S8, ESI†). Table S1, ESI,† represents the time-resolved data in terms of average lifetime (τavg), regardless of the solvent polarity, for all solvent profiles that are well fitted into mono and bi-exponential decay. The lifetime decay processes of TPA are discovered to be solvent dependent. The fluorescence lifetime was shown to decrease with an increase in solvent polarity. For instance, the lifetime in CCl4 is 3.56 ns, but AcOH, a polar solvent, shortened it to 1.14 ns.
Furthermore, the pH-dependent properties of TPA-2TH were investigated by recording its absorption and emission spectra in an aqueous medium covering a pH range from 1 to 14 (Fig. S7b and c, ESI†). The pH adjustments were achieved using diluted HCl for acidic conditions and NaOH for basic conditions. The initial weak intensity of the 265 nm peak in the absorption spectra at pH = 1 suggests a suppressed π → π* transition, likely due to acidic conditions affecting the electronic structure. As the pH was increased to 10, the increased intensity of the 265 nm peak indicates a more pronounced π → π* transition, possibly due to reduced protonation effects on the molecule. The subsequent decrease in intensity of the 265 nm peak as the pH increased from 10 to 14 may be attributed to deprotonation events impacting the molecular conformation or electronic interactions, leading to altered UV absorption properties. Furthermore, a weak yet intense ICT peak was evident at 478 nm at a pH less than 10. Intriguingly, this ICT peak underwent a blue shift, shifting to 430 nm on increasing the pH from 10 to 14 (Fig. S7b, ESI†). The blue shift of the ICT peak from 478 nm to 430 nm with increasing pH further indicates a change in charge distribution or electronic transitions within TPA-2TH molecules under basic conditions. In the PL spectra (Fig. S7c, ESI†), a notable blue shift in emission maxima was observed at higher or basic pH levels compared to its emission under acidic conditions. This intriguing shift in emission maxima, concomitant with varying pH levels, indicates that the electronic structure and intermolecular interactions within TPA-2TH are markedly influenced by the pH of the solution.
3.2 Sensing response of TPA-2TH with various metal ions
Since the functional groups of TPA-2TH are electron-donating, we hypothesized that this might translate to a greater affinity for metal ions. Thus, the fine-tuning of TPA-2TH fluorescence prompted us to investigate its sensitivity and selectivity to specific metal ions. Bearing in mind the flexible coordination of N, S and O atoms and to evaluate the potential of TPA-2TH as a fluorescent sensor for the detection of metal ions, fluorescent titrations were performed.The sensing competence of TPA-2TH towards different metal ions like Ba2+, Mg2+, Mn2+, Co2+, Ni2+, Cu2+, Zn2+, Pb2+, Pd2+, As2+, Cd2+ and Hg2+ was studied by taking 1 mM stock solution of both TPA-2TH in THF and each metal ion in their salt forms (chloride, acetate and nitrate salts) in methanol (Fig. 4(a)). Remarkably, among all metal ions, only Hg2+ showed the fluorescence quenching of TPA-2TH with a concomitant blue shift (from 522 to 502 nm) and the appearance of a new peak at 643 nm (Fig. 5(c)). In contrast, all other metal ions displayed a relatively less or negligible change in emission intensity of TPA-2TH. From Fig. 4(b), it is clear that TPA-2TH binds selectively only to the Hg2+ over other metal ions.
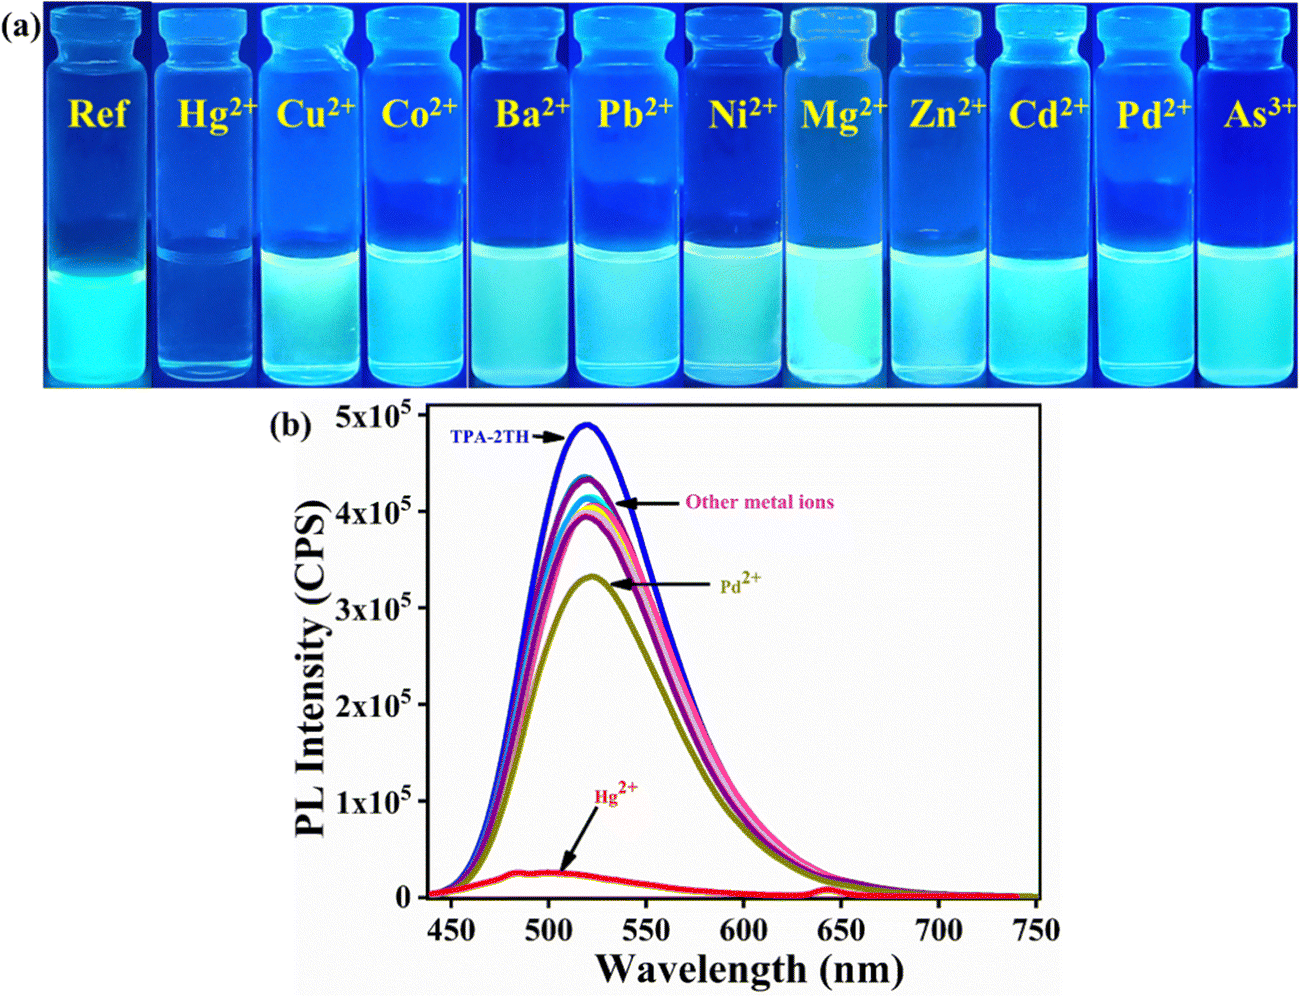 | ||
| Fig. 4 (a) Photographs of TPA-2TH in the presence of different metal solutions under the UV light of 365 nm. (b) Emission spectra of TPA-2TH (3 μM) in the absence and presence of different metal ions (6.7 μM) in THF. | ||
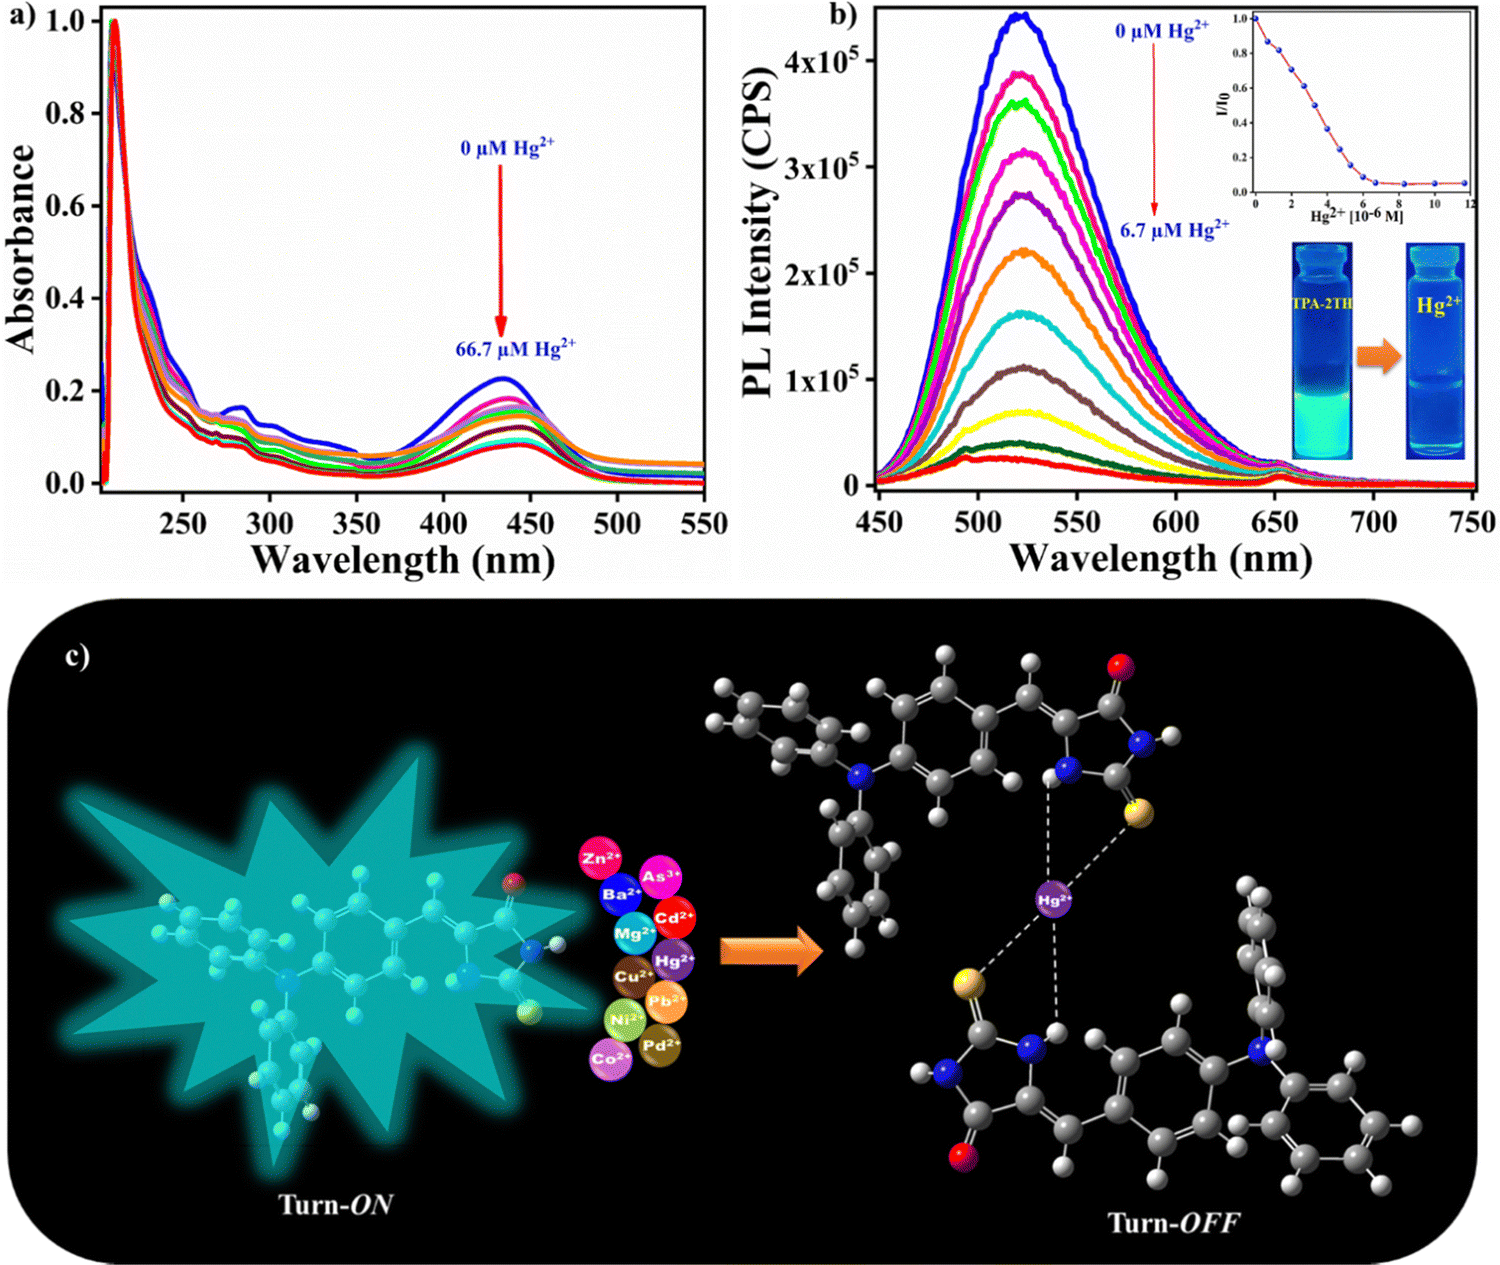 | ||
| Fig. 5 Change in (a) absorbance and (b) emission spectra of TPA-2TH (3 μM) upon the addition of different concentrations of Hg2+ in THF. The inset shows the changes in I/I0 of TPA-2TH (3 μM) with increasing concentrations of Hg2+ (0–6.7 μM). (c) Pictorial representation of Hg2+ sensing by TPA-2TH. | ||
3.3 Selectivity of TPA-2TH towards metal ions
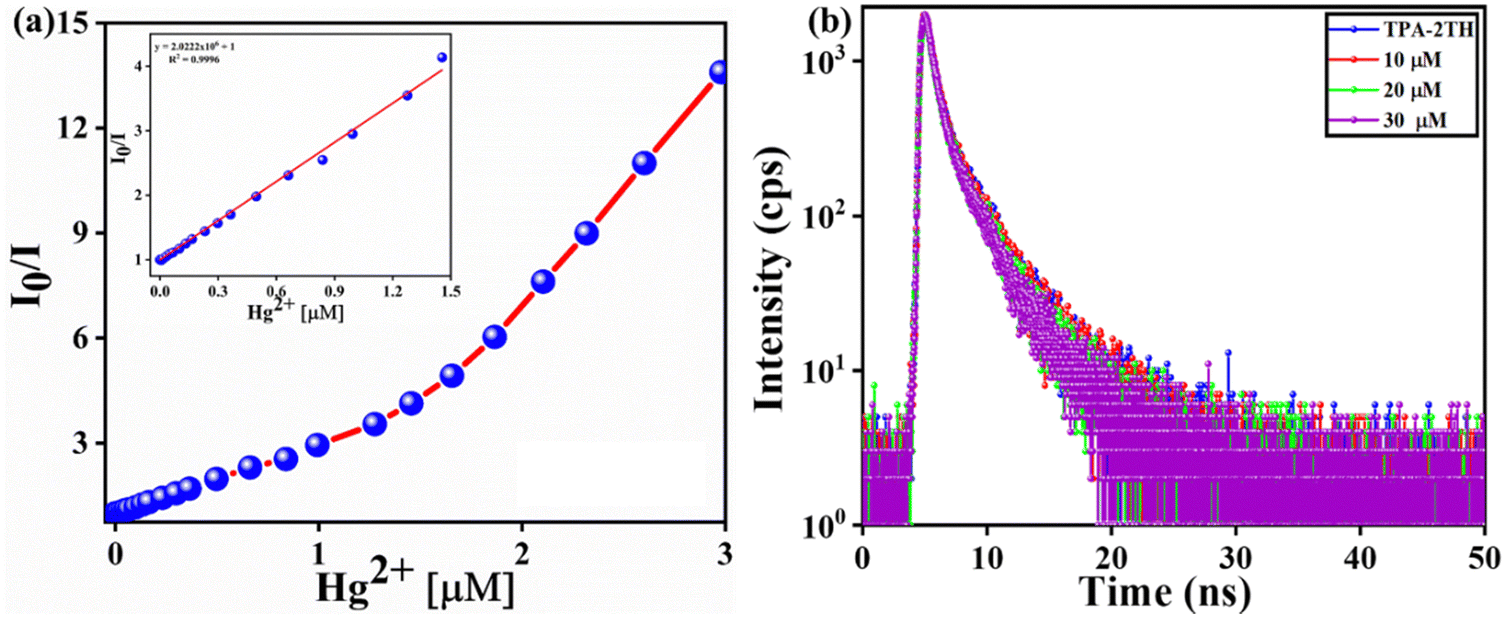
Furthermore, to understand the selective binding of TPA-2TH to Hg2+ over other metal ions, systematic fluorescence emission titration experiments were performed. It was observed that the emission spectrum of TPA-2TH underwent significant variations with an increase in the concentrations of Hg2+ ions (0–6.7 μM). The emission peak at 522 nm was gradually decreased and reached the saturation at 6.7 μM of Hg2+ (Fig. 5(b)) along with the formation of a new peak at 643 nm. The huge fluorescence quenching can be ascribed to the heavy atom effect of Hg2+ ions upon binding with the fluorophore.32 To look further into the complex formation between TPA-2TH and Hg2+ ions, UV-Vis titration was carried out in THF (Fig. 5(a)). Upon the addition of different concentrations of Hg2+, the ICT band of TPA-2TH appearing at 431 nm gradually moved with a bathochromic shift to 444 nm. These results further support the decrease in the emission intensity of TPA-2TH upon the addition of Hg2+ ions. Many heavy transition metal (HTM) ions are well-known fluorescence quenchers due to their paramagnetic properties and the heavy atom effect.60For practical quantitative detection, the fluorescence intensity changes should vary linearly with the analyte. To examine the sensitivity of TPA-2TH towards Hg2+ ions, the limit of detection (LOD) was calculated by performing fluorescence titration of TPA-2TH (0.067 μM) in THF (Fig. S9, ESI†), following the procedure recommended by IUPAC61 which involved plotting the emission intensity of the probe against increasing concentrations of Hg2+. The linear response of the fluorescence intensity of TPA-2TH as a function of increasing Hg2+ concentration was observed from 17 nM to 67 nM (R2 = 0.9826). The LOD was calculated to be 3.3 pM, which was well below the permissible limit of Hg2+ in drinking water (2 ppb) set by the US Environmental Protection Agency.62,63 These results indicate that TPA-2TH can be used to detect the picomolar concentration of Hg2+ ions and is found to be highly sensitive to other reported sensory probes for Hg2+ detection (Table S2, ESI†). A characteristic feature of any sensory probe is its high selectivity towards a particular analyte over other interfering competitive species. The spectral response of probe TPA-2TH towards other metal ions (Ba2+, Mg2+, Mn2+, Co2+, Ni2+, Cu2+, Zn2+, Pb2+, Pd2+, As3+, and Cd2+) besides Hg2+ was tested in THF. The change in fluorescence intensity of TPA-2TH (3 μM) was measured by adding 1 equivalent of other metal ions (Fig. 6(a)).
 | ||
| Fig. 6 (a) Interference effect of various metal ions on the emission intensity of TPA-2TH at 522 nm in THF. (b) Job's plot for complex formation between TPA-2TH and Hg2+ in THF/H2O (λex = 430 nm). | ||
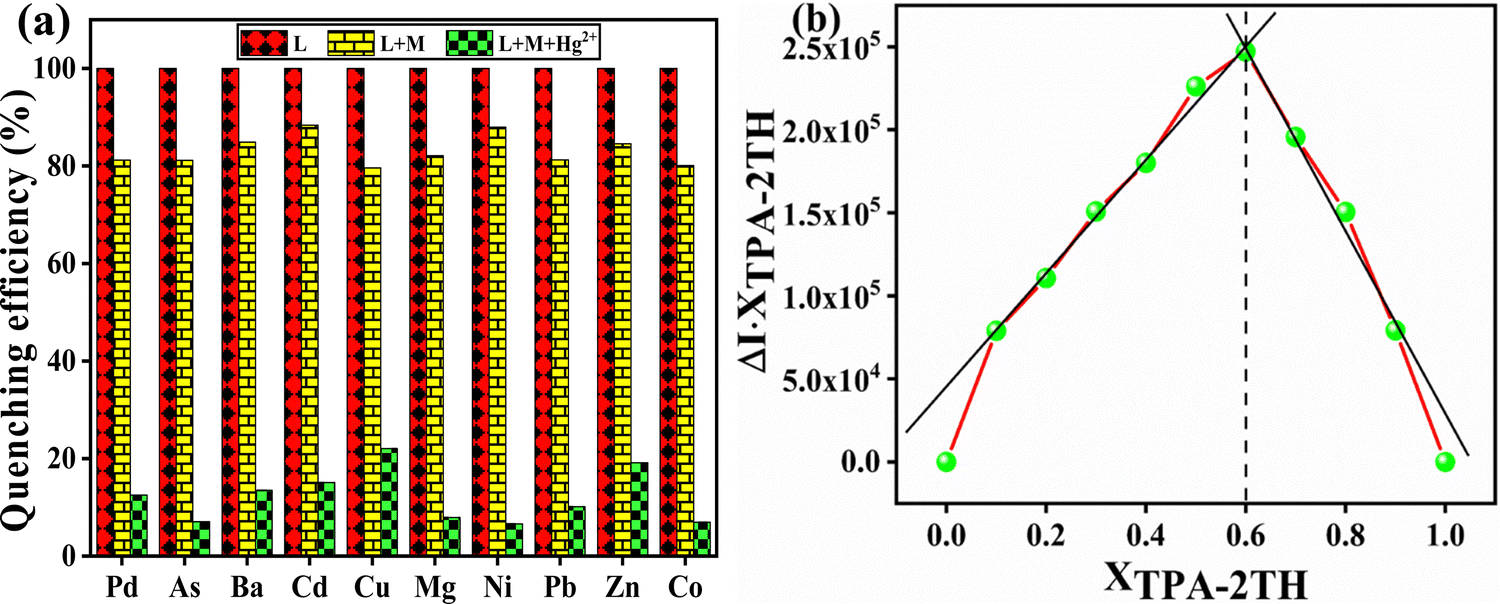
The influence on the fluorescence intensity of TPA-2TH due to other metal ions was found to be negligible even at the micro-molar level. In contrast, the highly selective fluorescence quenching by Hg2+ ions was observed for TPA-2TH with a quenching efficiency of 94.4% at 522 nm. This excellent selectivity of the probe TPA-2TH in the presence of other competitive metal ions was mainly due to the stronger affinity of the thio groups of 2TH to Hg2+. Thus, Hg2+ ions being more thiophilic bind with TPA-2TH selectively even in the presence of a high concentration of the other metal ions. These results emphasize that TPA-2TH can be used exclusively as a highly sensitive sensor for Hg2+ ion detection. A fluorescence-based Job's experiment was performed to study the complexation between TPA-2TH and Hg2+ ions (λex = 430 nm, λem = 522 nm). As shown in Fig. 6(b), the plot of fluorescence intensity versus mole fraction of TPA-2TH displays a point of intersection corresponding to two linear extrapolations, which is found to be the 0.6 mole fraction of TPA-2TH, indicating 2:1 complex formation between TPA-2TH and Hg2+ ions.
3.4 1HNMR titration of TPA-2TH with Hg2+ ions
To further understand the nature of the interaction between TPA-2TH and Hg2+ ions, the 1H NMR titration experiment in DMSO-d6 (Fig. 7) was performed. It was found that two singlets due to two –NH protons were merged and broadened with a downfield shift, thus appearing at δ 12.27 ppm and its intensity decreased gradually upon increasing the Hg2+ concentration from 0 to 0.25 to 1.5 equivalents. The protons of the region from δ 6.89–7.65 ppm increased and became twice the number of original values indicating 2:1 (TPA-2TH + Hg2+) complex formation between Hg2+ and TPA-2TH through its –NH and S atom owing to the soft–soft interaction between S and Hg2+.
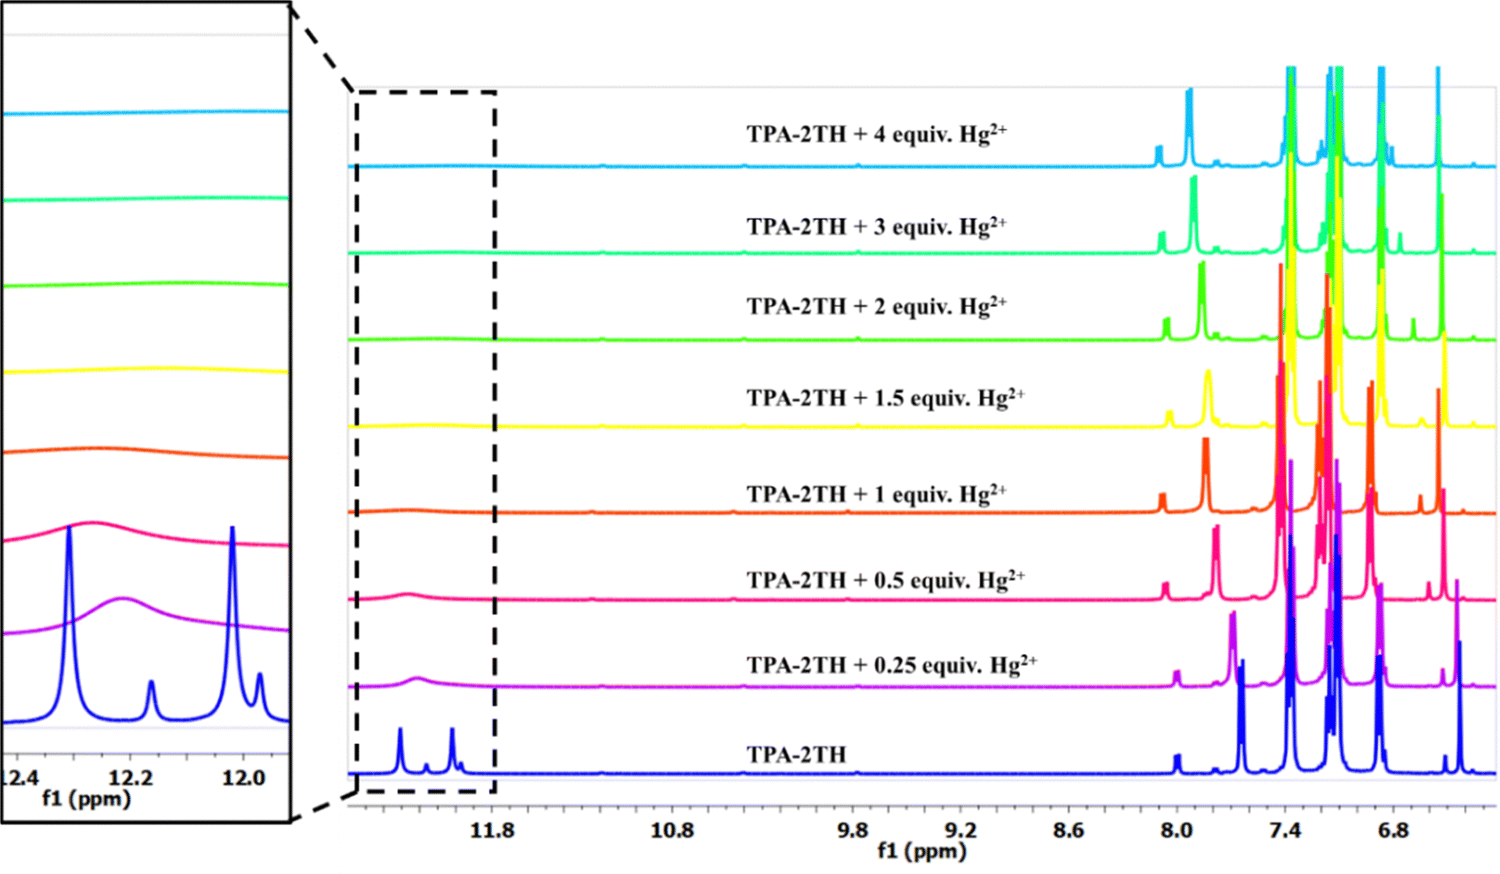 | ||
| Fig. 7 Partial 1HNMR spectra of TPA-2TH upon the addition of different concentrations of Hg2+ as HgCl2 in DMSO-d6. | ||
3.5 Mechanistic studies
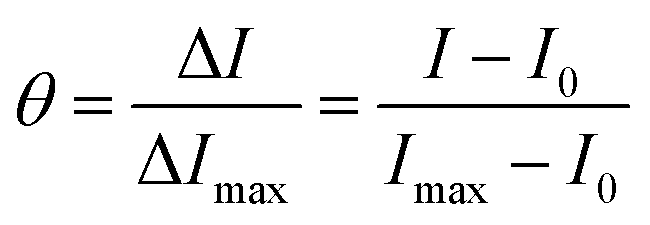
The results from steady-state fluorescence measurements using a Stern–Volmer plot (SV) and time-resolved studies are used to investigate the quenching mechanism of sensing, providing a deeper understanding of the process.64–66 The fluorescence quenching upon titration between TPA-2TH and Hg2+ ions indicates strong binding interactions between them. The SV plot demonstrates a direct relationship between the change in emission and the concentration of Hg2+ ions at low concentrations (up to 1.5 μM). The quenching constant KSV was obtained from the SV equation as follows:where I0 and I is the fluorescence intensity of TPA-2TH in the absence and presence of Hg2+ ions, respectively, KSV is the Stern–Volmer quenching constant and [Q] is the concentration of Hg2+ ions. The Stern–Volmer plot of I0/I vs. [Q] was plotted to obtain the slope value as KSV (Fig. 8(a)). The linear relationship observed at lower concentrations (KSV = 2.02 × 10⁶ M−1) can be attributed to either static or dynamic quenching mechanisms. However, at higher concentrations, there is a deviation from linearity, suggesting the involvement of static quenching with the contribution of dynamic quenching. Based on these findings, we propose the co-existence of both static and dynamic quenching mechanisms. The relatively gradual curvature indicates the dominance of the static quenching mechanism, indicating the formation of a ground state complex between the fluorophore TPA-2TH and Hg2+ ions.66 Fluorescence lifetime investigation is the best technique to determine the quenching mechanism, as the static fluorescence quenching does not affect the lifetime, whereas dynamic quenching shows variations in the lifetime as a function of concentration and its environment. Lifetime studies were carried out to demonstrate the coordination between TPA-2TH and Hg2+ and to establish the quenching fluorescence mechanism. The decay profiles were determined in THF and then fitted with bi-exponential functions. The average fluorescence decay (τaver.) of 30 μM of the TPA-2TH + Hg2+ complex was 3.08 ns (Fig. 8(b)), which is almost similar to that of TPA-2TH (τaver. = 3.13 ns), suggesting that static quenching is the predominant mechanism. Normally, the formation of a ground state complex does not cause a significant red shift in the absorption spectrum of the fluorophore.64 However, in the presence of Hg2+ ions, a slight bathochromic shift of ∼13 nm was observed in the absorption spectrum of the TPA-2TH probe (Fig. 5(a)). This shift provides additional evidence for the formation of a ground state complex and further confirms the predominance of the static quenching mechanism.

 | ||
| Fig. 8 (a) SV plot and (b) time-resolved fluorescence emission decay of TPA-2TH and the TPA-2TH + Hg2+ complex in THF. | ||
To further understand the quenching mechanism, we have calculated the radiative and non-radiative rate constants for TPA-2TH and its Hg2+ complex based on their quantum yield (Φf) and average lifetimes (τaver.).67,68 Table S3, ESI,† provides an insight into the decay components contributing to the quenching mechanism. A higher kr signifies efficient light emission, with TPA-2TH displaying 0.096 ns−1kr while TPA-2TH + Hg2+ exhibits an exceptionally low kr value of 0.001 ns−1, indicating inefficient light emission. On the other hand, knr denotes the rate of non-emissive decay pathways. TPA-2TH has a knr of 0.224 ns−1, suggesting a significant non-emissive contribution, whereas TPA-2TH + Hg2+ has a notably higher knr value of 0.324 ns−1, indicating a dominant non-radiative decay route.
The following equation can be used to calculate the fractional occupancy of all binding sites (θ)69 present in TPA-2TH:
where n denotes the total number of binding sites, θ denotes the amount of Hg2+ ions that bind to the probe TPA-2TH and Ka means the association constant. The plot of 1/(1 − θ) vs. [Hg2+]/θ will give Ka as the slope value, which is obtained as 1.6 × 10⁶ M−1 (Fig. S10, ESI†). The standard free energy change69 can be calculated using the equation ΔG = −2.303RT log10
 Ka, which was found to be −35.59 kJ. The negative value for ΔG indicates that the complexation reaction between TPA-2TH and Hg2+ ion is spontaneous.
Furthermore, the binding mode of TPA-2TH towards Hg2+ and the associated quenching mechanisms could be explained based on soft–soft metal interactions between Hg2+ and S and NH atoms TPA-2TH. Upon binding of Hg2+ with TPA-2TH, there is an overall reduction in the electron density from the donor TPA moiety to the acceptor 2TH, which led to quenching in the fluorescence emission of TPA-2TH. Furthermore, TPA-2TH exhibited reversible sensing capabilities for Hg2+. Notably, the addition of potassium iodide was able to effectively reverse the sensing event. This reversal can be attributed to the stronger affinity of Hg2+ for iodide ions. The switching phenomenon could be achieved through multiple cycles of alternating additions of Hg2+ and KI ions to the TPA-2TH solution (Fig. S11, ESI†).
To explore the time-dependent properties, the emission spectra of TPA-2TH were acquired in THF by adding a 3 μM solution of Hg2+. The emission peak intensity was monitored at 522 nm over varying time intervals (Fig. S12, ESI†). After adding Hg2+ to TPA-2TH solution at 84 s, a notable reduction in emission intensity at 522 nm was observed. Interestingly, beyond 84 s, the emission intensity reached a point of saturation. Even when extending the time to 280 s, no further change in emission intensity at 522 nm was observed. The observed time-dependent decrease in emission intensity until reaching a saturation point at 84 s can be attributed to a specific interaction or dynamic process involving Hg2+ ions and TPA-2TH. The saturation of emission intensity beyond 84 s suggests that the interaction between TPA-2TH and Hg2+ ions stabilizes or reaches a state of equilibrium at this time point. Further temporal extension does not significantly influence this interaction, indicating a steady-state condition in the emission behaviour of TPA-2TH.
3.6 Fluorescence quenching studies in zebrafish larvae
Utilizing the zebrafish in multiple research areas, such as cancer, drug discovery, toxicology, developmental biology, neuroscience, and infectious disease modelling71,72 has proven to be a valuable model organism due to its low cost of maintenance, high fecundity, and the ease with which its genome can be manipulated and observed.73 A lot of studies have been carried out to evaluate the toxicity of chemical substances, pollutants, environmental contaminants, and drugs, based on teratological, biochemical, and behavioural analyses. However, there is lack of studies on live animal models to test the fluorescence quenching as a bio-indicator. We tried to address the fluorescence quenching as a bio-indicator for metal ion contamination using zebrafish larvae as a model system along with acute behavioural toxicity end points using adult zebrafish.The strong fluorescence emission was observed in zebrafish larvae of 72 hpf when treated with TPA-2TH (Fig. 9). Compared to zebrafish larvae treated with TPA-2TH alone, the intensity of fluorescence was reduced in TPA-2TH + HgCl2 by 61.11% and in TPA-2TH + CuCl2 by 80.37%. The fluorescence intensity among water control and DMSO control treated larvae were found to be equal. Moreover, during the course of treatment the zebrafish larvae were found to be dead because of the toxicity of CuCl2 and HgCl2. The pristine TPA-2TH is safe to use for zebrafish larvae but with the combination of Hg2+ and Cu2+, it was found to be detrimental.
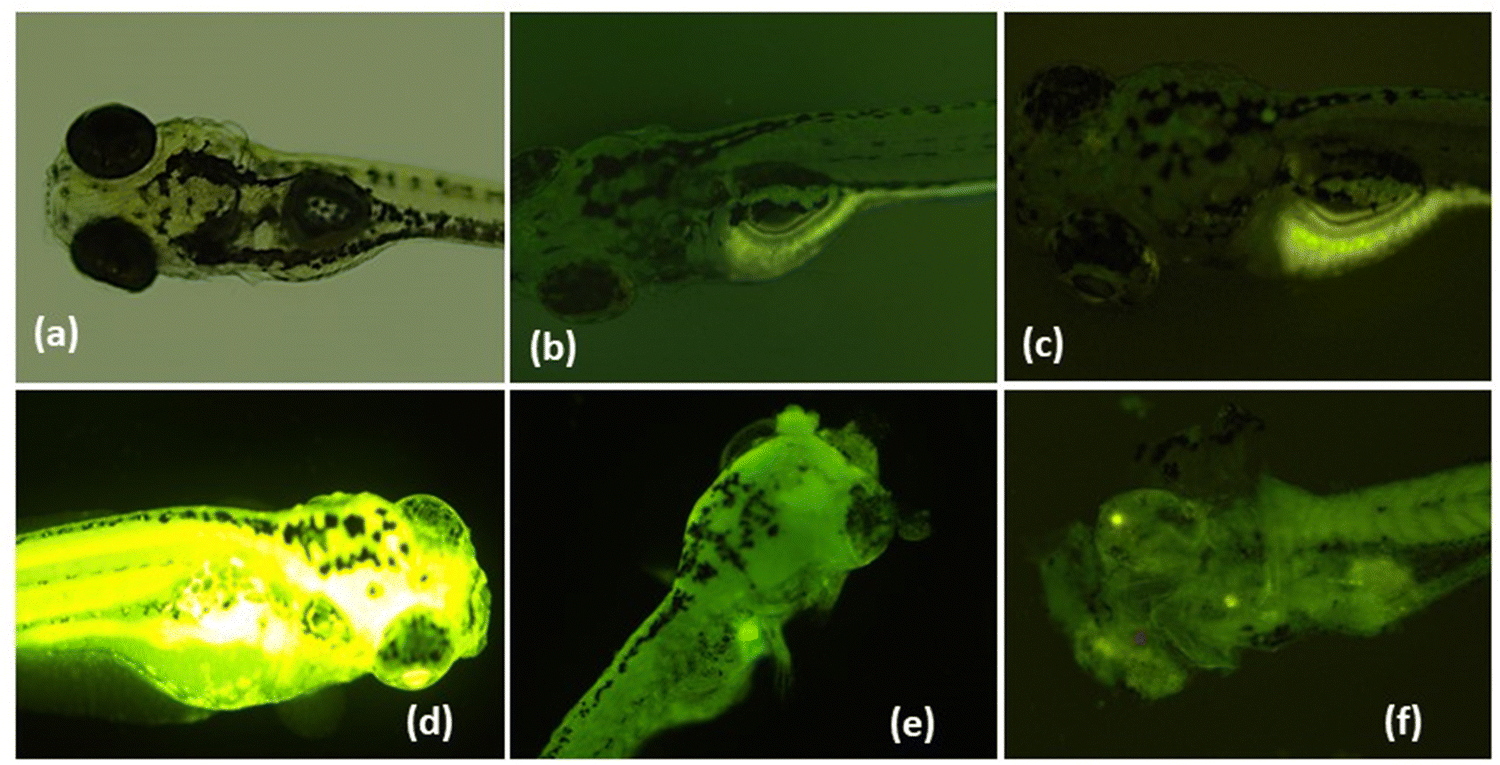 | ||
| Fig. 9 Quantification of fluorescence quenching in live zebrafish larvae. Images showing different intensities of fluorescence emission. (a) Bright field image of zebrafish larva. (b) Zebrafish larva treated with water. (c) Larva treated with DMSO. (d) TPA-2TH treated larva showing a high intensity of fluorescence emission. (e) Larva treated with TPA-2TH + CuCl2. (f) TPA-2TH + HgCl2 treated zebrafish larva. | ||
4. Conclusions
In this work, we have designed and developed a novel triphenylamine (TPA) appended in conjugation with 2TH through a one pot Knovenagel condensation method with good yields and its structure was confirmed using FT-IR, NMR, HR-MS and SC-XRD techniques. In the molecular ensemble, the TPA moiety acted as a donor and the 2TH unit acted as an Hg2+ ion chelator. SC-XRD revealed the co-facial herringbone packing arrangement of TPA-2TH in a crystal lattice with a propeller-shaped TPA unit. It exhibited a strong absorption band at 431 nm and showed strong yellow-green emission in THF with λem = 522 nm that is attributed to the efficient charge-separated state produced by ICT between the TPA and 2TH unit. TPA-2TH showed an excellent solvatochromic effect wherein it exhibited a bathochromic shift in its emission on increasing the solvent polarity. TPA-2TH exhibited distinct fluorescence quenching upon complexation with Hg2+ ions, attributed to increased spin–orbit coupling and a weakened ICT effect. The LOD achieved was as low as 3.3 pM, indicating the high sensitivity of TPA-2TH for Hg2+ ion detection. The fluorescence quenching of TPA-2TH in zebrafish larvae provided a sensitive indicator for metal ion contamination, while the absence of acute behavioural toxicity in adult zebrafish suggested its safety for aquatic organisms. This study highlights the practical utility of TPA-2TH as a comprehensive tool for evaluating metal ion contamination and assessing its potential toxic effects on aquatic ecosystems. Further research can explore its efficacy in detecting and quantifying diverse pollutants or contaminants in environmental samples. Moreover, TPA-2TH shows promise for evaluating the presence and toxicological impacts of various substances on different organisms and aquatic ecosystems.Author contributions
Pratiksha Gawas: conceptualization, methodology, investigation, formal analysis, visualization and writing – original draft. Dr Buthanapalli Ramakrishna: crystallography. Dr Rajesh Pamanji and Dr Joseph Selvin: performed experiments related to Zebrafish studies. Dr Venkatramaiah Nutalapati: conceptualization, review, editing, funding acquisition and supervision.Conflicts of interest
The authors declare no competing financial interest.Acknowledgements
The authors acknowledge the financial support from SRMIST for this research work and the various in-campus characterization facilities at NRC, SCIF of SRMIST. Dr NVR greatly acknowledges the Central Power Research Institute (CPRI, A government of India society under Ministry of Power) for funding through the R&D project (CPRI/R&D/TC/GDEC/2022) and SRMIST for the seed grant. PG thanks SRMIST for the PhD fellowship. The authors are also very thankful to Dr S. Ravi Teja, SSCU, Indian Institute of Science (IISc), Bangalore for the useful discussions. Dr Rajesh Pamanji is thankful to University Grant Commission (UGC), Govt. of India, for providing financial assistance in the form of Dr DS Kothari Postdoctoral fellowship BL/19-20/0302.References
- D. F. Perepichka and M. R. Bryce, Angew. Chem., Int. Ed., 2005, 44, 5370–5373 CrossRef CAS PubMed.
- J. Y. Lee, K. S. Kim and B. J. Mhin, J. Chem. Phys., 2001, 115, 9484–9489 CrossRef CAS.
- F. Bureš, O. Pytela, M. Kivala and F. Diederich, J. Phys. Org. Chem., 2011, 24, 274–281 CrossRef.
- H. A. M. Van Mullekom, J. A. J. M. Vekemans, E. E. Havinga and E. W. Meijer, Mater. Sci. Eng., R, 2001, 32, 1–40 CrossRef.
- B. J. Coe, Chem. – Eur. J., 1999, 5, 2464–2471 CrossRef CAS.
- P. Lasitha and E. Prasad, RSC Adv., 2015, 5, 41420–41427 RSC.
- C. Agarwal and E. Prasad, RSC Adv., 2014, 4, 8015–8022 RSC.
- P. Rajamalli and E. Prasad, Soft Matter, 2012, 8, 8896–8903 RSC.
- P. A. Sullivan and L. R. Dalton, Acc. Chem. Res., 2010, 43, 10–18 CrossRef CAS PubMed.
- F. Chen, J. Zhang and X. Wan, Chem. – Eur. J., 2012, 18, 4558–4567 CrossRef CAS PubMed.
- F. M. Raymo and M. Tomasulo, Chem. – Eur. J., 2006, 12, 3186–3193 CrossRef CAS.
- J. Xue, B. P. Rand, S. Uchida and S. R. Forrest, J. Appl. Phys., 2005, 98, 124903 CrossRef.
- X. Zhang, T. T. Steckler, R. R. Dasari, S. Ohira, W. J. Potscavage, S. P. Tiwari, S. Coppée, S. Ellinger, S. Barlow, J. L. Brédas, B. Kippelen, J. R. Reynolds and S. R. Marder, J. Mater. Chem., 2010, 20, 123–134 RSC.
- J. Kulhánek, F. Bureš, A. Wojciechowski, M. Makowska-Janusik, E. Gondek and I. V. Kityk, J. Phys. Chem. A, 2010, 114, 9440–9446 CrossRef.
- A. E. Stiegman, E. Graham, K. J. Perry, L. R. Khundkar, L.-T. Cheng and J. W. Perry, J. Am. Chem. Soc., 1991, 113(20), 7658–7666 CrossRef CAS.
- C. Dehu, F. Meyers and J. L. Brédas, J. Am. Chem. Soc., 1993, 115, 6198–6206 CrossRef CAS.
- J. Huang, W. Wen, Y. Sun, P. Chou and J. Fang, J. Org. Chem., 2005, 70, 5827–5832 CrossRef CAS PubMed.
- D. Ray, E. Siva, S. Iyer, K. Sadhu and P. K. Bharadwaj, Dalton Trans., 2009, 5683–5687 RSC.
- S. Sivaramapanicker, K. P. Divya, P. Jayamurthy, J. Mathew, V. N. Anupama, D. Susan Philips and P. Anees, Photochem. Photobiol. Sci., 2012, 11, 1715–1723 CrossRef PubMed.
- C. A. S. P. P. Thilagar, Inorg. Chem., 2014, 53, 2776–2786 CrossRef.
- Y. Yan, Y. Zhang and H. Xu, ChemPlusChem, 2013, 78, 628–631 CrossRef CAS PubMed.
- J. Karthikeyan, P. Parameshwara and A. N. Shetty, Indian J. Chem. Technol., 2008, 15, 493–496 CAS.
- A. Hemamalini, S. K. Mudedla, V. Subramanian and T. Mohan Das, New J. Chem., 2015, 39, 3777–3784 RSC.
- Y. Li, F. Wei, Y. Lu, S. He, L. Zhao and X. Zeng, Dyes Pigm., 2013, 96, 424–429 CrossRef.
- E. Taboada, G. Cabrera and G. Cárdenas, Bol. Soc. Chil. Quim., 2003, 48, 7–12 CAS.
- T. B. Wei, G. Y. Gao, W. J. Qu, B. B. Shi, Q. Lin, H. Yao and Y. M. Zhang, Sens. Actuators, B, 2014, 199, 142–147 CrossRef CAS.
- M. Kumar, R. Kumar and V. Bhalla, Org. Biomol. Chem., 2011, 9, 8237–8245 RSC.
- W. J. Qu, G. Y. Gao, B. B. Shi, T. B. Wei, Y. M. Zhang, Q. Lin and H. Yao, A highly selective and sensitive fluorescent chemosensor for mercury ions based on the mechanism of supramolecular self-assembly, Elsevier B.V., 2014, vol. 204 Search PubMed.
- H. F. Wang and S. P. Wu, Tetrahedron, 2013, 69, 1965–1969 CrossRef CAS.
- P. Thirupathi and K. H. Lee, Bioorg. Med. Chem., 2013, 21, 7964–7970 CrossRef CAS PubMed.
- Q. Li, M. Peng, H. Li, C. Zhong, L. Zhang, X. Cheng, X. Peng, Q. Wang, J. Qin and Z. Li, Org. Lett., 2012, 14, 2094–2097 CrossRef CAS PubMed.
- B. K. Rani and S. A. John, J. Hazard. Mater., 2018, 343, 98–106 CrossRef CAS.
- C. Zhou, Y. Song and Y. Li, RSC Adv., 2014, 4, 33614–33618 RSC.
- H. Dai, F. Liu, Q. Gao, T. Fu and X. Kou, Luminescence, 2011, 26, 523–530 CrossRef CAS PubMed.
- C. Chen, H. Dong, Y. Chen, L. Guo, Z. Wang, J. J. Sun and N. Fu, Org. Biomol. Chem., 2011, 9, 8195–8201 RSC.
- T. Zhang, G. She, X. Qi and L. Mu, Tetrahedron, 2013, 69, 7102–7106 CrossRef CAS.
- L. Chen, L. Yang, H. Li, Y. Gao, D. Deng, Y. Wu and L. J. Ma, Inorg. Chem., 2011, 50, 10028–10032 CrossRef CAS PubMed.
- J. Liu, Q. Lin, Y. M. Zhang and T. B. Wei, Sens. Actuators, B, 2014, 196, 619–623 CrossRef CAS.
- J. Liu, M. Yu, X. C. Wang and Z. Zhang, Spectrochim. Acta, Part A, 2012, 93, 245–249 CrossRef CAS PubMed.
- C. Y. Li, F. Xu, Y. F. Li, K. Zhou and Y. Zhou, Anal. Chim. Acta, 2012, 717, 122–126 CrossRef CAS.
- J. Choi, S. K. Lee, J. Bae and S. K. Chang, Tetrahedron Lett., 2014, 55, 5294–5297 CrossRef CAS.
- G. S. Ravi Kumara, A. Pandith and Y. J. Seo, Analyst, 2020, 145, 4777–4781 RSC.
- V. T. Nguyen, A. Pandith and Y. J. Seo, Chem. Commun., 2020, 56, 3199–3202 RSC.
- Y. Pandith, A. Luo, Y. Jang, Y. Bae and J. Kim, Angew. Chem., Int. Ed., 2023, 62, e202215049 CrossRef PubMed.
- P. P. Gawas, B. Ramakrishna, N. Veeraiah and V. Nutalapati, J. Mater. Chem. C, 2021, 9, 16341–16377 RSC.
- K. Taniguchi, H. Okumura, M. Honda, M. Suda, S. Fujinami, A. Kuwae, K. Hanai, S. Maeda and K. Kunimoto, X-ray Struct. Anal. Online, 2009, 25, 93–94 CrossRef CAS.
- G. M. Sheldrick, Acta Crystallogr., Sect. A: Found. Crystallogr., 2015, 71, 3–8 CrossRef.
- G. M. Sheldrick, Acta Crystallogr., Sect. C: Struct, Chem., 2015, 71, 3–8 Search PubMed.
- O. V. Dolomanov, L. J. Bourhis, R. J. Gildea, J. A. K. Howard and H. Puschmann, J. Appl. Crystallogr., 2009, 42, 339–341 CrossRef CAS.
- P. R. Spackman, M. J. Turner, J. J. McKinnon, S. K. Wolff, D. J. Grimwood, D. Jayatilaka and M. A. Spackman, J. Appl. Crystallogr., 2021, 54, 1006–1011 CrossRef CAS PubMed.
- J. Zhang, J. Jin, H. Xu, Q. Zhang and W. Huang, J. Mater. Chem. C, 2018, 6, 3485–3498 RSC.
- Y. Li, T. Ren and W. J. Dong, J. Photochem. Photobiol., A, 2013, 251, 1–9 CrossRef CAS.
- R. S. Moog, D. D. Kim, J. J. Oberle and S. G. Ostrowski, J. Phys. Chem. A, 2004, 108, 9294–9301 CrossRef CAS.
- O. A. Kucherak, L. Richert, Y. Mély and A. S. Klymchenko, Phys. Chem. Chem. Phys., 2012, 14, 2292–2300 RSC.
- S. B. Yadav, S. Kothavale and N. Sekar, J. Photochem. Photobiol., A, 2019, 382, 111937 CrossRef CAS.
- Y. Li, T. Tan, S. Wang, Y. Xiao and X. Li, Dyes Pigm., 2017, 144, 262–270 CrossRef CAS.
- P. S. Hariharan, E. M. Mothi, D. Moon and S. P. Anthony, ACS Appl. Mater. Interfaces, 2016, 8, 33034–33042 CrossRef CAS.
- Y. Yang, B. Li and L. Zhang, Sens. Actuators, B, 2013, 183, 46–51 CrossRef CAS.
- P. P. Gawas, A. Bora, R. P. Reji, B. Ramakrishna, P. B. Managutti, C. R. Göb, S. Mohamed, Y. Kawazoe, S. Velappa Jayaraman, Y. Sivalingam and V. Nutalapati, J. Phys. Chem. C, 2023, 127, 6466–6482 CrossRef CAS.
- Q. Mei, L. Wang, B. Tian, F. Yan, B. Zhang, W. Huang and B. Tong, New J. Chem., 2012, 36, 1879–1883 RSC.
- I. IUPAC, ‘Compendium of Chemical Terminology’ the “Gold Book”, Blackwell Scientific Publications, Oxford, 1997 Search PubMed.
- J. Bigler, Mercury Update: Impact of Fish Advisories. EPA Fact Sheet EPA-823-F-01–011, EPA, Office of Water, Washington, DC, 2001.
- K. Kanagaraj, K. Bavanidevi, T. J. Chow and K. Pitchumani, RSC Adv., 2014, 4, 11714–11722 RSC.
- P. K. Behera, T. Mukherjee and A. K. Mishra, J. Lumin., 1995, 65, 131–136 CrossRef CAS.
- Y. Long, H. Chen, H. Wang, Z. Peng, Y. Yang, G. Zhang, N. Li, F. Liu and J. Pei, Anal. Chim. Acta, 2012, 744, 82–91 CrossRef CAS PubMed.
- D. Zhao and T. M. Swager, Macromolecules, 2005, 38, 9377–9384 CrossRef CAS.
- N. S. Surajit Ghosh, S. Mandal, C. Banerjee and V. Govind Rao, J. Phys. Chem. B, 2012, 116, 9482–9491 CrossRef.
- S. Dhar, D. K. Rana, S. Singha Roy, S. Roy, S. Bhattacharya and S. C. Bhattacharya, J. Lumin., 2012, 132, 957–964 CrossRef CAS.
- L. D. Ward, Methods Enzymol., 1985, 117, 400–414 CAS.
- H. S. Jung, T. Pradhan, J. H. Han, K. J. Heo, J. H. Lee, C. Kang and J. S. Kim, Biomaterials, 2012, 33, 8495–8502 CrossRef CAS.
- Y. M. Bradford, S. Toro, S. Ramachandran, L. Ruzicka, D. G. Howe, A. Eagle, P. Kalita, R. Martin, S. A. T. Moxon, K. Schaper and M. Westerfield, ILAR J., 2017, 58, 4–16 CrossRef CAS PubMed.
- S. Cassar, I. Adatto, J. L. Freeman, J. T. Gamse, I. Iturria, C. Lawrence, A. Muriana, R. T. Peterson, S. Van Cruchten and L. I. Zon, Chem. Res. Toxicol., 2020, 33, 95–118 Search PubMed.
- B. Siddhardha, M. Dyavaiah and A. Syed, Model Organisms for Microbial Pathogenesis, Biofilm Formation and Antimicrobial Drug Discovery, 2020 Search PubMed.
Footnote |
| † Electronic supplementary information (ESI) available. CCDC 2278085. For ESI and crystallographic data in CIF or other electronic format, see DOI: https://doi.org/10.1039/d3ma00559c |
| This journal is © The Royal Society of Chemistry 2024 |