 Open Access Article
Assembly of a cadmium(II)-based chiral complex: crystal structure and optical properties for solid state white-light emission applications†
Mahdi
Gassara
a,
Xinghui
Liu
 *bc,
Ahlem
Guesmi
d,
Ammar
Houas
e,
Naoufel
Ben Hamadi
d and
Houcine
Naïli
 *a
*a
aLaboratory Physico Chemistry of the Solid State, Department of Chemistry, Faculty of Sciences of Sfax, P.O.Box 1171, Sfax 3000, University of Sfax, Tunisia. E-mail: houcine.naili@fss.rnu.tn
bDepartment of Materials Science and Engineering, City University of Hong Kong, 83 Tat Chee Avenue, Kowloon 999077, Hong Kong, China
cDepartment of Materials Physics, Saveetha School of Engineering, Saveetha Institute of Medical and Technical Sciences (SIMTS), Thandalam, Chennai, Tamilnadu 602105, India. E-mail: liuxinghui119@gmail.com
dChemistry Department, College of Science, Imam Mohammad Ibn Saud Islamic University (IMSIU), P.O. Box 5701, Riyadh 11432, Saudi Arabia
eResearch Laboratory of Catalysis and Materials for Environment and Processes, University of Gabes, City Riadh Zerig, Gabes, 6029, Tunisia
First published on 13th December 2023
Abstract
Organic–inorganic complexes are promising candidates for light-emitting applications. In this work, we report a new organo-metallic crystal [Cd(Br)2(S-1-(1-naphthyl)ethylamine; named S-NA)2], presenting a tetrahedral Cd(II) complex. The thermal analysis TG/DTA of this complex shows that it is thermally stable up to 300 °C. The solid-state UV-vis spectroscopy analysis exemplifies a large absorption band in the UV and visible region up to 500 nm, making the material suitable for optoelectronic applications. The direct and indirect gap energies were estimated to be 3.76 and 3.65 eV, respectively. The density functional theory exhibits a theoretical indirect band gap of 2.89 eV and presents each atom's contribution to confirm the material's semiconducting features. The photoluminescence analysis reveals a broad-band white-light emission, with a CRI of 92 like that of sunlight x, y (0.33, 0.33).
Introduction
Over the recent decades, several families of solid state light emission metal–organic compounds have been thoroughly researched and developed due to their prospective or actual uses in numerous domains, such as lighting, displays, sensors, optical devices, and others.1–5 In other words, hybrid components could provide platforms for generating luminescence, particularly for various transition metals and organic ligands with aromatic moieties or π conjugate systems.6–8 Furthermore, due to the several interactions in structure components, metal–organic complexes not only maintain or even enhance the characteristics of the individual components but also develop new luminous features.9–11The transition metal coordination complexes (TMCC) with divalent ions of d10 electronic configuration are all active in dynamics, and ligand substitution events can proceed more readily comparable to other transition metal ions, based on the theory of the dynamics of metal complex ligand substituents.12,13 As a result, Zn(II), Cd(II), and Hg(II)-based complexes are commonly produced, which improve the exploitation of several ligands for metal complexes.9,14 However, many researchers focus on cadmium due to its specific photo-physical properties resulting from its unique structures and composition,15–18 derived from the amiability of this transition metal to establish bonds with several organic ligands simultaneously; there have been several investigations on Cd(II) coordination polymers and multinuclear complexes based on different ligands.16,19,20
Based on the principles of kinetics in metal complex ligand substitution reactions, it has been suggested that divalent coordination compounds with a d10 electronic configuration are highly active in kinetics, making ligand substitution reactions more feasible than other transition metal ions. This is why Zn(II)/Cd(II)-containing complexes are frequently synthesized, allowing for the exploration of coordination chemistry with various ligands. Zn(II) and Cd(II) metal–organic complexes exhibit desirable fluorescence properties. Given these factors, it would be valuable to research amino-cyclic complexes substituted with Zn(II)/Cd(II)/Hg(II) ions. The coordination sphere of Cd(II) is highly flexible. In the crystal structure, intermolecular interactions, facilitated by a network of hydrogen bonds, π–π stacking, and various specific short contacts, influence the distribution of electron density and the overall rigidity of the crystal lattice. Consequently, these factors impact the spectroscopic characteristics of the complex.21–23 In certain instances, it becomes feasible to establish a qualitative correlation between the structural features and luminescent properties. However, a more profound comprehension of the photophysical characteristics of compounds can be attained by scrutinizing the electron density distribution in the ligands and the energy structure of molecular orbitals. Fluorescence is a phenomenon that occurs when excited molecules release energy in the form of light as they return to their ground state or a lower energy state with the same spin multiplicity. The mechanism of luminescence differs for each fluorescent material.24–26
In organic compounds, two electronic transitions commonly occur during fluorescence excitation and emission: n–π* and π–π*. Note that n–π* transitions generally require less energy than π–π* transitions. Therefore, organic compounds containing nitrogen heteroatom can undergo n–π* transitions to generate fluorescence. However, n–π* transitions belong to spin-forbidden transitions, and organic compounds with the lowest excited single state corresponding to n–π* may not be suitable as strong fluorescent materials.27,28 Moreover, others charge transfer mechanisms generated by halides, and the aromatic rings of the organic ligands x⋯π with (x = Br and I) can contribute in the active white-light luminescence generated by organic ligand and the CdBr2 with the assistance of the intersystem crossing through the triple state at room temperature.29,30
This perspective aims to highlight the primary structure of a new cadmium complex, along with organic aromatic ligands that have been reported in recent years. We will delve into their coordination chemistry and examine the various factors that affect the final products. Additionally, we will explore their thermal stabilities, adsorption abilities, and fluorescence properties to investigate the correlations between properties and structures. By doing so, experimental and calculated results prove that this new organometallic complex can be suitable for solid-state lighting application.
Experimental section
Synthesis
To grow a crystal of this complex, we dissolved a stoichiometric amount of CdBr2 (0.136 g, 0.5 mmol) and S-1-(1-naphthyl)ethylamine (0.172 g, 1 mmol) in a mixture of 10 mL of ethanol and 5 mL of deionized water. The obtained solution was placed in a Teflon-lined stainless autoclave under a N2 atmosphere and heated to 120 °C for 48 hours. The hot solution was slowly cooled to room temperature for more than 24 hours. During the cooling period, orange needle-like crystals appear (Fig. 1).X-Ray crystallographic study
Data of single-crystal X-ray diffraction (ScXRD) were acquired at room temperature (293 K) using an APEX II, Bruker-AXS diffractometer with Mo Kα radiation (0.71073 Å). The structure was solved using the direct technique and improved using the SHELXL software,31 a full-matrix least-squares method based on F2. The organic components were discovered using the same program and consecutive Fourier calculation. All hydrogen atoms linked to C and N atoms were assigned with geometrical distances C–H = 0.97 Å and N–H = 0.85 Å.Spectroscopy
A PerkinElmer FT-IR 1000 spectrometer was used to record the IR spectra in the frequency range 450–4000 cm−1 at room temperature. The sample was formed into pellets using KBr.The UV-visible absorption spectra of the [Cd(Br)2(S-NA)2] was measured at room temperature with a Varian Cary 5000 UV-Vis-NIR spectrophotometer in the wavelength range of 200 to 1000 nm. The photoluminescence spectra were performed at room temperature using a Horiba FluoroMax 4 spectrometer, with various applied excitation wavelengths.
Thermal measurements
The raw crystals of [Cd(Br)2(S-NA)2] were subjected to thermal analysis using a TG/DTA instrument (SETSYS Evolution), which used Pt crucibles and Al2O3 (100 μL) as reference material. The measurements were elaborated under N2 flow at a rate of 100 mL min−1, in the range 20–600 °C with a heating rate of 5 °C min−1. The thermograms were collected using a 16.69 mg sample.Theoretical calculations
The VASP program with Vienna Ab initio Simulation Package32,33 was used to calculate density functional theory (DFT). The Perdew–Burke–Ernzerhof (PBE), or the generalized gradient approximation (GGA) was used to represent the exchange–correlation function.34,35 The projector-augmented wave (PAW) pseudo-potentials were used to describe the interaction between ions and electrons. A plane-wave basis with a cutoff energy of 500 eV was used to extend the electrical wave functions. For structural geometry optimization and self-consistent computation, the Brillouin zone were sampled with a 13 × 13 × 1 and 7 × 7 × 1 Monkhorst–Pack mesh. The convergence criterion of were 10−4 eV in force and 10−6 eV per atom in energy were used to optimize the structure.36Results and discussion
Structure description
Single crystal X-ray diffraction (XRD) analysis indicates that [Cd(Br)2(S-NA)2] crystallizes in the monoclinic system with the non-centro symmetric space grope I2; the details of data collection and structure refinement are provided in Table S1 (ESI†). The purity of the crystalline phase was checked using X-ray diffraction powder (Fig. S3, ESI†).The asymmetric unit of this compound (Fig. 2(a)) consists of a half Cd(II) ion coordinated to the (S-NA) ligand and a bromine ion due to the position of the Cd atom on the 2-fold axes. The tetrahedral coordination environment of Cd(II) is symmetrically generated as presented in Fig. 2(b), and all details of bond length and angles are shown in Table S2 (ESI†).
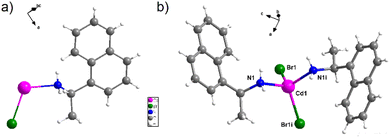 | ||
| Fig. 2 (a) Asymmetric unit of [Cd(Br)2(S-NA)2], (b) geometric site of the Cd(II) ion completed by symmetry [(i) −x + 1, y, −z + 1]. | ||
The metallic center is four-fold coordinated by two nitrogen atoms symmetrically generated (N1 and N1i) from the organic ligand and tow bromide ions (Br1 and Br1i). The Cd–Br bond length are found to be 2.5682 (12) Å and Cd–N1 = 2.259 (10) Å, and all bond lengths are similar to related compounds within the same environment.10,37,38
According to the four-coordinate geometry index (τ4), defined by L. Yang and his co-workers:39
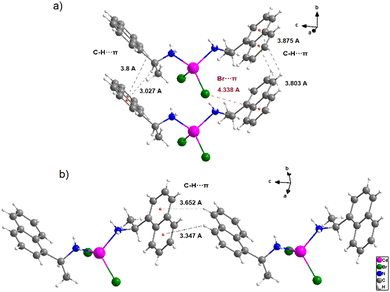
The projection of the unit cell along the a axis presented in Fig. 3(a), shows that the Cd(II) complex appears as a mononuclear units in the crystal, weakly bonded to each other via N–H⋯Br hydrogen bonds and van der Waals interactions. The N–H groups are involved in intermolecular hydrogen bonds to the adjacent bromide atoms with an average distance of 3.5645 Å (Fig. 3(b)). Table S3 (ESI†) presents the main hydrogen bond lengths and bond angles.
 | ||
| Fig. 3 (a) the structure projection on the (b) and (c) plane, and (b) intermolecular hydrogen bonds. | ||
Those H-bonds enable the construction of limitless 1-D columns with mononuclear complexes arranged in parallel. This supramolecular 1-D column is even further stabilized by C–H⋯π between the aromatic rings of the coordinated naphthyl group and the adjacent hydrogen atoms, with hydrogen to centroid distances ranging from 3.347 to 3.652 Å (Fig. 4). The bromide atoms coordinating the cadmium center also participate in this stacking contact by the Br⋯π interactions with a bromide to centroid distance around 4.338 Å.
Hirshfeld surface analysis
Hirshfeld surfaces (HSs)45 with the 2-D fingerprint plots that are included with them are unquestionably crucial tools for understanding multi-component of crystal structures.46 Their potential is driven by the fact that the researched molecule (existing from the inside of a certain crystal environment) is considered as a whole, as opposed to the normal structure description, which concentrates on randomly defined interactions, generally the strongest. Moreover, looking at HSs mapped with certain functions (such as d(norm) and shape index) allow for quick visual observation of interactions of different strengths. More crucially, HSs and 2D FPs analyses allow us to evaluate all non-covalent interactions created by the molecule in concern, which offers a good way to study more all the interactions present in the crystalline structures.47,48The goal of this investigation is to discover and quantify the variations in contact contributions to the HS for this complex. Studying the dnorm-mapped HS of [Cd(Br)2(S-NA)2] reveals two separate areas with different numbers and types of intermolecular interactions (Fig. 5).
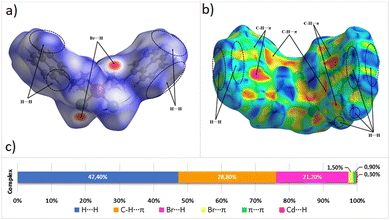 | ||
| Fig. 5 Hirshfeld surfaces of (a) mapped with dnorm function, (b) mapped with the shape index, and (c) the distribution of intermolecular contacts, as determined by HS analysis. | ||
The existence of red spots that result from the hydrogen bond belongs to the nitrogen donor atoms and the bromide acceptor atoms (N–H⋯Br contacts ratio of 21.8% from the HSs). On the edge of the organic part in HS, we note predominant H⋯H contact (47.4% of the HS). Moreover, the aromatic rings of the S-1-(1-naphthyl)ethylamine are responsible for the C–H⋯π contacts with an amount of 28.8% of the HS. The Br⋯π and π⋯π have the lowest Hirshfeld surface with values of 1.5% and 0.9%, respectively, but they are still important as electronic transitions.
IR spectroscopy and thermal stability
The IR spectrum in Fig. S1 (ESI†) presents the most intense absorption bands related to S-1-(1-naphthyl)ethylamine ligand in our compound. The observed bands in the range 3500–3137 cm−1 are attributed to the symmetric and antisymmetric stretching of (N–H) related to the NH2 group. The bands observed around 1581 cm−1 may be related to the out-of-plane bending vibrations of NH2 group. Between 3164 and 2902 cm−1, relatively weak bands are associated with the (C–H) mode of the aromatic and methylene groups. The observed bands around 1510 cm−1 and 779 cm−1 are related to m(C![[double bond, length as m-dash]](https://www.rsc.org/images/entities/char_e001.gif) C) and the out of-plane C–H band in the ring, respectively (Fig. S1, ESI†). Moreover, comparing the two FTIR graphs of [Cd(Br)2(S-NA)2] and (S-NA) indicates that there are effective hydrogen bond interactions between the NH2 groups and the Br atoms of the top adjacent molecule, making the C–N stretching vibration in S-NA shift from 1094 to 1129 cm−1. This result illustrates the coordination between amino group of the ligand (S-NA) and Cd2+ cations.
C) and the out of-plane C–H band in the ring, respectively (Fig. S1, ESI†). Moreover, comparing the two FTIR graphs of [Cd(Br)2(S-NA)2] and (S-NA) indicates that there are effective hydrogen bond interactions between the NH2 groups and the Br atoms of the top adjacent molecule, making the C–N stretching vibration in S-NA shift from 1094 to 1129 cm−1. This result illustrates the coordination between amino group of the ligand (S-NA) and Cd2+ cations.
The TG/DTA graph is presented in Fig. S2 (ESI†); the TG curve shows that [Cd(Br)2(S-NA)2] undergoes a one-step decomposition process and is stable up to 300 °C. Beyond this temperature, specifically at approximately 368 °C, there is a detected decrease in weight. During this, the compound lost about 33.39% of the principal weight assigned to the loss of the organic ligand S-NA (the theoretical value is 28.07%). In the TDA curve, one exothermic peak was observed at 365 °C, corresponding to the decomposition by combustion of the organic ligand.
UV-vis absorption analysis
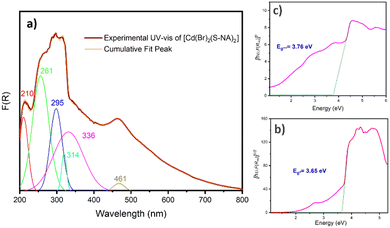
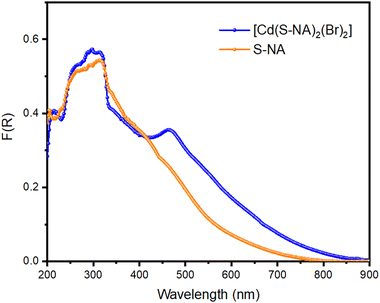
To explore the coordination mechanism of S-NA and Br ligands with the Cd2+ ion, the solid-state UV-vis diffuse reflection spectrum was transformed into the absorption spectrum F(R) (Fig. 6(a)) using the Kubelka–Munk fonction:49where the reflectance (R), the absorption coefficient (K), and the scattering coefficient (S), and K represents the Kubelka–Munk absorption coefficient explicitly. The two feature intense absorption bands at 210, 261, and 296 nm can be assigned to n → π* and π → π* transitions of the S-1-(1-naphthyl)ethylamine moiety,47,50 respectively. The absorption band at 314 nm may be attributed to the metal-to-ligand charge transfer (MLCT) and the one at 336 nm is due to the electronic transitions between the bromine atoms within the aromatic rings of the organic ligands. The last observed absorption band appearing at 461 nm is ascribed to the metal-to-ligand charge transfer through the bromide ions of the tetrahedral coordination sphere of the cadmium atoms. Indeed, this absorption band does not appear in the absorption spectrum of the ligand (Fig. 7).
The Tauc plot method was utilized to estimate the material's direct and indirect optical band gap.51 This method establishes a relationship between the gap energy value and the absorption coefficient (α), which are generated using the Tauc relation. This relation, represented as αhν = A(hν − Eg)m, incorporates various constants, including Planck's constant (h), the constant A, and exponent “m”, which characterizes the gap transition nature. Specifically, m equals 1/2 for direct allowed transitions and 2 for indirect allowed transitions. Since the Kubelka–Munk absorption (F(R)) is proportional to the material's absorption coefficient, the Tauc relation can be expressed as F(R)hν = A(hν − Eg)m. Direct and indirect band gap energies were determined to be 3.65 and 3.76 eV, respectively (Fig. 6(b) and (c)). The obtained energy gap values were deemed reasonable, as they were found to be in close agreement with recently reported values for Cd-based complexes.52–54
However, in pursuit of a more accurate and truthful assignment, we deemed it worthwhile to conduct UV-Vis spectra analysis for the organic ligand. This approach has consistently demonstrated its ability to provide valuable insights for the assignment of the various transitions within the complex (Fig. 7). The experimental spectrum of the organic ligand (S-NA) reveals a broad absorption band resulting from the overlap of three main absorption bands at 203 nm, 260 nm and 313 nm. These absorption bands still exist in the complex [Cd(Br)2(S-NA)2] and can be attributed therefore to the n–π* and π–π* transitions (inter and intra molecules) for ligand to ligand charge transfer (LLCT). However, uncertainties remain in accurately attributing the shoulder and transitions at lower energies.21–24 The absorption band around 461 nm exists only in the absorption spectrum of [Cd(Br)2(S-NA)2], consistent with the MLCT charge transfer via the bromine atoms of the coordination sphere of the cadmium atom.
To study the semiconducting electronics mechanism of this new organometallic complex, we calculated the band structure and the density of states (DOS) using density functional theory (DFT).
As illustrated in Fig. 8(a), the maximum of the valence band (VB) and the minimum of the conduction band (CB) are placed at the E and Y2 points, respectively, confirming that [Cd(S-NA)2(Br)2] exhibits an indirect-band-gap semi-conductor. This last gives a theoretical value of 2.89 eV. Besides, with the analyses of the partial density of states presented in Fig. 8(c), surely, the organic part S-NA (H-1s, C-2s and N-2s2p) overlap entirely within the range from −19 to −0.9 eV. This result confirms the strong covalent connection between C–H and N–H bonds. The inorganic moiety CdBr2 (Br-4s, Br-4p, Cd-5s, Cd-4p and Cd-4d), overlap completely inside the range −10 and −1 eV with the N-2p orbitals, proves the covalent bonding between the bromine anion and the metallic center. In addition, the top of the VBs are dominated by C-2p and N-2p states from the π conjugated organic moiety with also a low contribution from the Br-4p and the three orbitals of Cd (5s/4p/4d). The bottom of CBs are completely composed of C-2p/Cd-5s states and with the presence of a weak contribution of Cd-4s, Cd-4p, and the two orbitals of nitrogen and bromide (s and p) states from inorganic skeletons (zoomed Fig. S4 of PDOS, ESI†). Therefore, the main optical absorption of this Compound below 310 nm mainly derives from the electron transitions of C–H⋯π within the organic cations, which is similar to some hybrid compound containing conjugated organic cations.55
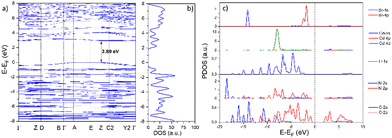 | ||
| Fig. 8 Density function simulation (DFT) of [Cd(Br)2(S-NA)2]; (a) band structure, (b) total density of states (DOS), and (c) partial density of states (PDOS). | ||
Photoluminescence properties
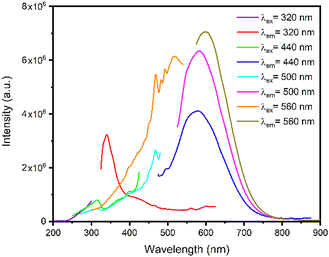
In this section, we explore the steady-state photoluminescence properties of [Cd(Br)2(S-NA)2]. Since the material's indirect gap energy is 3.76 eV (329 nm), higher excitation photon energy was selected. Fig. 9(a) presents the emission spectra collected using a different excitation energies of 3.9 eV (320 nm), 2.81 eV (440 nm), 2.48 eV (500 nm) and 2.21 eV (560 nm).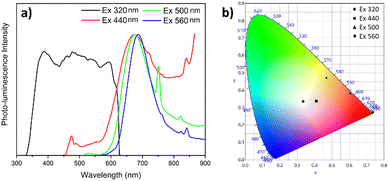 | ||
| Fig. 9 (a) Emission spectra (under different excitations 320, 440, 500, and 560 nm) of [Cd(S-NA)2(Br)2], and (b) CIE chromaticity coordinates. | ||
To better understand the photoemission source within the crystal, we reduced first the excitation photon wavelength to 320 nm below the gap energy. In this case, the material exhibits a broad emission spectrum spanning the entire visible region, resulting in a white-light emission. This emission was produced by combining the organic fluorescence from the organic S-NA ligand and the red phosphorescence exhibited by the Cd metallic centers, confirming that our material may be an acceptable option for white-light emitter lighting application. Under this excitation, the chromaticity coordinates of the light beams emitted by our material are (0.33, 0.33), the same as that of ideal solar light (Fig. 9(b)). The same phenomenon was studied in the case of (H2DABCO)(Pb2Cl6) compound56 where the organic component produces the blue emission, whereas the inorganic part is responsible for the yellow emission.
Using a higher excitation wavelength of 440 nm, 500 nm and 560 nm, the absorbed wavelength by the complex undergo metal to ligand charge transfer (LMCT). In this case, the anti-bonding orbital of the metal-halide bond (X is generally a weak-field ligand, such as Br− or I−) may have lower energy than the π* orbital of the S-1-(1-naphthyl)ethylamine ligand, resulting in the metal–halide bond becoming the lowest unoccupied molecular orbital (LUMO). The statement regarding the calculated chromaticity coordinates (x, y), color rendering index (CRI), and correlated color temperature (CCT) for the emitted by [Cd(Br)2(S-NA)2] observed under different excitations are presented in Table 1.
| λ ex (nm) | 320 | 440 | 500 | 560 |
|---|---|---|---|---|
| (x, y) | (0.33, 0.33) | (0.40, 0.33) | (0.60, 0.38) | (0.52, 0.43) |
| CRI | 92 | 75 | 84 | 76 |
| CCT | 5392 | 2893 | 1349 | 3023 |
In the solid state, when excited at a wavelength of λex = 320 nm, the ligand S-NA exhibits emission with a band concentrated around 342 nm which can be tentatively assigned to the π* → π transitions of the aromatic rings of the ligands.21–23 Moreover, the higher excitation wavelengths, from 440 nm to 560 nm, generate higher emission peaks red-shifted from 583 nm to 601 nm with higher intensities when compared to the excitation wavelengths. Therefore, these emissions can be mainly ascribed to the intra- and the inter- ligands transitions21,25,26 (Fig. 10). In addition, we note the appearance of a relatively intense emission band around 750 nm under an excitation of 500 nm, resulting from the phosphorescence emission from the triplet states of the organic moiety.30
Conclusions
In summary, a new organometallic complex [Cd(Br)2(S-NA)2], presenting a tetrahedral Cd(II) geometry, was obtained. The metallic center coordinated to two bromine and two organic ligands S-1-(1-naphthyl)ethylamine, has been elaborated with crystal growth technique by slow evaporation at room temperature. The non-centrosymmetric crystalline structure reveals several interactions, such as the strong hydrogen bonds N–H⋯Br, others C–H⋯π, and π–π stacking between organic ligands that generate the crystal packing. This material is optically studied to analyse its semiconducting behavior better. The UV-Vis absorption analysis exhibits a large absorption band in the UV and visible regions; the direct and indirect estimated gap energies are 3.76 and 3.65 eV, respectively. The DFT verified the experimental results and the band structure, revealing that this compound shows an indirect band gap. Under an excitation wavelength of 320 nm, the solid-state photoluminescence manifests a white light emission with a broad spectrum.In addition, higher different excitations give a near infrared-emission band localized between 600 and 900 nm. The broad spectrum and the white light emission observed in the solid-state photoluminescence measurements suggest that this material could be valuable as a more efficient photoluminescence material in colorful lighting or display devices.
Author contributions
M. Gassara conducted the synthesis, data curation, and writing the original draft; X. Liu performed the theoretical calculations; A. Guesmi and N. Ben Hamadi carried out the XRD data collection; A. Houas facilitated the photoluminescence measurements; H. Naïli supervised the whole research work.Conflicts of interest
There are no conflicts to declare.Acknowledgements
This work was supported and funded by the Deanship of Scientific Research at Imam Mohammad Ibn Saud Islamic University (IMSIU) (grant number IMSIU-RP23011).References
- F. L. Thorp-Greenwood, Organometallics, 2012, 31, 5686–5692 CrossRef CAS
.
- T. N. Nguyen, F. M. Ebrahim and K. C. Stylianou, Coord. Chem. Rev., 2018, 377, 259–306 CrossRef CAS
.
- W. Al Zoubi, M. P. Kamil, S. Fatimah, N. Nisa and Y. G. Ko, Prog. Mater. Sci., 2020, 112, 100663 CrossRef CAS
.
- F. F. Muhammad and K. Sulaiman, Mater. Chem. Phys., 2014, 148, 473–477 CrossRef CAS
.
- S. Arroudj, A. Aamoum, L. Messaadia, A. Bouraiou, S. Bouacida, K. Bouchouit and B. Sahraoui, Phys. B, 2017, 516, 1–6 CrossRef CAS
.
- D. E. Barry, D. F. Caffrey and T. Gunnlaugsson, Chem. Soc. Rev., 2016, 45, 3244–3274 RSC
.
- Y. Cui, B. Chen and G. Qian, Coord. Chem. Rev., 2014, 273–274, 76–86 CrossRef CAS
.
- H. S. Quah, W. Chen, M. K. Schreyer, H. Yang, M. W. Wong, W. Ji and J. J. Vittal, Nat. Commun., 2015, 6, 1–7 Search PubMed
.
- F. Paquin, J. Rivnay, A. Salleo, N. Stingelin and C. Silva, J. Mater. Chem. C, 2015, 3, 10715–10722 RSC
.
- F. A. Afkhami, A. A. Khandar, G. Mahmoudi, W. Maniukiewicz, A. V. Gurbanov, F. I. Zubkov, O. Şahin, O. Z. Yesilel and A. Frontera, CrystEngComm, 2017, 19, 1389–1399 RSC
.
- G. Yuan, Q. Zhang, Z. Wang, K. Song, X. Yuan, Y. Wang and L. Zhang, Inorg. Chem. Front., 2017, 4, 764–772 RSC
.
- V. W. W. Yam and K. M. C. Wong, Chem. Commun., 2011, 47, 11579–11592 RSC
.
- V. W. W. Yam, V. K. M. Au and S. Y. L. Leung, Chem. Rev., 2015, 115, 7589–7728 CrossRef CAS PubMed
.
- T. Hajiashrafi, S. Salehi, M. Kubicki, A. Bauzá, A. Frontera, K. J. Flanagan and M. O. Senge, CrystEngComm, 2019, 21, 6301–6312 RSC
.
- H. Xiao, J. Zhou and X. Liu, Dalton Trans., 2018, 47, 4833–4839 RSC
.
- S. Adhikari, T. Bhattacharjee, A. Das, S. Roy, C. G. Daniliuc, J. K. Zareba, A. Bauzá and A. Frontera, CrystEngComm, 2020, 22, 8023–8035 RSC
.
- A. Ito, M. Iwamura and E. Sakuda, Coord. Chem. Rev., 2022, 467, 214610 CrossRef CAS
.
- R. Roccanova, W. Ming, V. R. Whiteside, M. A. McGuire, I. R. Sellers, M. H. Du and B. Saparov, Inorg. Chem., 2017, 56, 13878–13888 CrossRef CAS PubMed
.
- M. A. Brza, S. B. Aziz, H. Anuar, F. Ali, E. M. A. Dannoun, S. R. Saeed, S. J. Mohammed and R. T. Abdulwahid, Opt. Mater., 2021, 116, 111062 CrossRef CAS
.
- C. C. Cheng, N. N. Shen, C. F. Du, Z. Wang, J. R. Li and X. Y. Huang, Inorg. Chem. Commun., 2017, 85, 21–25 CrossRef CAS
.
- S. Elleuch, I. Triki and Y. Abid, Mater. Res. Bull., 2022, 150, 111754 CrossRef CAS
.
- S. E. Korolenko, K. P. Zhuravlev, V. I. Tsaryuk, A. S. Kubasov, V. V. Avdeeva, E. Malinina, A. S. Burlov, L. N. Divaeva, K. Y. Zhizhin and N. T. Kuznetsov, J. Lumin., 2021, 237, 118156 CrossRef CAS
.
- X. Fan, L. Jiang, Y. Liu, W. Sun, Y. Qin, L. Liao and A. Qin, Opt. Mater., 2023, 137, 113620 CrossRef CAS
.
- M. Formica, G. Favi, V. Fusi, L. Giorgi, F. Mantellini and M. Micheloni, J. Lumin., 2018, 195, 193–200 CrossRef CAS
.
- L. Y. Hao, X. Xu, C. C. Yan, H. H. Xie, F. M. Wang, S. H. Yan and S. F. Tang, Inorg. Chem., 2023, 62, 2236–2243 CrossRef CAS PubMed
.
- T. E. Kokina, M. I. Rakhmanova, N. A. Shekhovtsov, L. A. Glinskaya, V. Y. Komarov, A. M. Agafontsev, A. Y. Baranov, P. E. Plyusnin, L. A. Sheludyakova, A. V. Tkachev and M. B. Bushuev, Dalton Trans., 2020, 49, 7552–7563 RSC
.
- J. Y. Zeng, X. S. Wang and X. Z. Zhang, Chem. - Eur. J., 2020, 26, 16568–16581 CrossRef CAS PubMed
.
- A. Saha Roy, P. Saha, P. Mitra, S. Sundar Maity, S. Ghosh and P. Ghosh, Dalton Trans., 2011, 40, 7375–7384 RSC
.
- P. Sudhakar and T. P. Radhakrishnan, J. Mater. Chem. C, 2019, 7, 7083–7089 RSC
.
- R. Msalmi, S. Elleuch, B. Hamdi, W. Abd El-Fattah, N. Ben Hamadi and H. Naïli, RSC Adv., 2022, 12, 10431–10442 RSC
.
- G. M. Sheldrick, Acta Crystallogr., Sect. C: Cryst. Struct. Commun., 2014, 3–8 Search PubMed
.
- M. M. Voronov, A. B. Pevtsov, S. A. Yakovlev, D. A. Kurdyukov and V. G. Golubev, Phys. Rev. B: Condens. Matter Mater. Phys., 2014, 89, 1–7 CrossRef
.
- J. P. Perdew, K. Burke and M. Ernzerhof, Phys. Rev. Lett., 1996, 77, 3865–3868 CrossRef CAS PubMed
.
- D. Joubert, Phys. Rev. B: Condens. Matter Mater. Phys., 1999, 59, 1758–1775 CrossRef
.
- J. P. Perdew, K. Burke and M. Ernzerhof, Phys. Rev. Lett., 1996, 77, 3865–3868 CrossRef CAS PubMed
.
- H. J. Monkhorst and J. D. Pack, Phys. Rev. B: Solid State, 1976, 13, 5188–5192 CrossRef
.
- A. Di Santo, G. A. Echeverría, O. E. Piro, H. Pérez, A. Ben Altabef and D. M. Gil, J. Mol. Struct., 2017, 1134, 492–503 CrossRef CAS
.
- V. Amani, J. Mol. Struct., 2018, 1155, 477–483 CrossRef CAS
.
- L. Yang, D. R. Powell and R. P. Houser, J. Chem. Soc., Dalton Trans., 2007, 955–964 RSC
.
- G. Ramasamy and S. Meenakshisundaram, J. Cryst. Grow., 2013, 377, 197–202 CrossRef CAS
.
- I. Shimizu, Y. Morimoto, D. Faltermeier, M. Kerscher, S. Paria, T. Abe, H. Sugimoto, N. Fujieda, K. Asano, T. Suzuki, P. Comba and S. Itoh, Inorg. Chem., 2017, 56, 9634–9645 CrossRef CAS PubMed
.
- R. S. Bitzer, L. C. Visentin, M. A. C. Nascimento and C. A. L. Filgueiras, J. Coord. Chem., 2016, 69, 3261–3283 CrossRef CAS
.
- A. Báez-Castro, J. Baldenebro-López, A. Cruz-Enríquez, H. Höpfl, D. Glossman-Mitnik, M.-S. Valentín, M. Parra-Hake and J. J. Campos-Gaxiola, RSC Adv., 2014, 4, 42624–42631 RSC
.
- J. H. Palmer and G. Parkin, Dalton Trans., 2014, 43, 13874–13882 RSC
.
- J. J. McKinnon, D. Jayatilaka and M. A. Spackman, Chem. Commun., 2007, 3814–3816 RSC
.
- A. Castineiras, I. García-Santos, J. M. González-Pérez, A. Bauzá, J. K. Zareba, J. Niclós-Gutiérrez, R. Torres, E. Vílchez and A. Frontera, Cryst. Growth Des., 2018, 18, 6786–6800 CrossRef CAS
.
- G. Mahmoudi, J. K. Zaręba, A. V. Gurbanov, A. Bauzá, F. I. Zubkov, M. Kubicki, V. Stilinović, V. Kinzhybalo and A. Frontera, Eur. J. Inorg. Chem., 2017, 4763–4772 CrossRef CAS
.
- W. Jabeur, R. Msalmi, M. Korb, F. Hassen, A. Guesmi, A. Houas, N. Ben Hamadi and H. Naïli, CrystEngComm, 2022, 24, 8467–8476 RSC
.
- W. Zhou, A. Bahi, Y. Li and F. Ko, RSC Adv., 2013, 11614–11620 RSC
.
- K. Liu, W. Shi and P. Cheng, Dalton Trans., 2011, 40, 8475–8490 RSC
.
- X. Liu, S. M. Cho, S. Lin, Z. Chen, W. Choi, Y. M. Kim, E. Yun, E. H. Baek, D. H. Ryu and H. Lee, Matter, 2022, 5, 2306–2318 CrossRef CAS
.
- E. Kavitha, C. Karnan, S. Manivannan and J. Madhavan, Chem. Data Collect., 2021, 31, 100594 CrossRef
.
- R. Jabbar and S. Kamoun, J. Inorg. Organomet. Polym. Mater., 2020, 30, 649–657 CrossRef CAS
.
- L. Fan, S. Hao, S. He, X. Zhang, M. Li, C. M. Wolverton, J. Zhao and Q. Liu, Dalton Trans., 2023, 52, 5119–5126 RSC
.
- M. Gassara, R. Msalmi, X. Liu, F. Hassen, A. Moliterni, N. Ben Hamadi, A. Guesmi, L. Khezami, T. Soltani and H. Naïli, RSC Adv., 2022, 12, 33516–33524 RSC
.
- G. E. Wang, G. Xu, M. S. Wang, L. Z. Cai, W. H. Li and G. C. Guo, Chem. Sci., 2015, 6, 7222–7226 RSC
.
Footnote |
| † Electronic supplementary information (ESI) available. CCDC 2081813. For ESI and crystallographic data in CIF or other electronic format see DOI: https://doi.org/10.1039/d3ma00581j |
| This journal is © The Royal Society of Chemistry 2024 |


