 Open Access Article
Thermal catalytic mineralization of ortho-dichlorobenzene at low temperature: an in situ FT-IR and XPS mechanistic investigation†
Adarsh
Kumar
ab,
Deepak
Tyagi
ab,
Salil
Varma
ab,
Hushan
Chand
c,
V.
Krishnan
 c,
K.
Bhattacharyya
 *ab and
A. K.
Tyagi
 *ab
*ab
aChemistry Division, Bhabha Atomic Research Centre, Mumbai-400 085, India. E-mail: kaustava@barc.gov.in; aktyagi@barc.gov.in
bHomi Bhabha National Institute, Mumbai – 400 094, India
cIndian Institute of Technology- Mandi, Kamand, Mandi – 175 075, India
First published on 18th December 2023
Abstract
Generally, the mineralization of ortho-dichlorobenzene (o-DCB) [a surrogate moiety representing dioxin and furans (D&Fs)] over mixed oxide catalysts occurs at 175 °C with the substantial participation of the lattice oxygen from the catalyst and support. However, it is necessary to reduce the mineralization temperature of any incineration process generating D&Fs from the off-gas stream. In the present work, for the first time, the above-mentioned mineralization reaction was performed at a temperature as low as 120 °C under static conditions over a biphasic catalyst in the form of V2O5–WO3 dispersed on a CeO2 support (VWC). The CeO2 support was primarily chosen to enhance the synergistic effect of labile lattice oxygen, which primarily affects the reaction temperature and the kinetics to a great extent. The mechanistic understanding for this biphasic catalyst was developed by separately delineating the individual mechanistic role of V2O5–CeO2 (VC) and WO3–CeO2 (WC). Effectively, the kinetics and mineralization temperature of the three catalysts (VC, WC and VWC) were different, which is attributed to the different surface intermediates formed over the catalytic surface under oxidative and non-oxidative conditions. Even in the absence of oxygen, these catalysts mineralized o-DCB, thereby substantiating their Mars–Van Krevelen (MVK)-type mechanistic behaviour. Herein, we primarily focused on the thermal catalytic reaction mechanism of o-DCB mineralization, which was established using the in situ FT-IR technique. Furthermore, the extensive XPS-based analysis revealed the different adsorption and reaction sites for particular catalysts along with the synergistic role of the CeO2 support, which will create a new avenue for the mineralization of very toxic VOCs, such as dioxins and furans.
1. Introduction
Non-biodegradable persistent environmental pollutants (POPs) possess a very high residence time in the environment and human body. Among them, the most toxic POPs are polychlorinated dibenzo-para-dioxins (PCDDs) and polychlorinated dibenzofurans (PCDFs), consisting of 210 congeners, which are collectively known as dioxin and furans (D&Fs). Presently, 17 congeners are highly toxic and are considered A1 carcinogens, with 2,3,7,8-tetra chloro-dibenzo-para-dioxin (2,3,7,8-TCDD) [TEF = 1 (LD50 = 0.04 mg kg−1)] being identified as one of the most toxic compound.1 However, it should be noted that D&Fs do not occur naturally and are mainly products of different incineration processes having a chlorine source together with combustion, industrial, and reservoir sources.2–4PCDDs and PCDFs are A1 carcinogens and owing to their high toxicity, high biological half-life, high environmental persistence, bioaccumulation, and carcinogenicity, should not be present in the atmosphere, and hence they need to be either completely degraded or mineralized to CO2.5–8 To date, one of the major strategies developed is the thermal catalytic mineralization of D&Fs. The different types of catalysts reported thus far for the total oxidation of PCDD/Fs can be broadly classified into three types based on noble metals,9,10 transition metals11–13 and zeolites.14,15 In the case of noble metal catalysts, although they possess high catalytic activity and fast kinetics, a major bottleneck is their susceptibility to deactivation by the adsorption of chlorine and their high activation temperature, together with stability issues. Alternatively, transition metal oxides (Cr, Co, Mn, Mo, V, W, etc.) together with rare earth oxides of Ce and Zr possess high catalytic activity and can withstand chlorine deactivation, together with the advantage of being inexpensive, making them a better choice compared to noble metals.16 This has led to the use of a plethora of biphasic transition metal oxide-based catalysts over various supports for the complete decomposition of PCDD/Fs.17 In the dominant set of mixed oxide catalysts used for the degradation of PCDD/Fs and emission control, the vanadium oxides (VOx) have been proven to be more efficient compared to other catalysts. Besides the catalyst, the support also plays an important role, where TiO2 was observed to be the most effective support for V2O5, whilst the addition of a WO3 phase further improved the activity and stability of the catalyst.18 Owing to the high toxicity of PCDD/PCDFs and their high cost, ortho-dichlorobenzene (o-DCB) is used as a model compound, which resembles 2,3,7,8-TCDD except for its O-moieties, making a good alternative. This ensures a similar route for adsorption over the catalytic surface together with the formation of similar types of intermediates. Therefore, it has been widely used as a model compound instead of PCDDs.
The oxidation of o-DCB over supported vanadium catalysts was reported by Krishnamoorthy and co-workers,19–21 demonstrating that V2O5 supported on either TiO2 or Al2O3 is active for the oxidation of o-DCB and its aromatic ring remains intact throughout the process of adsorption on the catalyst surface. Different surface species such as phenolates, quinonates, acetates, and maleates are formed on V2O5/TiO2 (VT) for the degradation of m-DCB over VT surface sites.22 Acetates and formates as intermediates species were also observed on the surface of Ca-doped FeOx, which further degraded to CO2.23,24 As discussed earlier, noble metals dispersed on zirconia (Pd–Co sulfated zirconia catalysts) provided Lewis acidic sites for both the adsorption and reaction of o-DCB.5
In their recent review, Banares et al.25 showed that ceria-based catalysts are widely investigated for the thermal degradation of volatile organic compounds (VOCs), where VOC oxidation on ceria proceeds through the Mars–van Krevelen mechanism and lattice oxygen the in ceria plays a significant role. Mixed oxides of ceria and titania have higher activity for the oxidation of 1,2 dichloroethane to CO2 and HCl compared to either pure CeO2 or TiO2 catalysts.26 Collins et al. reported the use of V2O5–CeO2 catalysts for methanol adsorption,27 and Sauer et al. showed in their ab initio studies that CH3OH may chemisorb at the V–O–Ce interphase bond and form V–OCH3 species, where H is transferred to the ceria surface. In the V2O5–CeO2 system, ceria is directly involved in the redox process, given that two electrons are accommodated in the Ce-f states, forming two Ce3+ ions, whereas vanadium remains fully oxidized (V5+).28 Vanadium-substituted ceria, in addition to its high activity for the oxidation of organochlorides29 and organosulfur compounds, which poison most catalysts,30 tolerates H2S, NOx, and SO2. The strong interactions between MnOx and CeO2 produce structural and thermal stabilization, making Mn-substituted catalysts resistant to moisture.31 The selective catalytic reduction (SCR) of NO by NH3 was reported by Chen et al. using the surface of the MxOy/MoO3/CeO2 system and they showed that the reactivity of the metal oxide catalysts follows the order of NiO/MoO3/CeO2 > CuO/MoO3/CeO2 > Fe2O3/MoO3/CeO2.32 Similarly, WO3/CeO2 catalysts with different support morphologies were also utilised for the selective catalytic reduction of NO by NH3 (NH3-SCR).33
In previous studies by our group, we focused on determining the effective intermediates that are formed on the V2O5–WO3 catalyst dispersed on TiO2 (VWT) to prove that lattice oxygen plays a major role in the initiation of the reaction and assists the oxidation process together with oxygen absorbed from the air. However, in the absence of oxygen or air, the O-vacancies cannot mineralize the adsorbed o-DCB, leading to the formation of certain intermediates on their surfaces. Ceria (CeO2) is known to exhibit better labile lattice oxygen mobility, and thus considering this, it was employed as a support for the same mixed oxide catalysts to discuss the role of oxygen vacancies in driving the reaction. To understand this, herein we focused on the different intermediates formed on V2O5–WO3 dispersed on a CeO2 support for the mineralization of o-DCB in the presence and absence of air. To understand the effect of the biphasic mixed oxide catalyst on the CeO2 support, the mechanism was investigated using V2O5–CeO2 and WO3–CeO2 catalysts to decipher the role of each surface individually. Subsequently, this was extrapolated to V2O5 and WO3 dispersed together over the CeO2 support. Herein, given that the focus was understanding the different intermediates on the catalyst surface, the in situ FT-IR study was correlated with XPS studies for the catalyst after the reaction to locate the active sites that play a major role in the formation of the intermediates. It is expected that this will open a new path for the degradation of dioxin and furans, which is becoming one of the strongest hazards in incineration processes in industry.
2. Experimental
2.1. Synthesis of catalysts
The mixed oxide catalysts were prepared via a simple modified calcination process. Three catalysts were synthesized by this method, namely, V2O5 dispersed on CeO2, WO3 dispersed on CeO2 and (V2O5 + WO3) dispersed on CeO2, which were denoted as VC, WC and VWC, respectively. For synthesis of nano CeO2, cerium carbonate was heated at 350 °C for 3 h, resulting in the formation of the product (CeO2) in powdered form. Further, the catalysts were prepared via the wet impregnation method using CeO2 as the support. A stoichiometric amount of precursor solution for V2O5 (ammonium metavanadate) and WO3 (ammonium tungsten oxide) was added to cerous carbonate and further stirred for 1 h for complete mixing, followed by calcination at 350 °C for 3 h. The resulting solid mass was crushed to get the final product. VC was prepared using 5 wt% of V2O5 dispersed on CeO2; WC had 5 wt% WO3 dispersed on CeO2 and VWC possessed 5 wt% of V2O5 and WO3 on CeO2 in a 1![[thin space (1/6-em)]](https://www.rsc.org/images/entities/char_2009.gif) :
:![[thin space (1/6-em)]](https://www.rsc.org/images/entities/char_2009.gif) 1 stoichiometric ratio.
1 stoichiometric ratio.
2.2. Characterization
The structural phase analysis was carried out via powder X-ray diffraction (XRD) measurements using a Phillips analytical diffractometer with Ni-filtered Cu Kα radiation. The diffractograms were recorded in the 2θ range of 10°–80° (2θ) region. The average crystallite size was determined from the Scherrer equation after correcting for instrumental broadening. Laser Raman spectra were recorded on a HORIBA JOBIN YVON, LabRam HR 800 spectrometer (180° back-scattering geometry, excitation source: Ar+ ion laser, spectral resolution of 2 cm−1 and He–Ne laser (632.8 nm) as the excitation source). SEM micrographs were recorded using a Seron Inc. model AIS 2100 scanning electron microscope at 20 keV. EDS analyses were carried out using an Inca Energy 250 instrument coupled to a Vega MV2300t/40 scanning electron microscope. Transmission electron microscopy (TEM) images were obtained using a 200 kV FEI Tecnai T20 machine equipped with an LaB6 filament. TEM samples were prepared by placing a drop of ultrasonically dispersed powder (in alcohol) on a carbon-coated copper grid and drying in air. X-ray photoelectron spectroscopy (XPS) was performed using a Thermo Fisher Scientific NEXSA instrument operating at an anode voltage of 12 kV and filament current of 6.50 mA (1486.6 eV Al Kα dual anode source). The data was recorded at a pass energy of 50 eV under 9 × 10⁻⁸ mbar vacuum. As an internal reference for the absolute binding energy, the C-1s peak (284.5 eV) was used. All deconvolutions were performed using the CASA software with a Voigt-type peak having GL (75) to GL (30) without imparting any asymmetry. The baseline was made using the Shirley function. Thermogravimetric measurements were carried out using a LINSEIS TG-DSC instrument (Model no. STA PT 1600) at 10 °C min−1 under an inert atmosphere.2.3. In situ FT-IR studies
FTIR spectra were recorded on a Bruker V70 instrument in the spectral range of 4000–1000 cm−1 with KBr beam splitters and MCT detectors. The external unit XAS in the Bruker V70 for the in situ FT-IR studies possessed a SPECAC cell with an MCT detector and performed in the spectral range of 12![[thin space (1/6-em)]](https://www.rsc.org/images/entities/char_2009.gif) 000–600 cm−1. An external unit with a SPECAC cell was used as the in situ FT-IR study with a volume of 80 cc attached to the right side of the main unit. The SPECAC cell was coupled with a high vacuum facility (turbo-molecular pump (air-cooled) and a dry roughing pump), achieving a vacuum level of 10−6 mbar and temperature varying from 25 °C to 800 °C together with the typical safety features. It was typically used in the transmission mode with suitable windows (ZnSe) and with provision of at least three inlet and outlet ports for the evacuation and introduction of gases. In the case of the in situ studies, the MCT detector was used in the spectral range of typically 4000–1000 cm−1, which will be discussed later.
000–600 cm−1. An external unit with a SPECAC cell was used as the in situ FT-IR study with a volume of 80 cc attached to the right side of the main unit. The SPECAC cell was coupled with a high vacuum facility (turbo-molecular pump (air-cooled) and a dry roughing pump), achieving a vacuum level of 10−6 mbar and temperature varying from 25 °C to 800 °C together with the typical safety features. It was typically used in the transmission mode with suitable windows (ZnSe) and with provision of at least three inlet and outlet ports for the evacuation and introduction of gases. In the case of the in situ studies, the MCT detector was used in the spectral range of typically 4000–1000 cm−1, which will be discussed later.
The in situ FT-IR experiments were conducted as follows. Initially, the catalysts were ground in a mechanical grinder at least for a day, and then a self-supported pellet with a diameter of 10 mm, thickness of 0.8 mm and weight of 5–70 mg was made, which was subjected to 10−4 mbar pressure as a function of temperature in the range of ∼100–300 °C at an increment of 100 °C for around 3–6 h to clean the surface of the pellet, as shown in Fig. S1 (ESI†). The spectrum of each pellet was recorded at 50 °C to understand the effect of temperature. Fig. S1 (ESI†) shows the treatment for the V2O5–CeO2 catalyst as a function of temperature and time. Further, the pellet was cooled to room temperature under vacuum and the final spectrum of the pellet was recorded with air as the background. Subsequently, a background was recorded with pellet. Then, this pellet was exposed to 40 cc of 474 ppm ortho-dichlorobenzene (o-DCB)–air or 40 cc of o-DCB–He mixture, prepared in a glass bulb externally, respectively. Normally, 100 scans at a resolution of 4 were co-added, and the spectra were recorded using a similarly treated but unexposed pellet as the background. The adsorption of o-DCB on the pellet was initially monitored, which was followed by the effect of temperature on the adsorbed DCB on the catalysts.
3. Results
3.1. X-Ray Diffraction (XRD)
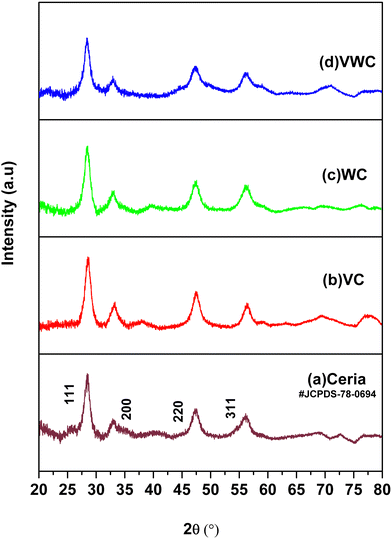
The X-ray diffraction (XRD) data for the different samples are presented in Fig. 1. The pattern of ceria synthesized by the calcination of cerous carbonate at 350 °C matches with JCPDS File No. 78-0694, which has a fluorite structure with the Fm3m (225) Fm3m space group (225).34 The XRD patterns for VC, WC and VWC possess the same peaks as that of ceria, which is mainly due to the fact that ∼5 wt% V2O5, WO3 and V2O5–WO3 were dispersed on the CeO2 substrate, and the individual peaks of the V2O5 and WO3 phases were not prominent in these XRD patterns, suggesting their fine dispersion, respectively.3.2. Raman spectroscopy
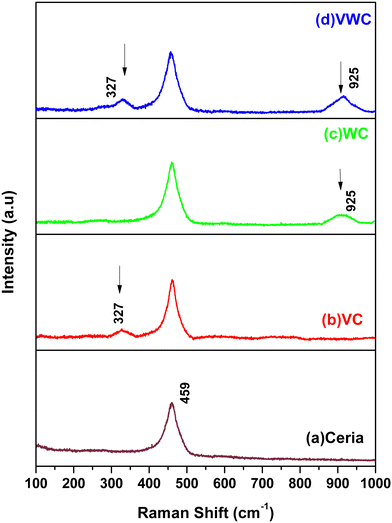
Cerium dioxide, CeO2, crystallizes in the cubic fluorite-type lattice and belongs to the O5h (Fm3m) space group. The group theoretical analysis predicted only one triply degenerate Raman-active optical phonon with F2g symmetry, which can be viewed as the symmetric breathing mode of the oxygen atoms around each cation, and two infrared-active phonons with Fu1 symmetry, corresponding to the LO and TO modes. Given that only the O atoms move, the frequency mode should be nearly independent of the cation mass. The first-order Raman spectrum of CeO2 is very simple and consists of only one Raman mode at 465 cm−1.35–37Fig. 2(a) shows the Raman spectra of CeO2, with a peak located at 465 cm−1 for the synthesised ceria. Fig. 2(b) sows the spectrum of V2O5-dispersed on CeO2, exhibiting a broad peak at 327 cm−1. Similarly, Fig. 2(c) shows a peak at 925 cm−1 for WO3 dispersed on CeO2. Finally, in the case of both V2O5 and WO3 dispersed together on ceria, both peaks at 327 cm−1 and 925 cm−1 were observed, as shown in Fig. 2(d). Generally, V2O5 possesses torsional and translational motions in the lower energy regime. Similarly, the presence of a peak at 928 cm−1 for the WC sample shows the presence of the WO3 phase on the CeO2 support. The major corresponding Raman peaks for WO3 [h-WO3 with space group P6/mnmZ] were observed at 948, 655, 377, 253 and 192 cm−1, respectively.38 A peak at 928 cm−1 (940 cm−1) was observed and the other peaks are present the same as that of the CeO2 support. In the of VWC sample (V2O5 and WO3 dispersed on CeO2), the appearance of peaks at 326.4 cm−1 and 928 cm−1 shows the presence of both V2O5 and WO3 in the sample. These studies indicate the advantage of Raman spectroscopy over XRD to decipher the presence of a small amount of catalyst very finely dispersed on the substrate.3.3. TEM studies
Transmission electron microscopy (TEM) images of the different materials are shown in Fig. (3) and the inset of the figure shows the selected area electron diffraction (SAED) of the materials. The particles were spheroid in shape with the size for the VC sample of ∼8 nm and VWC sample of ∼3–5 nm. Similarly, the WC sample (TEM not shown) also showed the particle size of ∼8 nm. The SAED pattern obtained for the VC sample shows the presence of V2O5 with the planes matching with JCPDS (77-2418) of V2O5 (details of SAED pattern given in Table S5(A) and (B) (ESI†) and the same for the VWC sample shows the presence of both V2O5 and WO3).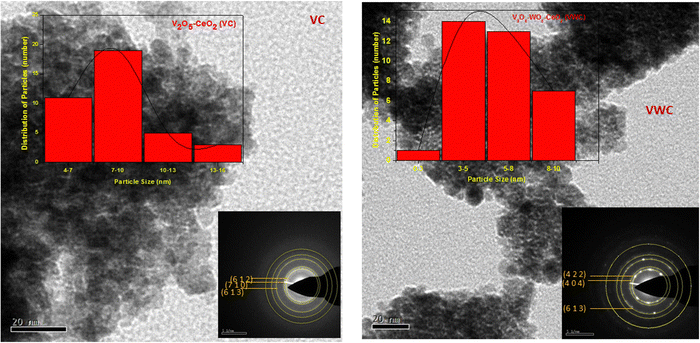 | ||
| Fig. 3 TEM images of the different samples and the inset shows the SAED pattern for VC-catalyst and VWC- catalyst. | ||
3.4. N2-adsorption experiments
Table 1 presents the specific surface area for all the samples synthesized in the present study, which reveals that ceria has the highest surface area of 168 m2 g−1, whereas V2O5 and WO3 dispersed on CeO2 exhibits the lowest surface area of 94 m2 g−1. The average pore size and total pore volume were also found to be maximum for the ceria sample. Fig. S2 (ESI†) illustrates the typical nitrogen adsorption–desorption isotherm obtained for ceria and the various catalysts dispersed on ceria.| Sl no. | Sample | BET surface area (m2 g−1) | BJH pore size (Å) | Pore volume (cm3 g−1) |
|---|---|---|---|---|
| 1 | Ceria | 168 | 38.3 | 0.056 |
| 2 | V2O5–CeO2 | 110 | 38.2 | 0.061 |
| 3 | WO3–CeO2 | 109 | 38.3 | 0.035 |
| 4 | V2O5–WO3–CeO2 | 94 | 38.3 | 0.043 |
The pore size distribution for ceria, as calculated from the desorption isotherm employing the Barret–Joyner–Halenda (BJH) method, shows a pore size of 38 Å. As shown in the isotherm, the hysteresis loop (type IV-IUPAC) (Fig. S2, ESI†) demonstrates the presence of mesopores in the sample. All the other samples also show similar hysteresis in their isotherm plots with inflection points lying in the p/p0 range of 0.45–0.7, suggesting mesoporosity in these samples, as presented in Table 1. The inflection observed at p/p0 of ∼0.9 can be attributed to the macropores caused by interconnected porosity. The surface area of ceria was reduced to 94 m2 g−1 with the dispersion of V2O5 and WO3 on it, which suggests the impregnation of V2O5/WO3 in the pores of ceria, leading to a reduction in its surface area.
3.5. FT-IR
The FT-IR spectrum of the cerium oxide nanoparticles is shown in Fig. S3(a) (ESI†), which clearly shows three intense peaks located at 3418, 1612 and below 700 cm−1. The weak absorption peaks at 2380 and 1430 cm−1 are attributed to the bending vibration of the C–H bands of the residual incorporated surfactant. Furthermore, the O–C–O stretching band is also observed in the range of 1300–1600 cm−1. The absorption band at around 1634 cm−1 is attributed to the bending vibration of absorbed molecular water, which was observed in all the specimens. The V2O5–CeO2 (VC) sample shows typical bands at 1555, 1459, and 1353 cm−1 and a minor band at 1057 cm−1 for mostly V–O–V on the ceria surface. These spectra were recorded in situ with the MCT, and therefore only reached 1000 cm−1. In contrast, the WO3–CeO2 (WC) sample only shows bands at 1630 and 1353 cm−1, which are quite broad compared to that of the VC catalysts. Similarly, VWC has the bands of ceria, V2O5 and WO3 at 1511, 1341, shoulder at 1630 and sharp band at 1057 cm−1.3.6. Catalytic activity
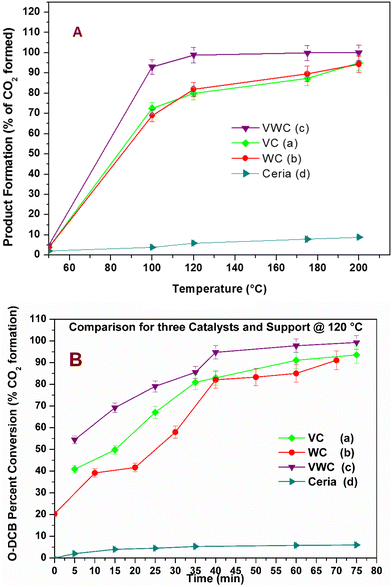
The catalytic activity of the different catalysts was measured under static conditions in the in situ FT-IR cell, where the only product obtained was CO2. The rate of the reaction or percent conversion of o-DCB was calculated using eqn (1). Fig. 4 shows the percentage conversion of o-DCB with the different catalysts, where it is obvious that at 120 °C, the catalytic activity follows the order of WC < VC ≪ VWC. Table 2 shows the conversion (%) at different temperatures (Fig. S4, ESI†) and the turn over frequencies (TOF) for V and W of V2O5 and WO3 at different temperatures, respectively. The catalysts were utilised at different temperatures and recycled for at least three cycles. The different rates for these catalytic activities were studied based on the different intermediates that were formed on the surface of the catalysts and the effective change in their surface oxidation states, leading to the formation of different intermediates. | (1) |
 | (2) |
| Stoichiometric volume of CO2 produced = 6 × volume of o-DCB in the static reactor |
| Volume of o-DCB present = volume of o-DCB taken × 600 ppm × 3 = 50 × 600 × 10−6 cc × 3 = 9 × 10⁻² cc |
| Therefore, the total amount of CO2 produced by the complete oxidation of o-DCB = 0.09 × 6 = 0.54 cc = ACO2. |
| Temp. [T] | VC conversion (%) | TOF (V) min−1 | WC conversion (%) | TOF (W) min−1 | VWC conversion (%) | TOF (V) min−1 | TOF (W) min−1 |
|---|---|---|---|---|---|---|---|
| 100 °C | 90 | 18.36 | 91 | 6.36 | 98 | 16.08 | 11.88 |
| 120 °C | 94 | 18.99 | 91 | 6.38 | 99 | 16.35 | 12.08 |
| 175 °C | 95 | 19.25 | 95 | 6.64 | 99 | 16.36 | 12.09 |
| 200 °C | 98 | 19.84 | 98 | 6.83 | 100 | 16.40 | 12.11 |
The conversion (%) as a function of temperature is an indicator of the behavior of a thermal catalyst at that particular temperature. Therefore, it is quite obvious that the VC catalyst degraded 98% o-DCB at ∼200 °C. Similarly, the comparison with the WC catalyst showed almost the same value at ∼200 °C; however, the VWC catalyst showed a value of 99.3% (almost 100% conversion) at only 120 °C, as shown in Fig. 4(A). This quite clearly shows that VWC is the best catalyst, which almost completely mineralized o-DCB at 120 °C, and after its activity was almost saturated. Fig. 4(B) shows a comparison of the kinetics of all the catalysts and the support at 120 °C. Here, it is also evident that at around 45 min, the VWC catalyst mineralized o-DCB (which can be taken a representative molecule for dioxins and furans) completely. However, at lower temperatures, it is evident that the catalytic activity followed the order of VWC ≫ VC > WC. The TOF or the turnover frequency was calculated as follows:
 | (3) |
Amount of metal = amount of vanadium (V)/tungsten (W) present on the surface of the catalyst, as deduced from the elemental concentration from the XPS survey spectrum.
Therefore, on checking, the TOF factor for vanadium (V) is greater than that of tungsten (W), as can be observed in Table 2. The trend of the above-mentioned thermal catalytic activity needs to be understood for mechanistic variations to explain the observed differences in the degradation of o-DCB over the three catalysts. To understand the formation of intermediates on V2O5 and WO3 for the VWC catalyst, it is necessary to initially understand the different intermediates on the VC and WC catalysts individually. This is a reaction of two different reactants (o-DCB and O2) adsorbed on the catalytic surface. To initiate the oxidation reaction, it was determined whether atmospheric-adsorbed O2 is necessary from the effect of the lattice oxygen of the catalyst (either for V2O5/WO3 or from the CeO2 support). The reaction of o-DCB and air with the only CeO2 support formed a very small amount of CO2 with acetate as an intermediate (Fig. S5, ESI†). Also, to understand the effect of lattice oxygen or the fundamental sites that initiate the oxidative reaction, it was crucial to understand the formation of these intermediates in the absence of an oxidative atmosphere. Accordingly, in situ FT-IR was utilized as a tool for understanding the different intermediates formed on the surface of the VC, WC and the VWC catalysts in the presence of air and in an inert atmosphere (flowing of He).
A comparison with different catalysts reported in the literature for the degradation/mineralization of dioxins and furans (o-DCB as the main model) is presented in Table 3.
| Type of catalyst | Best catalyst | Temperature for complete conversion (°C) | Intermediates | Ref. |
|---|---|---|---|---|
| Transition metal oxides/TiO2 (support) | Cr2O3 | 550 | Carboxylates, phenolates, maleates | 39 |
| V2O5 | 650 | |||
| transition metal oxides/porous C | CrO3 | 250 | Non chloro complexes | 40 |
| MnOx/TiO2–Al2O3 | 250 | Not known | 41 | |
| V2O5–W2O3/TiO2 (VWT-catalyst) | 175–200 | Non chloro complexes | 42 | |
| Perovskites | YCrO3 | 500–600 | Non chloro complexes | 10 |
| Pt/support | Pt/SiO2 | 350 | Non chloro complexes | 43 |
| Mixed oxide/CeO2 | V2O5–WO3/CeO2 | 120 | Maleates, carboxylates, BDC, MDC | Present study |
It can be observed that the VWT catalyst used on industrial scale also mineralized o-DCB and equivalently dioxins and furans at ∼175 °C, which is considered the best thermal catalyst to be used at the lowest degradation temperature. Compared to the different catalysts described in the Introduction, it is obvious that the VWC catalyst completely mineralized o-DCB in the presence of air at ∼120 °C, which is also lower than that of VWT catalysts. Usually, the temperature of the off gas generated post incineration is around ∼120 °C, and thus the present catalyst will not require any further temperature gradient to completely degrade the dioxins and furans released during the incineration process.
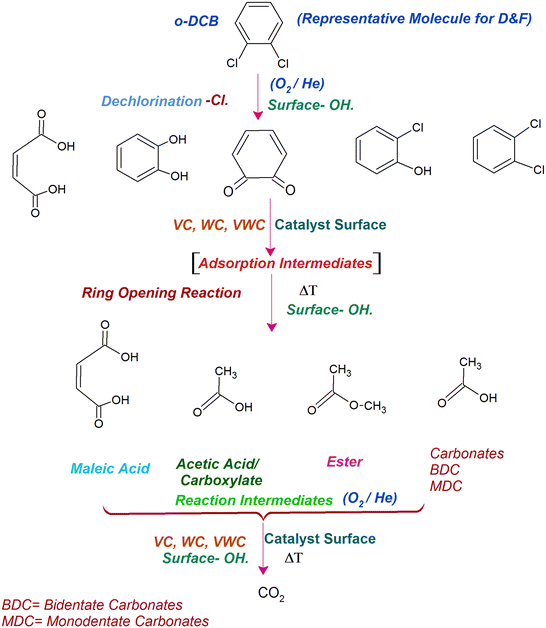
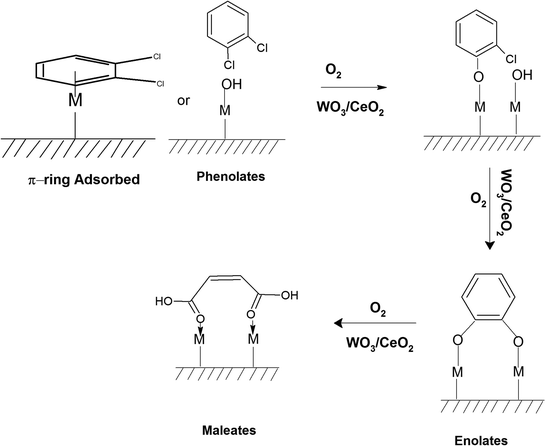
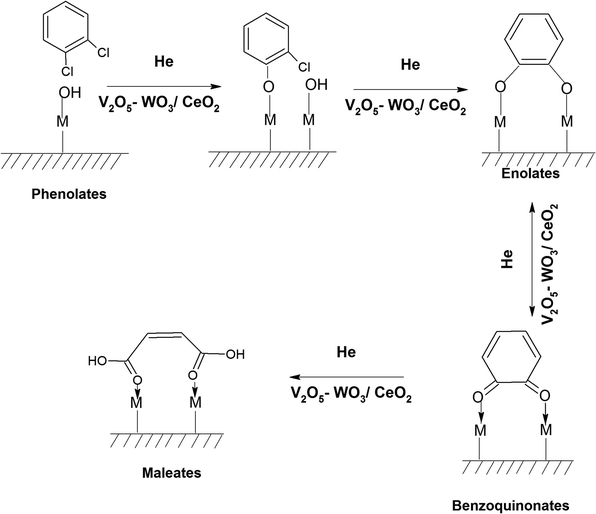
Similarly, in another review, Bañares et al. discussed the degradation of VOCs over a different form of CeO2, which only showed the thermal degradation of toluene by CeO2 at ∼250 °C.25,26 In another review, Hossain et al. presented the catalytic oxidation of volatile organic carbons, where cerium-based catalysts were tested for the catalytic oxidation of a range of chlorinated VOCs.44 Dai et al. investigated the catalytic activity of CeO2 for the oxidation of various chlorinated VOCs45 such as trichloroethylene at ∼205 °C,46 where the CeO2-based catalysts showed high activity, which was attributed to the high mobility of oxygen and basicity and oxygen-supplying ability of CeO2.46 However, cerium-based catalysts are more suitable for the degradation of non-chlorinated VOCs, given that they can be deactivated by the adsorption of HCl or Cl2.47 Therefore, it is imperative to understand the reaction intermediates and the reaction mechanism to understand why the present catalysts mineralized o-DCB at such a low temperature. The different reaction intermediates that were formed on the different catalysts, i.e., VC, WC and VWC, in the presence and absence of O2/air were investigated using in situ FT-IR as a tool. Scheme 1 shows all the intermediates observed in this process on the catalytic surfaces.
3.7. In situ FT-IR studies
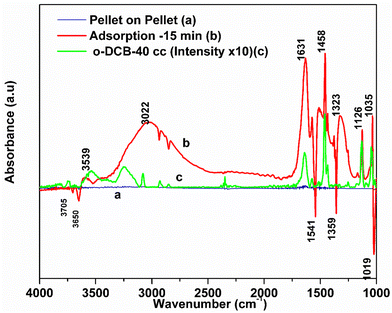
3.7.1.1. Adsorption of o-DCB–air on surface of VC catalyst. Fig. 5 shows the FT-IR bands for the vapour-phase ortho-dichlorobenzene (o-DCB) in the range of 4000–1000 cm−1. o-DCB exhibited prominent bands at 3080, 1587, 1462, 1132, and 1039 cm−1. Also, weak bands were present at 3147, 1478, and 1612 cm−1 together with a weak band at 1259 and a shoulder at 1177 cm−1. The bands at 3147 and 3080 cm−1 are characteristic of the C–H stretching frequencies.48
The bands at 1612, 1582, 1579, 1467 and 1478 cm−1 correspond to the ![[double bond splayed left]](https://www.rsc.org/images/entities/char_e009.gif) C
C![[double bond, length as m-dash]](https://www.rsc.org/images/entities/char_e001.gif) C
C![[double bond splayed right]](https://www.rsc.org/images/entities/char_e00a.gif) and ring stretching components. Generally, the
and ring stretching components. Generally, the ![[double bond splayed left]](https://www.rsc.org/images/entities/char_e009.gif) C
C![[double bond, length as m-dash]](https://www.rsc.org/images/entities/char_e001.gif) C
C![[double bond splayed right]](https://www.rsc.org/images/entities/char_e00a.gif) stretching vibrations in aromatic compounds are observed in the region of 1430–1650 cm−1 and the ring C–C stretching vibrations normally appear in the range of 1590–1430 cm−1.49,50 The peaks at 1132 and 1039 cm−1 can be attributed to the C–H in-plane bending vibrations of the present compound. The doublet at 483 and 434 cm−1 corresponds to the C–C–C in-plane bending for the liquid o-DCB. o-DCB in the vapour state formed at room temperature showed the same typical peaks as that of liquid o-DCB with a lower intensity, showing the major peaks at 3078, 1458, 1132 and 1035 cm−1 with weak peaks at 1478 and 1132 cm−1. The peaks were limited to 1000 cm−1 (vapour-state o-DCB–air mixture) given that the spectra were recorded using an MCT detector.
stretching vibrations in aromatic compounds are observed in the region of 1430–1650 cm−1 and the ring C–C stretching vibrations normally appear in the range of 1590–1430 cm−1.49,50 The peaks at 1132 and 1039 cm−1 can be attributed to the C–H in-plane bending vibrations of the present compound. The doublet at 483 and 434 cm−1 corresponds to the C–C–C in-plane bending for the liquid o-DCB. o-DCB in the vapour state formed at room temperature showed the same typical peaks as that of liquid o-DCB with a lower intensity, showing the major peaks at 3078, 1458, 1132 and 1035 cm−1 with weak peaks at 1478 and 1132 cm−1. The peaks were limited to 1000 cm−1 (vapour-state o-DCB–air mixture) given that the spectra were recorded using an MCT detector.
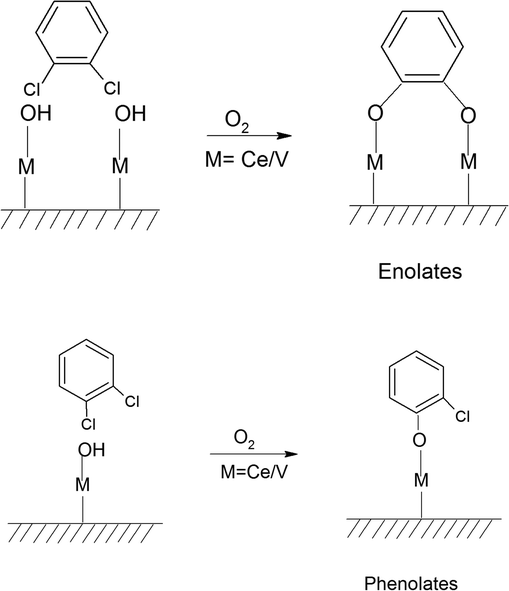
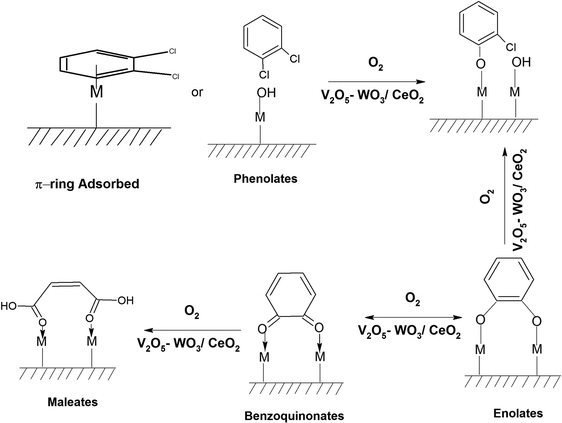
The adsorption of o-DCB in air on the surface of VC is depicted in the Fig. 5(b), where new negative bands appeared at 3650 and 3705 cm−1. In addition, new bands emerged at 3022, 1631, 1458, 1323, 1126, 1035, and 1019 cm−1. The band at 1612 cm−1 shifted to 1631 cm−1, which signifies the formation of surface enolates on the surface of VC by nucleophilic substitution, in which both Cl atoms of o-DCB were abstracted by the surface –OH group to form enolates on the surface of V2O5/CeO2 (VC).51 The other bands at 1541 and 1468 cm−1 correspond to the ![[double bond splayed left]](https://www.rsc.org/images/entities/char_e009.gif) C
C![[double bond, length as m-dash]](https://www.rsc.org/images/entities/char_e001.gif) C
C![[double bond splayed right]](https://www.rsc.org/images/entities/char_e00a.gif) stretch of the phenolates, which are mainly formed by the abstraction of a single Cl atom from o-DCB by the surface –OH groups of V2O5 in the presence of the O− anion.52,53 The peak at 1121 cm−1 also shows the in-plane bending of the phenolates, as observed previously in the literature.54 Negative bands were observed at 3660 cm−1 and at 3705 cm−1. The negative IR-bands can be understood from the IR spectra of the pellet of the V2O5–CeO2 (VC) catalyst, as described in Fig. S1 (ESI†).
stretch of the phenolates, which are mainly formed by the abstraction of a single Cl atom from o-DCB by the surface –OH groups of V2O5 in the presence of the O− anion.52,53 The peak at 1121 cm−1 also shows the in-plane bending of the phenolates, as observed previously in the literature.54 Negative bands were observed at 3660 cm−1 and at 3705 cm−1. The negative IR-bands can be understood from the IR spectra of the pellet of the V2O5–CeO2 (VC) catalyst, as described in Fig. S1 (ESI†).
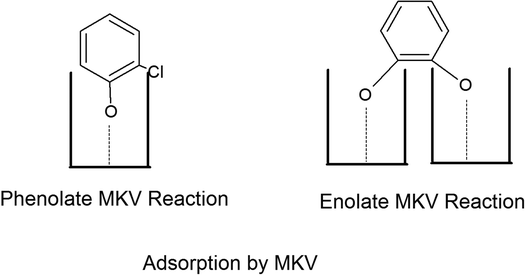
The peak at 3660 cm−1 corresponds to the –OH group on the surface of V2O5 and that at 3705 cm−1 is attributed to the –OH group of the CeO2 catalyst. These negative bands show the utilization of the –OH molecules attached to the surface of the VC catalyst, i.e., mostly the –OH moieties bound to V of V2O5 of the VC catalyst.55 The peak for the CeO2 –OH group is inferred to be at 3705 cm−1, as observed previously by the Zou group 56. Therefore, it can be stated that both the –OH group of the support and that of the V2O5 catalyst dispersed on CeO2 were utilised in the process of o-DCB adsorption. The broad peak at 3022 cm−1 resulting from the adsorption of o-DCB on the surface of VC can be attributed to the -surface –OH groups present on the phenolate entities,56 as shown in Scheme 2.
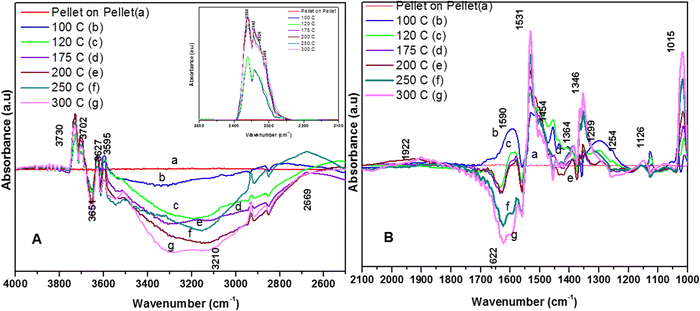
3.7.1.2. Reaction of o-DCB–air mixture on surface of VC as a function of temperature. After the adsorption of o-DCB as enolates and phenolates on the surface of VC, the effective reaction as a function of temperature in the range of 100 °C to 300 °C was studied to understand the different intermediates formed as a function of temperature and the final products formed upon the oxidation of o-DCB with air on the VC catalyst. The different vibrational bands that appeared as a function of temperature are presented in Fig. 6 and discussed as follows. The different bands the appeared at 100 °C (Fig. 6(Aa)) are located at 3595 cm−1 together with a negative band at ∼3400 cm−1 and two peaks at 2360 and 2341 cm−1, as shown in the inset of Fig. 6(A). In Fig. 6(Ba), vibrational bands can be observed at 1590, 1531, 1454, 1434, 1299, 1126 and 1015 cm−1. The band at 3595 cm−1 represents the asymmetric stretching of gaseous CO2 and the bands located at 2360 and 2341 cm−1 represent the asymmetric bending for gaseous CO2 at 100 °C. These observations clearly show the formation of CO2 upon the oxidation of the o-DCB–air mixture on the VC catalyst. The band at 1590 cm−1 (Fig. 6(Ba)) corresponds to the symmetric stretch of the surface carboxylates (νCOO−-sym), as observed previously in the literature for the adsorption/reaction of o-DCB on Pd–Co sulphated ZrO2 catalysts.3 The bands at 1531 and 1434 cm−1 are assigned to surface maleate species, as has been previously reported,57 where the latter is assigned to the asymmetric C–O stretch of maleates, as shown in Table 4. These bands together with the above-mentioned bands representing carboxylates establish the oxidation of o-DCB together with the bond breaking of the activated aromatic ring under these conditions.5 The band at 1431 cm−1 is assigned to the carboxylate species of the acetate type,58 which was observed for the adsorption of trichloroethylene on a Cr–Y sample. Also, the bands for the asymmetric and symmetric stretching vibrations of COO− of surface acetates were assigned. The vibrational bands at 1290, 1251 and 1126 cm−1 are assigned to the unreacted phenolates present on the VC catalyst at 100 °C, where the band at 1290 cm−1 represents the stretching vibration of a chloro ethylene species58 and the bands at 1252 and 1126 cm−1 are attributed to the in-plane bending of the C–H bond of phenolates.52,53,59 Generally, the band at 1015 cm−1 is assigned to the chlorinated acetates, as observed by the Bandera group.53
| Intermediates on catalytic surface | Assignment | Wavenumber (cm−1) | Concerned catalytic surface | Ref. |
|---|---|---|---|---|
| Phenolate | C![[double bond, length as m-dash]](https://www.rsc.org/images/entities/char_e001.gif) C (stretch) C (stretch) |
1541, 1468, 1252, 1158, 1121 | (VC, VWC)-RAir/He | 25,39,42–44,49,50,52 |
| 1259, 1163 and 1330, 1290, 1126 | ||||
| C–H (in plane bending) | 3022, 1453, 1433 | (VC, WC, VWC)-AdAir/He | ||
| C–O (stretch) | 1295, 1255 | |||
| Enolates/catecholate | ![[double bond splayed left]](https://www.rsc.org/images/entities/char_e009.gif) C C![[double bond, length as m-dash]](https://www.rsc.org/images/entities/char_e001.gif) C C![[double bond splayed right]](https://www.rsc.org/images/entities/char_e00a.gif) |
2931, 2897, 2858 (triplet) | (VC, WC, VWC)-RAir/He | 5,39–42,48,52,53 |
| C–H-stretch | 1646, 1630, 1623, 1612, 1573, 1457, 1432, 1295, 1255, 1234, 1119 | (VC, WC, VWC)-AdAir/He | ||
| Benzoquinonate | ![[double bond splayed left]](https://www.rsc.org/images/entities/char_e009.gif) C C![[double bond, length as m-dash]](https://www.rsc.org/images/entities/char_e001.gif) O quinonic O quinonic |
1319 | VWC-Adair/He | 60–62 |
Aldehyde (![[double bond splayed left]](https://www.rsc.org/images/entities/char_e009.gif) C C![[double bond, length as m-dash]](https://www.rsc.org/images/entities/char_e001.gif) O) O) |
1323 | |||
| π-Ring complex | π-cloud of the benzene ring parallel to the surface | 1589, 1455, 1614, 1640 | WC-AdHe | 42,60 |
| Maleate | ![[double bond splayed left]](https://www.rsc.org/images/entities/char_e009.gif) C C![[double bond, length as m-dash]](https://www.rsc.org/images/entities/char_e001.gif) O bend O bend |
1630, 1522, 1531, 1508, 1454, 1434 | (WC, VWC)-RAir/He | 48,52,53 |
| 1411 | (WC, VWC)-AdAir/He | |||
| Carboxylate/acetate | ![[double bond splayed left]](https://www.rsc.org/images/entities/char_e009.gif) C C![[double bond, length as m-dash]](https://www.rsc.org/images/entities/char_e001.gif) O bend carboxylate O bend carboxylate |
1590, 1557, 1534, 1522, 1037 | (VC, WC, VWC)-RAir/He | 7,40–42,48,49,51,52,54–57 |
| νCOO− sym | 1557, 1464, 1431, 1378 | (VC, WC, VWC)-AdAir/He | ||
| νCOO− asym | 1350, 1295, 1279, 1254 | |||
| Carbonate (bidentate/monodentate) | C–O bend | 1710, 1620, 1591, 1400, 1371, 1356, 1288, 1248, 1227 | (VC, WC, VWC)-RAir/He | 44,48,57–59 |
| (VC, WC, VWC)-AdAir/He | ||||
| o-DCB ads (at Lewis site) | 1387, 1053,1034 | 5,44 |
As the temperature increased to 120 °C, some more bands were observed in the higher wavenumber region. However, the intensity of certain bands increased, whereas for several other bands, their intensity decreased substantially. New bands were observed at 3730 and 3702 cm−1 (assigned to C–O antisymmetric stretch of gas-phase CO2), together with an increment in the intensity of the peaks at 2360 and 2341 cm−1 (assigned for CO2 bend). These results substantiate the further formation of CO2 at 120 °C compared to that of 100 °C. The peaks at 1590 cm−1 (assigned to surface carbonates) shifted to 1585 cm−1 and their intensity decreased, showing the participation of these intermediates in the formation of the product. The vibrational peaks at 1536 and 1454 cm−1 (representing surface maleates) showed an increase in intensity, while peaks at 1299 and 1254 cm−1 (indicating the formation of maleate intermediates) mostly from phenolate species were observed, as presented in Table 4. The intensity of the peaks corresponding to surface carboxylates was substantially reduced, whereas the intensity of the peak at 1126 cm−1 (surface phenolates) also decreased. The intensity of the band at 1012 cm−1 (chloro acetates) increased with an increase in temperature. With a further increase in temperature from 120 °C to 175 °C and 200 °C, several new peaks appeared. At 175 °C and 200 °C, a new peak appeared at 1350 cm−1 and the intensity of the negative peak at 1688 cm−1 increased. However, the bands at 1581, 1464, 1451, 1126, and 1254 cm−1 almost disappeared. The vibrational bands at 1533 and 1015 cm−1 together with that in the stretching region of 3730, 3702, 3627, and 3695 cm−1 increased in intensity and the peak at 1291 cm−1 shifted to 1288 cm−1. The peak at 1350 cm−1 (assigned to acetate -CH3 stretching) corresponds to m-DCB adsorbed on the V2O5–TiO2 catalyst.61,63 Therefore, at around 175 °C and 200 °C, the further formation of the gas-phase product of CO2 occurred, as is evident from the increase in the intensity of the peaks at 3730, 3702, 3627, and 3695 cm−1 together with the bending peaks of CO2 at 2380, 2342, and 2303 cm−1. The intermediate species of surface maleates were further formed, as shown by the increase in the intensity of the band at 1533 cm−1. The lower intensity of the bands corresponding to the intermediates such as surface carboxylates (1581, 1431, and 1464 cm−1) indicates that the formation of new products and surface phenolates (1126 and 1264 cm−1) was exhausted completely. The negative band at 1688 cm−1 shows the usage of the enolates, which were mostly converted from phenolates. Once the high temperature of 250 °C and 300 °C was reached, the different vibrational bands corresponding to the surface maleates (1531 cm−1) had the maximum intensity, which was also observed for the surface acetates (1346 cm−1).
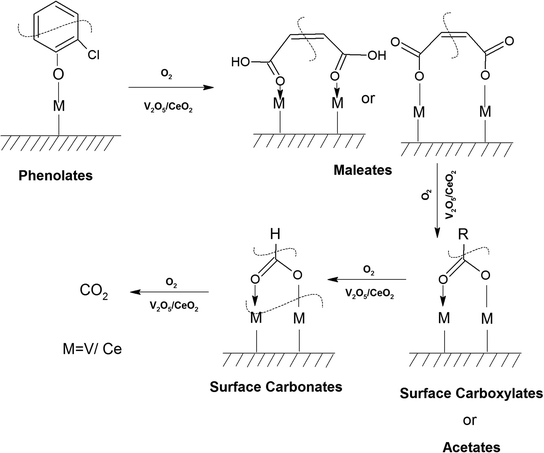
The intensity of bands for gaseous CO2 (2380, 2342, 2304, 3730, 3702, 3627, and 3695 cm−1) also increased almost to the limit of saturation, as can be seen in Table 4. The strong negative band for the surface enolates (1622 cm−1) corresponding to other intermediates also increased in intensity, as shown in Scheme 3.
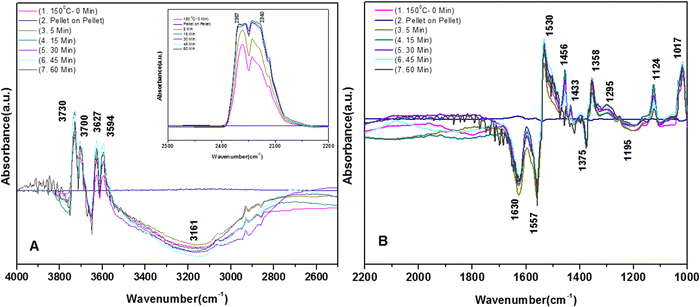
3.7.1.3. Kinetics of o-DCB–air mixture on the surface of VC at 120 °C. The reaction at 120 °C was performed post-adsorption as a function of time for one hour on the VC catalyst for the degradation of an o-DCB and air mixture. The different vibrational bands obtained at different intervals are shown in Fig. 7. At 0 min, the different peaks observed in the stretching region, as shown in Fig. 7(A1), are located at 3730, 3700, 3627, and 3594 cm−1, indicating the formation of CO2, as described in Table 4. Also, a negative band emerged at 3161 cm−1, showing the utilisation of the surface –OH groups present in the VC catalyst.
The inset of Fig. 7(A) shows the bending band of CO2, which made it possible to monitor the formation of gaseous CO2 as a function of time given that it is the final oxidation product formed from the oxidation of o-DCB on the surface of VC. The different vibrational bands mainly at 1530, 1456, 1443, 1358, 1295, 1124, and 1017 cm−1 are shown in Fig. 7(B). The intensity of these bands varied as a function of time at a given temperature. The vibrational bands at 3730, 3700, 3627, and 3594 cm−1 (symmetric stretch – CO2) and 2360 and 2341 cm−1 (representing bending mode of CO2) showed the formation of CO2 as a function of time. The broad negative peak centred at 3161 cm−1 is attributed to the surface hydroxyl groups present on the surface of V2O5 and CeO2, which were utilised during the reaction process. The other bands in the bending region, as shown in Fig. 7(B), are located at 1530 and 1456 cm−1 (corresponding to maleates)57,64 and 1443 and 1358 cm−1 (corresponding to acetates),58,61,65,66 as shown in Table 4. Alternatively, the peak at 1295 cm−1 is a bit ambiguous. Den et al. attributed it to enolates species for a Ce-doped TiO2 system,51 whereas Greene et al. reported that it corresponded to C–H rocking for the C–Cl bond (chloro ethylene adsorption on zeolites).58 However, the band at 1017 cm−1 represents the CH2 rocking for the chloro ethylenes. Therefore, the bands at 1017 cm−1 and 1295 cm−1 are due to chloro ethylenes and not enolates. Also, as a function of time at 120 °C, the intensity of these particular bands was observed to increase, showing the formation of chloro ethylenes coupled with the degradation of enolates as a function of temperature. Furthermore, the intensity of the peak at 1124 cm−1 (representing ClCH2CHO)54 increased (Fig. 7(B)), showing the formation of these intermediates. Also, strong negative bands appeared at 1630 cm−1 (representing enolate), 1157 and 1195 cm−1 (corresponding to phenolates) and 1374 cm−1 (assigned to vibrations of o-DCB adsorbed on Lewis acid sites of ZrO2),5 showing the utilisation of these intermediates in the oxidative reaction at 120 °C. Thus, the kinetics at 120 °C, a representative temperature for the oxidation of o-DCB on the VC sample, is shown in Scheme 3.
3.7.1.4. Reaction of o-DCB–He mixture on surface of VC as a function of temperature. To understand the effect of the lattice oxygen on the reaction mechanism, the reaction for the degradation of o-DCB on the surface of VC was carried out by replacing air with He.
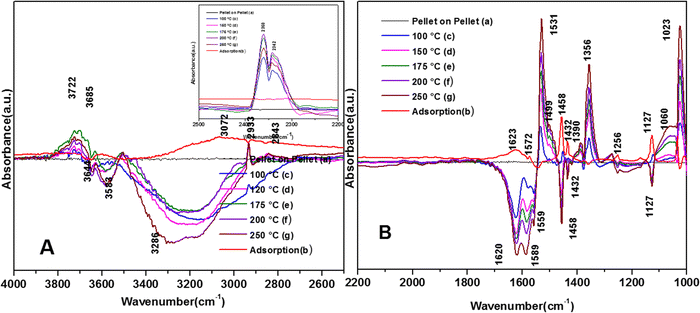
The formation of different intermediates with o-DCB in the absence of oxygen is definite evidence for the participation of labile lattice oxygen in the initiation of the reaction. Fig. 8 shows the reaction of o-DCB and He on the surface of VC. Initially, Fig. 8(b) shows the adsorption of o-DCB and He on the surface of VC.
Subsequently, new peaks appeared at 3072, 1623, 1572, 1458, 1432, 1256 and 1127 cm−1. The peak at 3072 cm−1 corresponds to the formation of surface –OH groups, which are generated due to the adsorption of o-DCB and He on the surface of VC. The peak at 1623 cm−1 is characteristic of the surface enolates,54 while the peaks at 1572, 1458, 1432, 1256 and 1127 cm−1 are ascribed to phenolates,52,53 as shown in Table 4. Therefore, the VC catalyst showed the formation of enolates and phenolates even in the absence of air, where the phenolates are higher in concentration compared to enolates.
The spectra for the reaction for the degradation of o-DCB on the VC catalyst in an He-atmosphere at 100 °C is shown in Fig. 8(Ac) and (Bc). A new band appeared at 3722 cm−1 together with several negative peaks at 3644, 3583, and 3286 cm−1 (representing surface–OH) in the stretching region (Fig. 8(Ac)), indicating the usage of the surface –OH groups on V2O5 in conjunction with that of the CeO2 support. The peaks at 3722, 3622, and 3512 cm−1 represent gaseous CO2. The bending region shows negative peaks at 1620, 1574 and 1554 cm−1, corresponding to enolates, phenolates and acetates, respectively.65 New vibrational bands were observed at 1534, 1452, and 1357 cm−1 together with a strong peak at 1024 cm−1 and a shoulder at 1064 cm−1. Here, the vibrational bands at 1534 and 1452 cm−1 represent carboxylates (latter νCOO− sym)5 and the band at 1357 cm−1 is assigned to carbonates,54 showing the formation of these intermediates. However, the intensity of the peak observed at 1123 cm−1 upon adsorption, which is assigned to phenolates, decreased considerably. The shoulder at 1064 cm−1 and a strong peak at 1024 cm−1 represent the chloro ethylenes, which are mainly formed by ring opening. Fig. 8(A) (inset) shows vibrational bands at 2380, 2342, and 2303 cm−1 at 100 °C, representing the gas-phase formation of CO2 [in non-oxidative atmosphere, i.e., He-atmosphere (NOA)]. This degradation of o-DCB to CO2 in NOA unequivocally shows the effect of the lattice oxygen, which is mostly from the support given that a similar trend was not observed for other mixed oxide catalysts previously (V2O5–TiO2, WO3-TiO2, etc.).
The vibrational bands for the above-mentioned reaction at 120 °C are portrayed in Fig. 8(Ad) and (Bd). The major peaks in Fig. (8Ad) are located at 3722 and 3685 cm−1, with a negative band at 3685 cm−1. In Fig. 8(Bd), there are a few new negative peaks at 1455, 1436 and 1127 cm−1 together with the earlier negative peaks at 1620, 1589, and 1559 cm−1. The intensity of the vibrational bands at 1531, 1356, 1387, 1256, 1060 and 1023 cm−1 was higher compared to that at 100 °C. Also, the new negative peak 1455 cm−1 (representing carboxylates) almost disappeared, indicating the formation of carbonates and CO2.
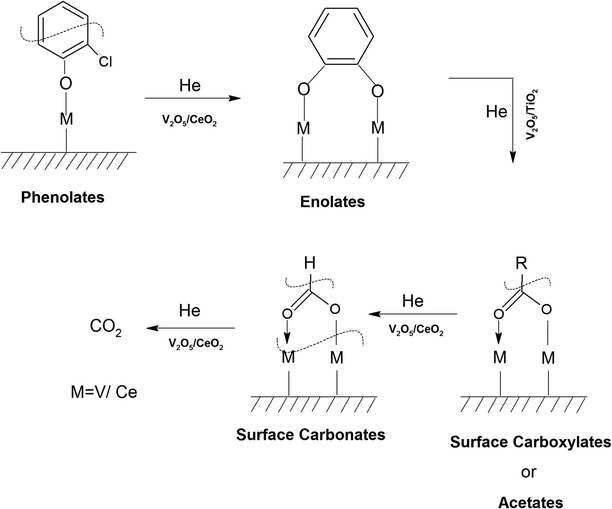
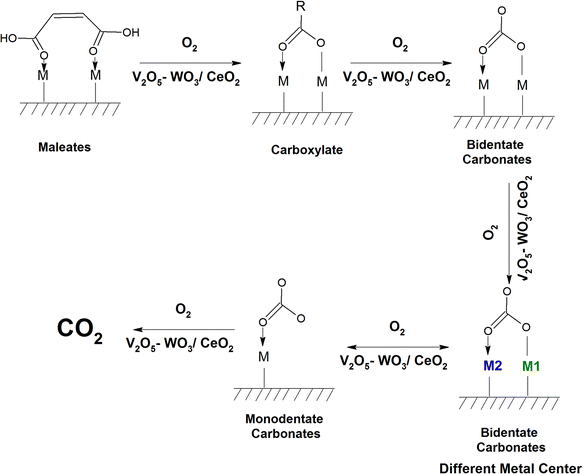
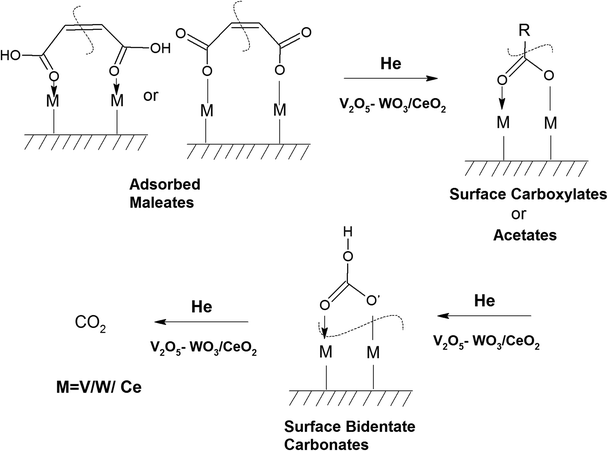
The negative band at 1436 cm−1 appeared for the first time. The bands at 1437, 1559, and 1455 cm−1 correspond to the phenolates. Similarly, the negative band at 1127 cm−1 (representing the phenolates) also became more negative, showing the utilisation of these intermediates. The position of the other bands was the same as that at 100 °C and only their intensity increased. Heating at different temperatures also generated similar bands as described earlier at different intensity levels. Therefore, in the presence of He, no formation of surface intermediates such as maleates occurred and the adsorbed phenolate/enolate formed CO2via intermediates such as acetates/carboxylate and carbonate, as shown in Scheme 4.
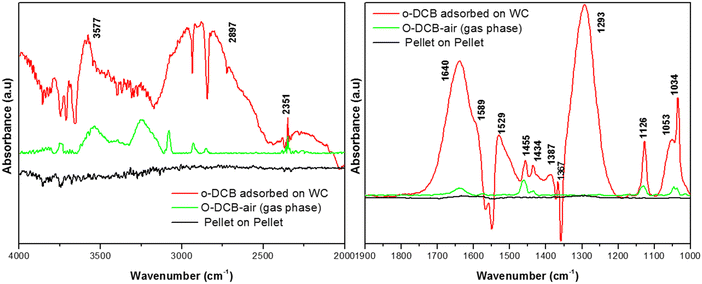
3.7.2.1. Adsorption of o-DCB and air on surface of WC. Upon the adsorption of o-DCB on the surface of WC, several new peaks appeared, as shown in Fig. 9, at 1640, 1589, 1529, 1445, 1434, 1387, 1367, 1293, 1126, 1053 and 1034 cm−1. New bands were also found in the stretching region at 3577 and 2897 cm−1. The band at 1640 cm−1 is attributed to surface enolates51 and the shoulder at 1589 cm−1 is assigned to the formation of a π-complex, as reported in the literature by the Deng group.51 The vibrational bands at 1445, 1126, and 1293 cm−1 are attributed to phenolates,63 the band at 1387 cm−1 is assigned to o-DCB adsorbed on the Lewis acid sites5 and the peaks at 1053 and 1034 cm−1 are assigned to chloro phenols,54 as tabulated in Table 4.
The lower intensity peaks at 1529 and 1434 cm−1 show mostly carboxylate-type species, indicating their reactive adsorption on the surface of WC. The peak at 2987 cm−1 probably shows the formation of surface oxygen in the form of O2− ions (surface basic lattice oxygen O2− clusters may be responsible for acid–base-type interactions and yielded from the cleavage of the adsorbed o-DCB ring as π-ring on the ceria surface).42 These surface basic O2− clusters mainly produce carboxylate-like species (maleates), as shown in Scheme 5.
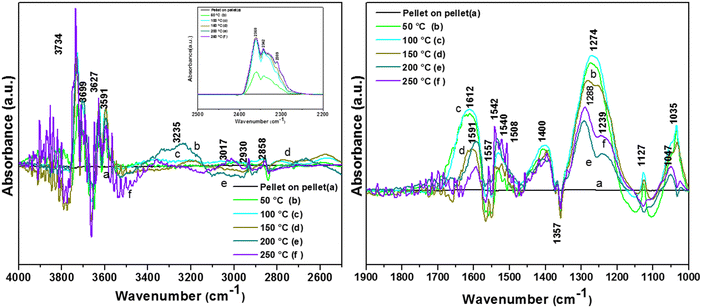
3.7.2.2. Reaction of o-DCB–air mixture on the surface of WC as a function of temperature. Post-adsorption, the different intermediates were identified as a function of temperature on the surface of WC, as displayed in Fig. 10. Bands in the stretching region at 3734, 3699, 3627, 3591, 3235, 3017, 2930 and 2858 cm−1 were observed upon heating at 100 °C (Fig. 10(Aa)). The bands at 3734, 3699, 3627 and 3591 cm−1 represent gas-phase CO2 (formed upon oxidation) and the peak at 3235 cm−1 mainly indicates surface –OH groups (formed during the reaction). The strong triplet bands at 3017, 2927 and 2972 cm−1 are assigned to the enolate
![[double bond splayed left]](https://www.rsc.org/images/entities/char_e009.gif) C
C![[double bond, length as m-dash]](https://www.rsc.org/images/entities/char_e001.gif) C
C![[double bond splayed right]](https://www.rsc.org/images/entities/char_e00a.gif) and C–H stretch. The other vibrational bands observed in the bending region (Fig. 10(Ba)) were located at 1614, 1591, 1557, 1530, 1508, 1400 1274, 1127, and 1035, with a shoulder at 1057 cm−1. The bands at 1614, 1640 and at 1589 cm−1 are assigned to the π aromatic ring parallel to the surface of the catalyst.67 Also, bands were observed at 1557 cm−1 (acetates),58,65,66 1530 cm−1 (carboxylates),54 1508 and 1445 cm−1 (maleates) and 1400 cm−1 (bidentate carbonates).54 The bands at 1279 and 1127 cm−1 (phenolates) appeared at the temperature of 100 °C.
and C–H stretch. The other vibrational bands observed in the bending region (Fig. 10(Ba)) were located at 1614, 1591, 1557, 1530, 1508, 1400 1274, 1127, and 1035, with a shoulder at 1057 cm−1. The bands at 1614, 1640 and at 1589 cm−1 are assigned to the π aromatic ring parallel to the surface of the catalyst.67 Also, bands were observed at 1557 cm−1 (acetates),58,65,66 1530 cm−1 (carboxylates),54 1508 and 1445 cm−1 (maleates) and 1400 cm−1 (bidentate carbonates).54 The bands at 1279 and 1127 cm−1 (phenolates) appeared at the temperature of 100 °C.
However, at a higher temperature, the peak at 1279 cm−1 became a doublet with a different intensity ratio, as discussed later in this section. The intensity of the peaks at 1056 and 1038 cm−1 (chloro phenolates) decreased sharply as a function of temperature,7,68 as shown in Table 4.
At higher temperatures on the WC catalyst, the intensity of the peaks in the stretching region decreased as a function of temperature. The intensity of the pair of doublet peaks at 3734/3699 and 3627/3591 cm−1 (gaseous CO2) increased in with an increase in temperature [Fig. 10A(d) and (e)]. Alternatively, the intensity of the peak at 3235 cm−1 (surface–OH groups) decreased as a function of temperature, showing their usage. However, the effect of temperature on the bands in the range of 2100–1000 cm−1, as shown in Fig. 10(B), was more significant. A peak at 1620 cm−1 and new peak at 1591 cm−1 were observed at the temperatures of 200 °C and 250 °C (mainly bidentate carbonates).62,69,70 Also, the formation of a doublet was observed from the bands at 1530, 1542 and 1540 cm−1, which are mainly assigned to adsorbed bicarbonates, as seen on the surface of rutile TiO2.71
The intensity of the band at 1400 cm−1 decreased as a function of temperature and the band located at 1274 cm−1 again gave rise to two peaks at 1288 and 1239 cm−1 at higher temperature (200–250 °C). The peak at 1288 cm−1 is assigned to bidentate carbonates and the peak at 1239 cm−1 is assigned to bicarbonates, as observed in the literature.62,69 There was a shift and strong decrease in the intensity of the band at 1127 cm−1 (phenolates), showing the use of the phenolate moieties on the surface of the WC catalyst at higher temperatures. The intensity of the peak at 1037 cm−1 (chloro-acetate) significantly decreased and a new peak appeared at 1047 cm−1, which is attributed to the surface-bound bicarbonate species.69 Therefore, the oxidation of the adsorbed intermediates on the surface of WC leads to the formation of acetates, carboxylates, bicarbonates, bidentate carbonates, and ultimately CO2, as depicted in Scheme 6.
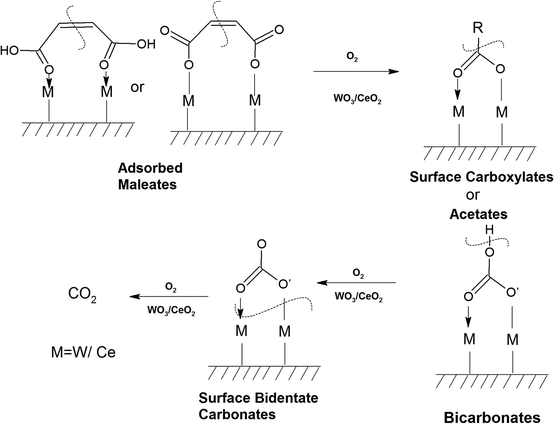 | ||
| Scheme 6 Formation of different intermediates on the surface of WC upon the reaction of o-DCB as a function of temperature. | ||
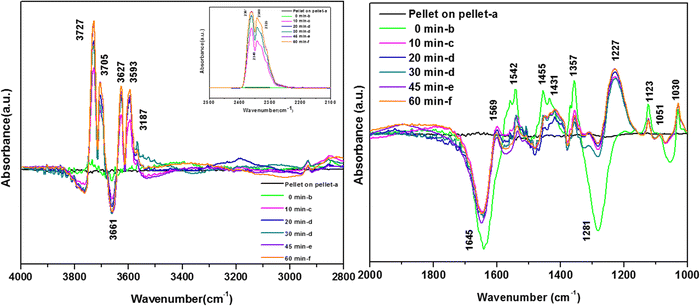
3.7.2.3. Kinetics of o-DCB–air mixture on surface of WC at 120 °C. To understand the different intermediates as a function of time on the WC-catalytic surface, an o-DCB and air mixture was treated at 120 °C as a function of time, as depicted in Fig. 11(A) and (B). Vibrational bands (Fig. 11(A)) appeared and increased in intensity with time at 3730, 3705, 3627 and 3593 cm−1, where the latter two bands represent gas-phase CO2.
In the bending part (Fig. 11(B)), vibrational bands were observed at 1557, 1542, 1455, 1431, 1357, 1371, 1227, 1127, 1051 and 1030 cm−1 together with negative bands at 1659, 1642, and 1248 cm−1. The negative band at 1659 cm−1 is assigned to benzoquinonates, while the band at 1642 cm−1 (enolates) shows the utilization of these intermediates on the surface of WC as a function of time at 120 °C. However, the negative band at 1248 cm−1 (bicarbonates) shows the use of bicarbonates, where mostly bidentate carbonates are formed from these bicarbonates. The bands at 1557 and 1437 cm−1 (surface acetates)72 and 1455 cm−1 (surface maleates) appeared post-adsorption and decreased in intensity with time. The bands at 1357, 1371, and 1227 cm−1 represent carbonates and bidentate carbonates, while the bands at 1051 and 1030 cm−1 represent Cl−-sensitive acetates.
The intensity of the gas-phase CO2 bands increased as a function of time and became saturated after 60 min (inset Fig. 11(A)). This clearly shows the formation of CO2, even in the reaction as a function of time at 150 °C. The intermediates formed in this kinetic experiment are similar with that observed as a function of temperature, and thus follow the same trend shown in Scheme 6.
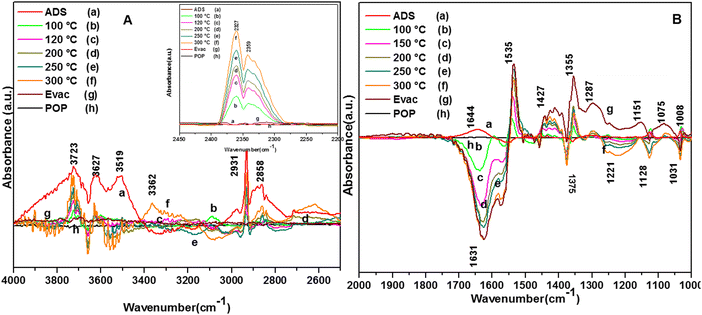
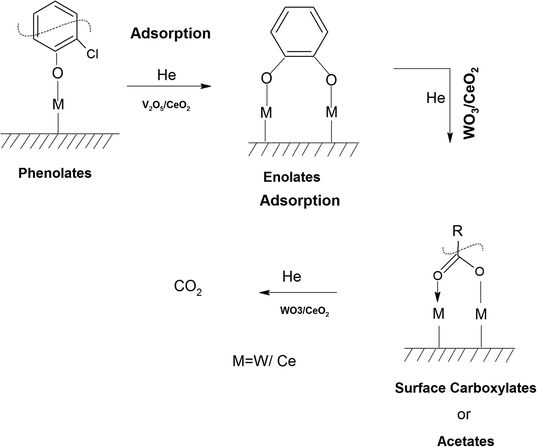
3.7.2.4. Reaction of o-DCB–He mixture on the surface of WC as a function of temperature. Similar to the surface of VC, the surface of WC also led to the complete mineralization of o-DCB upon thermal degradation in the absence of O2 (presence of He + o-DCB mixture) [Fig. 12(A) and (B)]. The adsorption of the o-DCB and He mixture is represented in Fig. 12(Aa) and (Ba). Typically, upon adsorption, peaks appeared at 3723, 3627, and 3519 cm−1 together with a triplet at 2931, 2897 and 2858 cm−1. The vibrational bands obtained in the bending region were observed at 1646, 1453, 1433, 1382, 1295, 1255, 1176, 1123, and 1035 cm−1, as shown in Fig. 12(Ba). The initial peaks at 3723, 3627 and 3519 cm−1 correspond to surface –OH and the triplet at 2931, 2897 and 2858 cm−1 represents surface-adsorbed enolates; however, peculiarly these peaks were missing for the adsorption of an o-DCB and air mixture on the surface of WC.
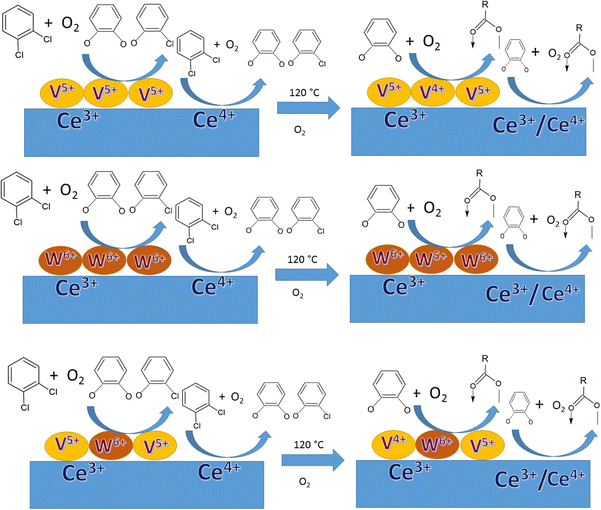
In the presence of O2, several active surface hydroxyl groups are formed, which mainly eliminate two H and Cl from the surface and o-DCB, respectively, to form catecholate/enolate as adsorbed species on the surface. However, as the ring opening reaction occurs in the absence of O2, it paves the way for the Mars–Van Krevelen-type mechanism (MVK), where mostly the labile surface defects contribute to the diffusion of lattice oxygen (shown in Scheme 12), effectively enabling the formation of the enolate. However, this enolate may be formed at two different O-vacancy sites (CeO2 and WO3) simultaneously compared to only the WO3 surface observed in the literature, and consequently there was a shift of 30 cm−1 in the enolate triplet-band. The peak at 1646 cm−1 represents enolates51 and the peaks at 1453, 1433, 1295 and 1255 cm−1 represent phenolates. The strong band at 1385 cm−1 is assigned to the adsorbed o-DCB5, the doublets at 1330 and 1291 and 1170 and 1133 cm−1 are assigned to the phenolate C–O stretch and C–H bending, respectively61,63 and the small shoulder at 1046 cm−1 is assigned to the Cl-sensitive phenolates.63 Therefore, o-DCB is adsorbed as phenolates and enolates in the presence of He on the surface of WC. The reaction of the adsorbed o-DCB in an He atmosphere at 100 °C is shown in Fig. 12(A) and (Bb). The vibrational peaks appeared at 3723, 3627, and 3519 cm−1 together that a triplet at 2931, 2897 and 2858 cm−1. The other peaks were observed at 1539, 1452, 1433, 1356, 1255, 1123, and 1032 cm−1 with negative peaks at 1634, 1565 and 1375 cm−1. The vibrational bands at 1539 and 1433 cm−1 represent surface carboxylates, at 1452 cm−1 represent surface maleates,57 1356 and 1032 cm−1 represent surface acetates and at 1255 and 1123 cm−1 show unreacted phenolates. These unreacted phenolates are utilised at higher temperatures. The negative bands at 1634 cm−1 (enolates), 1375 cm−1 (adsorbed o-DCB) and 1565 cm−1 (phenolates) show that these intermediates were used to form other surface intermediates such as maleates and acetates. The reaction carried out at 120 °C led to different peaks at 3723, 3627, and 3519 cm−1 together with a triplet at 2931, 2897 and 2858 cm−1, as shown in Fig. 12(Ac) and (Bc).
Other peaks were observed at 1539, 1452, 1433, 1356, 1255, 1123, and 1032 cm−1 together with negative peaks at 1634, 1565, and 1375 and a broad peak at 1211 cm−1. All these peaks were previously present at 100 °C and only their intensities varied. The intensity of the vibrational bands in the stretching region at 3723, 3627, and 3519 cm−1 together with the triplet at 2931, 2897 and 2858 cm−1 decreased and the intensity of the negative band at 1535 cm−1 increased. The broad negative band at 1211 cm−1 represents the phenolates, which must be utilised in the process. Upon reaching 200 °C, besides the peaks obtained at 100 °C and 120 °C, only a new negative peak appeared at 1031 cm−1, corresponding to acetates, which were further utilised to for other intermediates such as carbonates. The same vibrational peaks were observed at 250 °C and 300 °C with a reduction in their intensities. Simultaneously, the inset of Fig. 12(A) shows peaks at 2380, 2342, and 2303 cm−1, which are mainly assigned to the asymmetric bending of CO2, which systematically increased as a function of temperature. Thus, the results show that o-DCB was completely mineralised to CO2 through different intermediates even in the absence of O2. The reaction pathways for the oxidation of o-DCB in an He-atmosphere on the surface of WC is shown in Scheme 7.
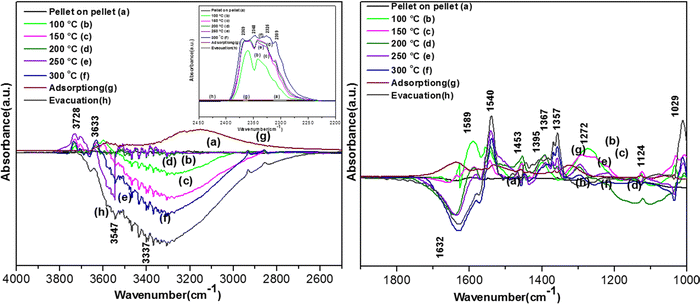
Initially, to understand the adsorption of o-DCB on the surface of VWC in presence of O2, the observed vibrational bands are shown in Fig. 13(Ag) and (Bg). The major band appeared at 3140 cm−1 as a broad band together with other bands at 1640, 1578, 1534, 1458, 1439, 1363, 1323, 1125, 1061, and 1037 cm−1. The band at 3140 cm−1 (surface –OH groups) was found to be quite different from either the WC or VC surface. Although the band at 1640 cm−1 (enolates)63 shows the formation of enolates, the most surprising was the absence of the triplet at 2985, 2927 and 2972 cm−1 reported in the literature,65 which is substantially explained in the discussion in the next section. The vibrational band at 1578 cm−1 (π-complex)51 was previously observed on the surface of WC for the adsorption of o-DCB in presence of air. The bands at 1522, 1458 and 1434 cm−1 are assigned to the surface maleate species, as presented in Table 4.57 The band at 1125 cm−1 represents phenolates and the bands at 1061 and 1037 cm−1 represent chloro phenolates.54 However, the peak at 1363 cm−1 represents undissociated o-DCB molecules, as observed on CeO2–TiO2 mixed oxide catalysts.65,71 The peak at 1323 cm−1 is assigned to benzoquinonates.71,73 Surprisingly, two bands were observed at 1534 and 1458 cm−1 (surface maleates),57,64 which were observed by previous groups on the surface of TiO2.
This was also observed for o-DCB–air adsorption on the surface of WC. Therefore, the overall adsorption of o-DCB on the surface of VWC shows the effect of both VC and WC, as presented in Scheme 8.
Typically, at a temperature of 100 °C, different peaks appeared at 3728 and 3631 cm−1 in the stretching region together with the peaks at 2380, 2342, and 2303 cm−1, which are mainly assigned to the asymmetric bending of CO2, and the intensity of these bands increased as a function of temperature. These results indicate that the CO2 product is formed as a function of temperature. The other typical bands were observed at 1630, 1588, 1556, 1516, 1457, 1392, 1357, 1272, 1124, and 1029 cm−1. Also, certain negative bands appeared at 3272 and 1656 cm−1. The peaks at 1630 and 1510 cm−1 are assigned to maleates,57,64 which were formed from the surface phenolates even at a higher temperature. As shown previously in the literature, the peaks at 1452 and 1584 cm−1 are ascribed to carboxylates5 and the peak at 1554 cm−1 shows the formation of acetates,58,65,66 as shown in Table 4. New peaks appeared at 1392 and 1272 cm−1, where previously the peak at 1398 cm−1 was assigned to adsorbed o-DCB. However, at 100 °C, o-DCB cannot form new intermediates, and therefore this peak represents a new intermediate and not adsorbed o-DCB. Bhattacharyya et al. studied the reactive adsorption of CO2 over TiO2 nanotubes and observed the formation of bidentate carbonates at 1378 and 1277 cm−1, which is appropriate in the present study also.69 Therefore, the peaks at 1378 and 1277 cm−1 represent bidentate carbonates. The peaks at 1123, 1034 and 1029 cm−1 represent unreactive phenolates adsorbed on the surface of VWC (Table 4). Therefore, at 100 °C, the surface intermediates observed are maleates (also formed in the adsorption process), carboxylates/acetates, bidentate carbonates and certain adsorbed phenolates. The inset of Fig. 13(A) shows the bands at 2380, 2342, and 2303 cm−1 (asymmetric bending of CO2) and bands at 3728 and 3633 cm−1 (C–O stretch) can be seen in Fig. 13(A), representing the formation of gaseous CO2. Upon increasing the temperature to 120 °C, a new doublet was seen at 1367 and 1358 cm−1. The peak formed at 1588 cm−1 split into a pair of peaks at 1610 and 1583 cm−1, and similarly the peak at 1272 cm−1 was converted to a doublet at 1290 and 1254 cm−1. The other peaks at 1542, 1456, and 1395 cm−1 remained unaltered. The intensity of the negative bands at 3275 and 1630, 1124, and 1028 cm−1 decreased, whereas the increased of the bands at 3734, 3701, 3629, and 3594 cm−1 and 2380, 2342, and 2303 cm−1 representing gaseous CO2 increased. Also, new doublet bands appeared at 1367 and 1358 cm−1 (monodentate carbonates).69 The other two doublets at 1290 and 1254 cm−1 represent bidentate carbonates perhaps with two different metal centres, while the other two doublets at 1610 and 1584 cm−1 represent bidentate carbonates again formed from the band at 1588 cm−1 (representing carboxylates) (Table 4), as shown in Scheme 8. Therefore, at 120 °C, the carboxylates form bidentate carbonates (BDC), and consequently the bidentate carbonates form monodentate carbonates (MDC), clearly indicating the formation of BDC on the two different metal centres. At the higher temperatures of 200 °C, 250 °C and 300 °C, the vibrational bands remained the same with the only difference in the intensity of certain bands, which increased/decreased as a function of temperature. The peaks obtained were same as that at 120 °C with a new negative peak at 1630 cm−1, which increased in negative intensity as a function of temperature, showing the usage of the surface enolate species. The intensity of the peak at 1540 cm−1 increased and the peaks at 1453 and 1395 cm−1 almost disappeared, indicating the usage of these species. The intensity of the peaks at 1357 and 1367 cm−1 increased, while that at 1293 and 1217 cm−1 considerably decreased. The intensity of the negative peaks at 1124 and 1032 cm−1 increased as a function of temperature. The peaks corresponding to gaseous CO2 (3734, 3701, 3629, 3594 and 2380, 2342, and 2303 cm−1) initially increased with temperature up to 250 °C, and then became saturated at 300 °C. Therefore, the thermal mineralization of o-DCB and air on the surface of VWC as a function of temperature is illustrated in Scheme 9.
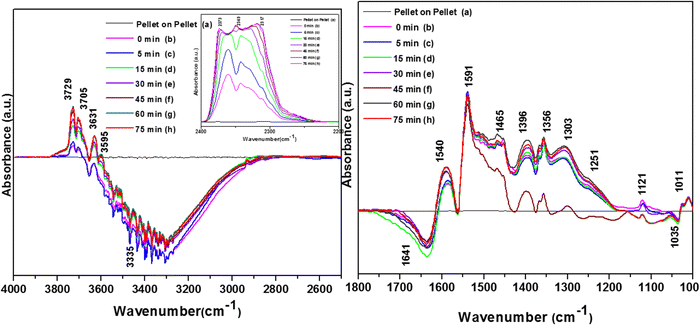
The vibrational peaks were observed at 3734, 3701, 3629, 3594 and 2380, 2342, and 2303 cm−1, representing gaseous CO2 in the stretching region, as shown in Fig. 14(A). and the inset shows a negative peak at 3335 cm−1, the intensity of which increased as a function of time. In the bending region, similar peaks as observed earlier, as shown in Fig. 14(Bc), appeared at 1590, 1540, 1465, 1396, 1356, 1298, 1251, 1211 and 1011 cm−1 with a negative peak at 1640 cm−1. The intensity of these peaks varied as a function of time; however, given that no new peaks emerged, the process follows the same mechanism as given in Scheme 9.
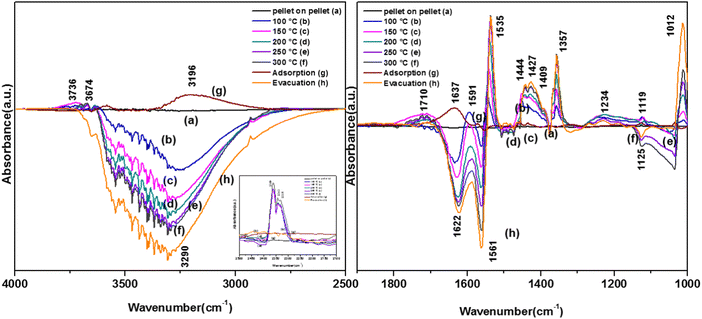
The band at 1377 cm−1 represents the adsorbed o-DCB moiety at the Lewis acid sites and that at 1319 cm−1 represents benzoquinonates. Therefore, upon the adsorption of o-DCB–He, it forms phenolates, enolates and benzoquinonates, which are mostly adsorbed over the two different metal sites of V and W, leading to high torsional energy of the benzoquinonate moiety. This torsional energy leads to the ring opening of the o-benzoquinonate to form maleate upon rearrangement. The vibrational peaks at 100 °C are located at 3734, 3701, 3629, and 3594 cm−1 (Fig. 15(Ab)) and 2380, 2342, and 2303 cm−1 [Fig. 15(Ab) (inset)], representing gaseous CO2 in the stretch region in Fig. 15(Ab) with a negative broad peak at 3736 cm−1. The vibrational bands in the bending region are located at 1591, 1540, 1451, 1431, 1411, 1357, 1250, 1168, 1123, and 1010 cm−1 with a negative band at 1631 cm−1 at 100 °C (Fig. 15(Bb)). The bands present at 1591 cm−1 represents surface carboxylates (νCOO− – sym),5 the bands at 1540 and 1451, and 1411 cm−1 are assigned to surface maleates,57,64 band at 1431 cm−1 is assigned to carboxylate species,58 peak at 1358 cm−1 is assigned to acetates58,74 and the bands at 1250, 1168, 1123, and 1010 cm−1 correspond to unreacted phenolates, as shown in Table 4. The negative band at 1630 cm−1 (enolates) shows the usage of adsorbed enolate species on the surface, as shown in Scheme 10.
At 120 °C, different peaks were observed at 3734, 3701, 3629, and 3594 cm−1 (Fig. 15(Ac)) and 2380, 2342, and 2303 cm−1 [Fig. 15(Ac) (inset)] (representing gaseous CO2) in the stretching region. In the bending region, the peaks appeared at 1710, 1535, 1444, 1431, 1411, 1357, 1234, and 1119 cm−1 with negative bands at 1637 and 1565 cm−1 at 100 °C (Fig. 15(Bb)). The peak at 1710 cm−1 is assigned to bidentate carbonates,70 which increased in intensity. Also, the intensity of the peaks observed at 1534 cm−1 (carboxylates),54 a triplet at 1444, 1430 and 1411 cm−1 (maleates) decreased, while the bands at 1234 and 1119 cm−1 (phenolates) formed negative band at higher temperatures (Table 4). Upon reaching the higher temperatures of 200 °C, 250 °C and 300 °C, the vibrational bands obtained were almost the same as that found at 120 °C, where there was only an alteration in the intensity of certain bands. The previous bands observed at 1119 cm−1 became negative and the intensity of the triplet band at 1444, 1430 and 1411 cm−1 increased. The intensity of the negative bands at 3290, 1622 and 1561 cm−1 increased, thereby showing the usage of these intermediates. The other bands were almost similar. Therefore, the adsorption and reaction of o-DCB–He on the surface of VWC lead to the formation of maleates, carboxylates, bicarbonates and finally gaseous CO2, showing the complete oxidation of o-DCB in a non-oxidative atmosphere, which also indicates a strong MKV-type reaction, as shown in Scheme 11.
4. XPS-studies
The XPS studies were performed on the VC, WC and VWC catalysts before and after the o-DCB reaction in the presence of air to understand the role of the surface cation in the oxidative reaction together with the role of the CeO2 support, in which these oxides are dispersed on. This study was mainly extended to each oxide (VC, WC and VWC) to decipher the real role of the cations in the biphasic catalyst of VWC. Fig. 16 shows the XPS spectra of V-2p, Ce-3d, O-1s and C-1s for the fresh catalyst, VC sample and VC catalyst after being used in the catalytic oxidation of o-DCB in the presence of air. As shown in Fig. 16(Aa), the V-2p3/2 and 2p1/2 peaks are located at binding energies of 516.2 and 523.8 eV (Δε = 7.6 eV), respectively, showing the state of V5+ in V2O5, as observed previously in the literature.75,76 However, Fig. 16(Ab) shows the same V-2p spectra for the used sample after the in situ reaction in the FT-IR setup. The V-2p spectra could be deconvoluted into two peaks for 2p3/2 (516.8 and 515.3 eV) and 2p1/2 (524.4 and 522.9 eV), which are associated with the V5+ and V4+ states, respectively.75,76 Therefore, the V5+ form was partially reduced to V4+ during the formation of the different oxidation products, as observed in Scheme 2 and Scheme 3.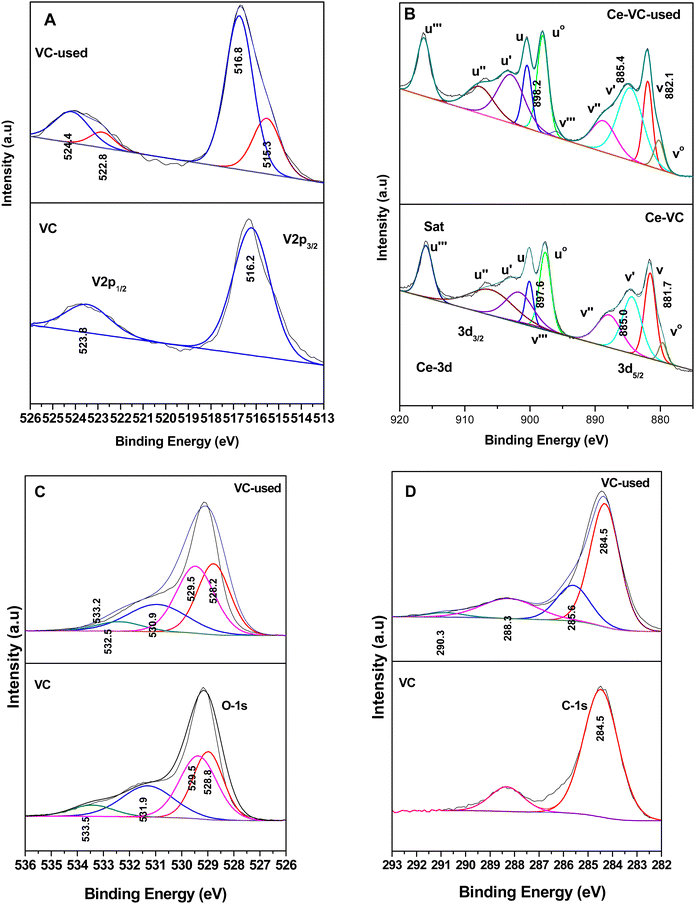 | ||
| Fig. 16 X-ray photoelectron spectra for (A) V-2p, (B) Ce-3d, (C) O-1s, and (D) C-1s with (a) V2O5–CeO2 (VC) and (b) used sample after the catalytic reaction (VC-used). | ||
Therefore, it can unambiguously be inferred that in the VC catalyst, V is one of the active centres, where the intermediates are both adsorbed and oxidised, thus reducing vanadium. Fig. 16B(a) and (b) show the XPS spectra for the support Ce-3d for fresh and used VC after the reaction, respectively. The Ce-3d spectrum is complex due to the fact that the Ce-3d orbitals are severely influenced by the hybridization of the Ce-4f orbitals with the O-2p valence band, as previously established by Burroughs et al.,74 Pfau and Schierbaum77 and Creaser et al.78 Briefly, 10 peaks were obtained for Ce, which could be divided into Ce 3d5/2 (v°, v, v, v′′, and v′′′) and 3d3/2 (u°, u, u′, u′′, and u′′′), respectively. Here, the peaks corresponding to v°, v′ and uo, u′ represent Ce3+, while the other six peaks correspond to Ce4+. The percentage of Ce3+ was calculated using the deconvoluted peak areas of the above-mentioned peaks, as reported in the literature73,76,79,80 and the results are shown in Table S1 (ESI†). However, it is clear from the discussion that Ce3+ increased after the oxidation reaction of o-DCB and air on the CeO2 support surface, clearly indicating that the CeO2 support was utilised for the adsorption and providing O2− for the reaction.
Fig. 17 shows the XPS data for the WC sample, where Fig. 17(A) shows the W-4f7/2 and W-4f5/2 peaks at 35.2 and 37.4 eV for the WC sample and 34.8 and 37.0 eV for the spent WC, respectively, showing the presence of W6+ in the WO3 samples, as observed in the literature.81–84 Although there was reduction in the content of W6+ in the spent catalyst (lower B.E), it is almost to the extent of W5+ reported earlier.83,84 The Ce in the WC sample is shown in Fig. 17(B), where Ce3+ was calculated in the same way as described earlier in Fig. 16(B). Here, the content of Ce3+ was determined to be about 34% and in the WC-used sample it increased to 46%, which again shows the formation of Ce3+ upon the oxidation reaction. This result indicates that in the WC catalysts, the reactant and intermediates are either adsorbed or react on the Ce4+ surface, leading to the formation of Ce3+. Similarly, the W6+ is also utilised by the different intermediates, as shown in Schemes 4 and 5. The O-1s spectrum, as shown in Fig. 17C, shows the most exceptional result in this series. The different O-1s peaks were located at 528.9, 529.5, 530.8 and 532.4 eV, where the first two peaks represent O–Ce4+/Ce3+ and O–W6+ (529.5 eV) and the other peak at 530.8 the surface –OH species and the peak at 532.4 eV represents the O-vacancy. In the WC used-sample, the respective O-vacancy peak at 532.7 eV increased substantially in peak area. The formation of O-vacancy can be related to the formation of bicarbonates, which definitely requires an H˙ source. The moisture produced during the formation of the intermediates such as carboxylates from the maleates will mostly dissociate over an O-vacancy to form –OH and H, which in turn are mostly utilised for the formation of bicarbonates. The further formation of O-vacancies may be associated with the formation of Ce3+ on the surface of WC. The C-1s spectrum in Fig. 17D shows the similar formation of peaks at 284.5 eV (on both WC and WC used), representing adventitious C. The other peaks observed in the C-1s spectrum of the WC used sample at 285.6, 288.2 and 288.9 eV represents enols, ketone/aldehyde, and carboxylate/carbonate, respectively, as shown in Schemes 4 and 5. Mostly, the high concentration of O-vacancies (Table S3, ESI†) is responsible for the formation of the H to produce the bicarbonates compared to that on the surface of VC and VWC. Therefore, the XPS data is generally consistent with the FT-IR data for the intermediates produced.
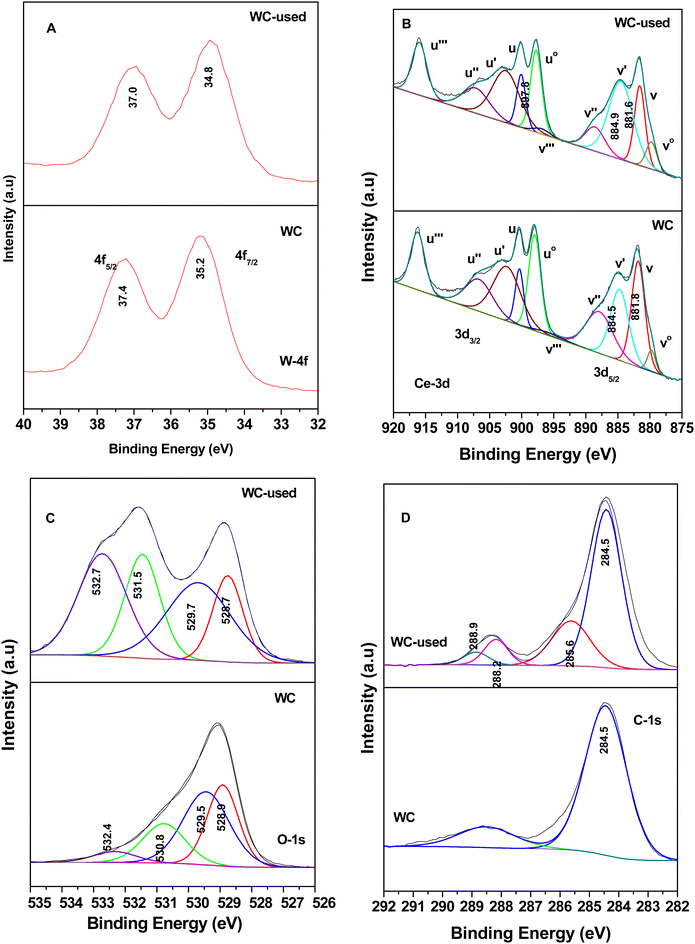 | ||
| Fig. 17 X-ray photoelectron spectra for WO3–CeO2 (WC) and sample used after the catalytic reaction (WC-used): (A) W-4f, (B) Ce-3d, (C) O-1s and (D) C-1s. | ||
The XPS spectra for the VWC and spent-catalyst VWC samples are displayed in Fig. 18. Initially, Fig. 18(A) shows the V-2p XPS data, where the V 2p3/2 and V 2p1/2 peaks are located at 516.6 and 523.8 eV representing V5+ of V2O5, as observed earlier for the other set of samples. However, in the case of the VWC sample, the there are two oxidation states of V5+ (516.7 and 523.9 eV) and the deconvoluted V4+ (515.6 and 522.8 eV) for the VWC used sample. This suggests that the adsorbates and the intermediates are adsorbed on V5+, which in turn is reduced for the other oxidative reactions. The Ce-3d spectrum, as shown in Fig. 18(C), shows the same effect as discussed in Fig. 16(C), where Ce can be divided into 10 peaks for Ce 3d5/2 and 3d3/2, where the particular peaks of v°, v′, u°, and u′ represent that of Ce3+ and the other six peaks correspond to Ce4+. The percentage of Ce3+ in CeO2 for VWC and VWC used is 31% and 52% (Table S1, ESI†), respectively, which shows that a good amount of Ce3+ is formed during the oxidation reaction. The O-1s spectrum is presented in Fig. 18(D), showing five deconvoluted peaks at 529.1, 529.4, 529.7, 531.2, and 532.6 eV, where the initial three peaks represent O–Ce4+ (CeO2), O–V5+ (V2O5), and O–W6+ (WO3), respectively, in the biphasic mixed oxides (V2O5, WO3) dispersed on the ceria support. The other two peaks in O-1s spectrum correspond to the surface –OH groups and the peak with highest binding energy (532.6 eV) suggests the presence of O-vacancies (Table S3, ESI†).
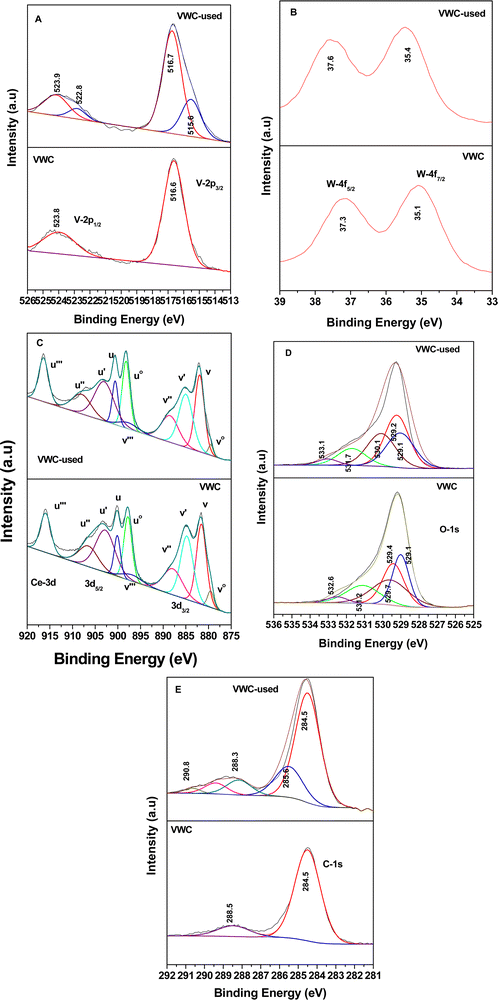 | ||
| Fig. 18 X-ray photoelectron spectra for WO3-V2O5–CeO2 (VWC) and sample used after the catalytic reaction (VWC-used): (A) V-2p, (B) W-4f, (C) Ce-3d, (D) O-1s and (E) C-1s. | ||
The C-1s spectrum, as shown in Fig. 18(E), for the VWC sample shows the presence of a peak at 284.5 eV for adventitious C, whereas the C-1s spectrum for the VWC used sample shows peaks at 284.5, 285.6, 288.3, and 290.8 eV, where the first peak represents the adventitious C and the other peaks represent enols, maleates/carboxylates and carbonates, respectively. The W-4f spectrum in Fig. 18(B) shows peaks at 35.1 and 37.3 eV for W 4f7/2 and W 4f5/2, representing W6+ in WO3, described earlier. However, for the VWC samples, there was an increment in the binding energy of the W-4f peaks in the VWC used sample, suggesting the loss of electron density from W6+.
The overall mechanism inferred by the XPS understanding is represented by the model shown in Scheme 12.
5. Discussion
The above-mentioned results for the in situ FT-IR and intermediates derived from the corresponding IR dataset portrayed in the different schemes and the XPS data of the catalysts before and after the o-DCB oxidation process raise certain pertinent questions, as follows: (a) in the case of WC presented in Scheme 5, the formation of bicarbonates from the carboxylates is observed. Now, the formation of bicarbonates requires H˙ as a source. How is it obtained on the surface of WC? This needs to be understood. (b) One of the findings in almost all the catalysts (VC, WC and VWC) is the formation of CO2 from o-DCB, even in the absence of O2. Although this strongly points towards the Mars–Van Krevelen mechanism (MVK), where the use of lattice oxygen leads to the initiation and formation of the intermediates in the absence of O2, the extent of complete oxidation needs to be understood. (c) The XPS studies confirmed the presence of surface V4+/W5+/Ce3+ together with surface O-vacancies. However, their role in the formation of the different surface intermediates needs to be understood. (e) In the process of initial adsorption, the VC surface shows the presence of enolate/phenolate in the presence of O2 and mainly phenolate in the absence of O2. The WC surface showed reactive adsorption in the presence of O2 where upon adsorption it forms a π-ring complex, enolate/phenolate, benzoquinonate and maleate, whereas in the absence of O2, only enolate/phenolate are formed. Alternatively, the VWC surface shows reactive adsorption both in the presence and absence of O2 to form a π-ring complex, enolate/phenolate, benzoquinonate and maleate. Thus, it will be quite interesting to understand these scenarios. (f) Why in the XPS studies usually in WC, W6+ transformed into W5+, whereas in VWC, V goes from V5+ to V4+ and Ce4+ to Ce3+ but for W6+ the oxidation state remains almost unchanged?According to Scheme 5, it is quite pertinent that the formation of bicarbonate as an intermediate from carboxylates occurs, which requires a source of H˙ or dissociation of H2O over the surface to further form surface –OH groups and H˙. The presence of substantial O-vacancies (Fig. 17(C)) in the WC catalyst (Table S3, ESI†) may give rise to sites where either the dissociation of H2O produced as an oxidation product of the previous intermediates occurs or may be formed by the abstraction of an H˙ from the carboxylates themselves over O-vacancy surface sites. This results in an increase in the content of surface –OH groups (Fig. 17C), which was previously observed for the hydroxyl radical in photocatalytic mechanism,85 and also for the hydrogenation reaction of CO2 on the surface of ceria.86 Therefore, the O-vacancy on the support and WO3 catalyst can be a result of this effect. There is another substantial question that also needs attention. The O-1s XPS spectra (Fig. 17C) also show that there is an increase in the O-vacancy concentration with the WC-used catalyst. According to the above-mentioned explanation, there should have been a decrease in the O-vacancy sites as they are being used in the process of formation of H˙ used for the formation of bicarbonates. However, the substantial formation of Ce3+ was observed in the CeO2 support (Fig. 17(B)), leading to the formation of O-vacancy together with the same effect for the formation of W5+ (Fig. 17(A)) in the spent-catalyst in WO3, which also leads to the formation of the O-vacancy. Therefore, the net result shows an increase in the concentration of O-vacancies (Table S3, ESI†).
The next question that needs attention is the oxidation of o-DCB on VC, WC and VWC in the absence of O2. CeO2 possessing labile lattice oxygen was subjected to the inherent O-vacancies present in its structure, which is responsible for the Mars–Van Krevelen (MKV) mechanism. This mechanism shows the use of the lattice O-vacancy for the initiation of an oxidative reaction rather than the use of O-adsorbed and other reactant adsorbed sites. The MKV mechanism mainly evolves where the rate of the reaction is dependent on the M–O (metal oxygen) bond/M-X (X = O, Cl, S) or also depends more on the presence of M–Vo.87 The oxidation of benzaldehyde, the reverse reaction, can proceed with only the oxide lattice oxygen, as has been seen in the literature previously by Kiado's group by IR studies.88,89 Similarly, the in situ IR spectra of adsorbed acetic acid were studied and they provided an indication that acetic acid interacts with oxygen vacancies upon the formation of an asymmetric bidentate adsorption complex, which was shown earlier by the Ponec group,90 where the formation of the adsorption intermediates can be loosely visualised as shown in Scheme 13.
However, here, the MKV proceeds to the maximum extent of complete oxidation mostly due to the larger availability of O-vacancies, which increase as a function of both adsorption and reaction with the intermediates, facilitating the larger enthalpy supplied for the complete oxidative process. This is absent in the supports such as TiO2 and SiO2 for the same type of reaction. TiO2 as a support leads to the formation of the intermediates but not the complete oxidation to CO2 in an He atmosphere as observed by our group recently. In contrast, the CeO2 support with more O-vacancies and tendency to evolve O2 mostly results in the complete oxidation in an He-atmosphere.
The catalytic reactions for the different catalysts VC, WC and VWC were performed at 100 °C, 150 °C, 175 °C, 200 °C, where the desorption temperature was understood by in situ FT-IR, as presented in Table S4 (ESI†). Also these catalysts could be recycled for at least two to three cycles. Therefore, the XPS studies, as depicted in Scheme 12, shows the formation of V4+ from V5+ in V2O5 (VC and VWC), W5+ from W6+ (WC) and Ce3+ from Ce4+ (VC, WC, and VWC), which are mostly formed either in the process of the oxidative intermediate or to stabilize a particular oxidative intermediate. In this process, the formation of the corresponding O-vacancy (Table S3, ESI†) also occurs to preserve the charge neutrality. However, according to the desorption temperature, it is quite pertinent to say that the reduced catalyst is oxidised back in the presence of O2 together with the intermediates present on its surface to regain the catalyst.
The reactive adsorption on the surface of WC in the presence of air can be attributed to the fact that the enolates are transformed to maleates. This may occur through the benzoquinonate intermediate that is found in the VWC catalyst, which is mostly is a conjugative stable structure. However, in VWC, the reactive adsorption both in the presence and absence of O2 can be explained by the fact that o-DCB id adsorbed on the surface on two different metal sites, V5+ and W6+, as shown in Scheme 9. This will lead to considerable strain in the ring structure of benzoquinonate, leading to formation of maleate, which was also observed in the He atmosphere. In VWC, two sites exist, V5+ and W6+, together with that of the CeO2 support, in which Ce4+/Ce3+ co-exist. The reduction potential of V5+/V4+ is lower than that of W6+/W5+ and in the presence of both oxides, the preferential reduction of V5+ in SCR catalysts was previously observed.91 Therefore, in the VC, WC and VWC series of catalysts, it was found that these catalysts mineralize o-DCB to CO2 in the presence or absence of air notably through different intermediates, which are described in the different scheme (Schemes 2–11) and the surface species are described in Scheme 12, where the correlation between them can be understood.
The order of the catalytic activity could be understood from the above understanding of the different intermediates formed on the surface of the different VC, WC and VWC catalysts. Ceria was used as a support, which primarily acts as a synergistic support and is definitely beneficial for the process of adsorption utilising its own hydroxyl groups. Also, the XPS studies revealed that CeO2 possesses more Ce3+ after the process of reaction/adsorption, which shows the adsorption or reaction using Ce4+ sites mainly. Also, the O-vacancy sites present in ceria are utilised in the process of oxidation together with adsorbed O2, which can be easily observed from the reaction in an He-atmosphere. The reaction rate (Fig. 4) can be understood based on the different surface intermediates formed. VWC upon adsorption only forms reactive adsorption, resulting in formation of maleates, which clearly indicates the ring strain, where the adsorbed enolate/benzoquinonates species as the adsorbed species are adsorbed over both V and W, causing the ring strain (Scheme 7) and leading to ring opening during the adsorption from maleates. These maleate form carboxylates, bidentate carbonates (BDC) and monodentate carbonates (MDCs), leading to the formation of CO2. The formation of MDCs was neither observed on the surface of VC nor WC, which also did not show faster transition from the intermediates to CO2 formation with faster kinetics. Both the adsorption and formation of MDCs, which are more labile and easily form CO2 compared to BDCs, can explain why the surface of VWC resulted in the formation of CO2 both at a lower temperature (120 °C) and at a faster rate. Also, VWC was shown to possess O-vacancies to a greater extent, which mostly explains the formation of MDCs from BDCs. In contrast, the comparison between the WC and VC surfaces is not very helpful to explain their catalytic activities. The WC surface shows the formation of bicarbonates, which is not observed in the other surfaces. Schemes 1 and 2 show the formation of different adsorbed and intermediates in the reaction on the surface of VC, which has a lower number of intermediates that are less adsorbed on its surface. Also, in the process of adsorption, only the formation of phenolates and enolates was accounted for, whereas in the case of WC, the formation of π-ring intermediates together with phenolates and enolates was observed. The enolates mainly form the different intermediates, which will be lower in the WC surface, resulting in its lower activity. Also, in the VC surface, the intermediates are adsorbed over the V5+ surface (Scheme 11), which results in the formation of V4+ sites. Therefore, the oxidation of the different intermediates over the V5+ surface and the transfer of electrons will be faster on VC compared to WO3 in WC, where W6+ does not completely reduce to W5+. This signifies that although the W6+ sites are responsible for the adsorption and oxidation, they do not completely reduce to the state of W5+ themselves, although the electron density over their part is mainly used in the process of the oxidation reaction. This can also be a strong reason for VC being more reactive compared to WC.
6. Conclusion
The complete mineralization of o-DCB (a representative molecule for dioxins and furans) occurred at ∼120 °C under static conditions, which is much lower than that of the present generic industrial catalysts (effective at ∼175 °C). To the best of our knowledge, VWC is the most active catalyst (working at 120 °C) reported to date for the mineralization of o-DCB, which can subsequently be utilized for the mineralization of dioxins and furans. The rate of the prepared catalysts followed the order of VWC ≫ VC > WC. The TOF value showed that the V5+-sites are better as compared to the W6+ sites. The reaction rates were understood at different temperatures based on the different surface intermediates formed over the three catalysts. VC, WC and VWC showed different mechanisms for the mineralization of o-DCB with different sites for adsorption and reaction. WC and VWC showed reactive adsorption of o-DCB and air/He, showing formation of maleates. Different sets of intermediates were formed over these catalysts in the presence and absence of oxygen, which highlights the effect of O-vacancies from the support and catalysts. In the VC catalyst, the adsorption and the reaction center was V5+, which was reduced to V4+ in the reaction process; WC showed W6+ as the active sites, which was reduced to W5+ in the reaction process; however, because VWC had different reaction centres, V5+ was reduced to V4+ but W6+ is not reduced to that extent of W5+. In the absence of oxygen, o-DCB was also mineralized to CO2, showing the strong effect of the labile lattice oxygen and definite Mars–Van Krevelen (MKV)-type mechanism. The overall reaction mechanism for the best catalyst VWC showed the formation of maleates, carboxylates/acetates, carbonates, and ultimately monodentate carbonate to form CO2. The adsorption of the v aromatic (π-ring) occurred over two different metal sites, V and W, dispersed over different planes of CeO2, resulting in strong ring strain and mostly faster ring opening and faster kinetics. Also, CeO2 exhibited a strong effect, where the post-adsorption Ce3+ concentration together with O-vacancies increased, showing the definite effect of lattice oxygen in the reaction intermediate process.Author contribution
Adarsh has synthesized the catalysts, done the characterization of these and has completed the catalytic reactions in in situ FT-IR instrument. Dr Deepak Tyagi has synthesized nano ceria, VC WC and VWC catalysts and has helped Adarsh in his synthesis process. Dr V. Krishnan and Shri. Husan Chand of IIT- Mandi has carried over the XPS data for the samples. Dr S. Varma has helped in checking the manuscript and has given important insight for reaction calculation. Dr K. Bhattacharyya has conceptualized the scientific problem, written the complete manuscript, completed all the mechanism from the data, plotted all the plots and has guided Adarsh on all grounds. Dr A. K. Tyagi has corrected the manuscript and has given important scientific suggestions to understand the mechanism, and catalytic property.Conflicts of interest
The authors declares no conflict of interest and no fund utilised.Acknowledgements
Dr Priyanka Ruz of Chemistry Division for taking the BET surface area data; Dr Naveen Kumar of Material Science Division for the TEM experiments and Dr Purushottam Jha of TPD for taking the Raman data.References
- S. K. Kirkok, J. K. Kibet, T. K. Kinyanjui and F. I. Okanga, SN Appl. Sci., 2020, 2(1729), 1–19 Search PubMed
.
- A. A. Fauzi, A. A. Jalil, N. S. Hassan, F. F. A. Aziz, M. S. Azami, I. Hussain, R. Saravanan and D. V. N. Vo, Chemosphere, 2022, 286, 131651 CrossRef CAS PubMed
.
- S. Kanan and F. Samara, Trends Environ. Anal. Chem., 2018, 17, 1–13 CrossRef CAS
.
- R. Rathna, S. Varjani and E. Nakkeeran, J. Environ. Manage., 2018, 223, 797–806 CrossRef CAS PubMed
.
- B. H. Aristizabal, C. M. de Correa, A. I. Serykh, C. E. Hetrick and M. D. Amiridis, J. Catal., 2008, 258, 95–102 CrossRef CAS
.
- R. Weber, T. Sakurai and H. Hagenmaier, Appl. Catal., B, 1999, 20, 249–256 CrossRef CAS
.
- T. Cai, H. Huang, W. Deng, Q. G. Dai, W. Liu and X. Y. Wang, Appl. Catal., B, 2015, 166, 393–405 CrossRef
.
- B. H. Aristizabal, C. Maya and C. M. de Correa, Appl. Catal., A, 2008, 335, 211–219 CrossRef CAS
.
- J. Choi, C. B. Shin, T. J. Park and D. J. Suh, Appl. Catal., A, 2006, 311, 105–111 CrossRef CAS
.
- K. Poplawski, J. Lichtenberger, F. J. Keil, K. Schnitzlein and M. D. Amiridis, Catal. Today, 2000, 62, 329–336 CrossRef CAS
.
- X. D. Ma, J. S. Shen, W. Y. Pu, H. W. Sun, Q. Pang, J. Guo, T. Zhou and H. Q. Cao, Appl. Catal., A, 2013, 466, 68–76 CrossRef CAS
.
- D. A. Aguilera, A. Perez, R. Molina and S. Moreno, Appl. Catal., B, 2011, 104, 144–150 CrossRef CAS
.
- J. I. Gutierrez-Ortiz, R. Lopez-Fonseca, U. Aurrekoetxea and J. R. Gonzalez-Velasco, J. Catal., 2003, 218, 148–154 CrossRef CAS
.
- R. Lopez-Fonseca, B. de Rivas, J. I. Gutierrez- Ortiz, A. Aranzabal and J. R. Gonzalez-Velasco, Appl. Catal., B, 2003, 41, 31–42 CrossRef CAS
.
- W. Zhao, J. Cheng, L. Wang, J. L. Chu, J. K. Qu, Y. H. Liu, S. H. Li, H. Zhang, J. C. Wang, Z. P. Hao and T. Qi, Appl. Catal., B, 2012, 127, 246–254 CrossRef CAS
.
- S. K. Agarwal, J. J. Spivey and J. B. Butt, Appl. Catal., A, 1992, 81, 239–255 CrossRef CAS
.
- M. X. Zhan, J. Y. Fu, L. J. Ji, I. Deviatkin and S. Y. Lu, Chemosphere, 2018, 191, 895–902 CrossRef CAS
.
- C. C. Yang, S. H. Chang, B. Z. Hong, K. H. Chi and M. B. Chang, Chemosphere, 2008, 73, 890–895 CrossRef CAS PubMed
.
- S. Krishnamoorthy, J. P. Baker and M. D. Amiridis, Catal. Today, 1998, 40, 39–46 CrossRef CAS
.
- S. Krishnamoorthy and M. D. Amiridis, Catal. Today, 1999, 51, 203–221 CrossRef CAS
.
- S. Krishnamoorthy, J. A. Rivas and M. D. Amiridis, J. Catal., 2000, 193, 264–272 CrossRef CAS
.
- X. Ma, X. Feng, J. Guo, H. Cao, X. Suo, H. Sun and M. Zheng, Appl. Catal., B, 2014, 147, 666–676 CrossRef CAS
.
- M. Huang, H. Yan, T. F. Heinz and J. Hone, J. Nano Lett., 2010, 10, 4074–4079 CrossRef CAS PubMed
.
- X. Qiu, L. Li, J. Zheng, J. Liu, X. Sun and G. Li, J. Phys. Chem. C, 2008, 112, 12242–12248 CrossRef CAS
.
- Q. Wang, K. L. Yeung and M. A. Banares, J. Catal., 2018, 364, 80–88 CrossRef CAS
.
- Q. Wang, K. L. Yeung and M. A. Banares, Catal. Today, 2020, 356, 141–154 CrossRef CAS
.
- J. Zeng, X. Liu, J. Wang, H. Lv and T. Zhu, J. Mol. Catal. A: Chem., 2015, 408, 221–227 CrossRef CAS
.
- T. Kropp, J. Paier and J. Sauer, J. Am. Chem. Soc., 2014, 136(41), 14616–14625 CrossRef CAS PubMed
.
- C.-H. Cho and S.-K. Ihm, Environ. Sci. Technol., 2002, 36(7), 1600–1606 CrossRef CAS PubMed
.
- J. B. Butt, J. J. Spivey and S. K. Agrawal, Stud. Surf. Sci. Catal., 1994, 88, 19–31 CrossRef CAS
.
- D. Delimaris and T. Ioannides, Appl. Catal., B, 2008, 84(1–2), 303–312 CrossRef CAS
.
- J. Zhu, F. Gao, L. Dong, W. Yu, L. Qi, Z. Wang, L. Dong and Y. Chen, Appl. Catal., B, 2010, 95(1–2), 144–152 CrossRef CAS
.
- X. Li, Z. Wang, J. Sun, R. Oh, J. Feng, D. Shi, W. Zhao and S. Liu, J. Energy Inst., 2020, 93(4), 1511–1518 CrossRef CAS
.
- H. J. Whitfield, D. Roman and A. R. Palmer, J. Inorg. Nucl. Chem., 1966, 28, 2817–2825 CrossRef CAS
.
- V. Grover, A. Banerji, P. Sengupta and A. K. Tyagi, J. Solid State Chem., 2008, 181, 1930–1935 CrossRef CAS
.
- B. M. Reddy, A. Khan, Y. Yamada, T. Kobayashi, S. Loridant and J. C. Volta, Langmuir, 2003, 19, 3025–3030 CrossRef CAS
.
- A. Filtschew, K. Hofmann and C. Hess, J. Phys. Chem. C, 2016, 120, 6694–6703 CrossRef CAS
.
- M. F. Daniel, B. Desbat, J. C. Lassegues, B. Gerand and M. Figlarz, J. Solid State Chem., 1987, 67, 235–247 CrossRef CAS
.
- C. Du, S. Lu, Q. Wang, A. G. Buekens, M. Ni and D. P. Debecker, Chem. Eng. J., 2018, 334, 519–544 CrossRef CAS
.
- S. C. Petrosius, R. S. Drago, V. Young and G. C. Grunewald, J. Am. Chem. Soc., 1993, 115, 6131–6137 CrossRef CAS
.
- Y. Liu, Z. Wei, Z. Feng, M. Luo, P. Ying and C. Li, J. Catal., 2001, 202, 200–204 CrossRef CAS
.
- C. C. Yang, S. H. Chang, B. Z. Hong, K. H. Chi and M. B. Chang, Chemosphere, 2008, 73, 890–895 CrossRef CAS PubMed
.
- R. W. V. D. Brink, M. Krzan, M. M. R. F. Jeurissen and R. L. P. Mulder, Appl. Catal., B, 2000, 24, 255–264 CrossRef
.
- M. S. Kamal, S. A. Razzak and M. M. Hossain, Atmos. Environ., 2016, 140, 117–134 CrossRef CAS
.
- Q. Dai, X. Wang and G. Lu, Catal. Commun., 2007, 8, 1645–1649 CrossRef CAS
.
- Q. Dai, X. Wang and G. Lu, Appl. Catal., B, 2008, 81, 192–202 CrossRef CAS
.
- H. Li, G. Lu, Q. Dai, Y. Wang, Y. Guo and Y. Guo, ACS Appl. Mater. Interfaces, 2010, 2, 838–846 CrossRef CAS
.
- D. Mahadevan, S. Periandy and S. Ramalingam, Spectrochim. Acta, Part A, 2011, 79, 962–969 CrossRef CAS PubMed
.
- D. Shoba, S. Periandy, M. Karabacak and S. Ramalingam, Spectrochim. Acta, Part A, 2011, 83, 540–552 CrossRef CAS PubMed
.
- B. H. Aristizabal, C. M. Correa, A. I. Serykh, C. E. Hetrick and M. D. Amiridis, Microporous Mesoporous Mater., 2008, 112, 432–440 CrossRef CAS
.
- W. Deng, Q. Dai, Y. Lao, B. Shi and X. Wang, Appl. Catal., B, 2016, 181, 848–861 CrossRef CAS
.
- L. Palmisano, M. Schiavello, A. Sclafani, G. Martra, E. Borello and S. Coluccia, Appl. Catal., B, 1994, 3, 117–132 CrossRef CAS
.
- J. Bandara, J. A. Mielczarski and J. Kiwi, Appl. Catal., B, 2001, 34, 307–320 CrossRef CAS
.
- Y. Gu, X. Jiang, W. Sun, S. Bai, Q. Dai and X. Wang, ACS Omega, 2018, 3, 8460–8470 CrossRef CAS PubMed
.
- C. Sanchez, J. Livage and G. Lucazea, J. Raman Spectrosc., 1982, 12, 68–72 CrossRef CAS
.
- S. Albonetti, S. Blasioli, R. Bonelli, J. E. Mengou, S. Scire and F. Trifiro, Appl. Catal., A, 2008, 341, 18–25 CrossRef CAS
.
- A. Ramsletter and M. Baerns, J. Catal., 1988, 109, 303–313 CrossRef
.
- P. S. Chintawar and H. L. Greene, J. Catal., 1997, 165, 12–21 CrossRef CAS
.
- H. Miyata, T. Ohno and F. Hitayama, J. Chem. Soc., Faraday Trans., 1995, 91, 3505 RSC
.
- C. Zhu, X. Wei, W. Li, Y. Pu, J. Sun, K. Tang, H. Wan, C. Ge, W. Zou and L. Dong, ACS Sustainable Chem. Eng., 2020, 8, 14397–14406 CrossRef CAS
.
- E. Finocchio, G. Busca, V. Lorenzelli and R. Willey, J. Chem. Soc., Faraday Trans., 1994, 90, 3347–3356 RSC
.
- J. Rasko and F. Solymosi, J. Phys. Chem., 1994, 98, 7147–7152 CrossRef CAS
.
- J. Lichtenberger and M. D. Amiridis, J. Catal., 2004, 223, 296–308 CrossRef CAS
.
- G. Busca, G. Ramis and V. Lorenzelli, J. Mol. Catal., 1989, 55, 1–11 CrossRef CAS
.
- V. E. Suprunov and A. A. Ivanov, React. Kinet. Catal. Lett., 1987, 33, 75–80 CrossRef CAS
.
- V. S. Escribano, G. Busca and V. Lorenzelli, J. Phys. Chem., 1990, 94, 8939 CrossRef
.
- A. J. V. Hengstum, J. Pranger, S. M. V. Hengstum-Nijhuis, J. G. V. Ommen and P. J. Gellings, J. Catal., 1986, 101, 323–330 CrossRef
.
- Y. Liu, W. C. Wu, Y. J. Guan, P. L. Ying and C. Li, Langmuir, 2002, 18, 6229–6232 CrossRef CAS
.
- K. Bhattacharyya, A. Danon, V. K. Vijayan, K. A. Gray, P. C. Stair and E. Weitz, J. Phys. Chem. C, 2013, 117, 12661–12678 CrossRef CAS
.
- L. F. Liao, C. F. Lien, D. L. Shieh, M. T. Chen and J. L. Lin, J. Phys. Chem. B, 2002, 106, 11240–11245 CrossRef CAS
.
- J. Baltrusaitis, J. Schuttlefield, E. Zeitler and V. H. Grassian, Chem. Eng. J., 2011, 170, 471–481 CrossRef CAS
.
- E. Spinner, The vibration spectra of some substituted acetate ions, J. Chem. Soc., 1964, 4217–4226 RSC
.
- C. Force, E. Roman, J. M. Guil and J. Sanz, Langmuir, 2007, 23, 4569–4574 CrossRef CAS PubMed
.
- A. Burroughs, A. Hamnett, A. F. Orchard and G. J. Thornton, J. Chem. Soc., Dalton Trans., 1976, 1, 1686 RSC
.
- K. Bhattacharyya, S. Varma, A. K. Tripathi, S. R. Bharadwaj and A. K. Tyagi, J. Phys. Chem. C, 2008, 112, 19102–19112 CrossRef CAS
.
- B. M. Reddy, A. Khan, Y. Yamada, T. Kobayashi, S. Loridant and J. C. Volta, J. Phys. Chem. B, 2003, 107, 5162–5167 CrossRef CAS
.
- A. Pfau and K. D. Schierbaum, Surf. Sci., 1994, 321, 71–80 CrossRef CAS
.
- D. A. Creaser, P. G. Harrison, M. A. Morris and B. A. Wolfindale, Catal. Lett., 1994, 23, 13 CrossRef CAS
.
- F. Jiang, S. Wang, B. Liu, J. Liu, L. Wang, Y. Xiao, Y. Xu and X. Liu, ACS Catal., 2020, 10, 11493–11509 CrossRef CAS
.
- K. I. Maslakov, Y. A. Teterin, A. J. Popel, A. Y. Teterin, K. E. Ivanov, S. N. Kalmykov, V. G. Petrov, P. K. Petrov and I. Farnan, App. Surf. Sci., 2018, 448, 154–162 CrossRef CAS
.
- K. Bhattacharyya, G. P. Mane, V. Rane, A. K. Tripathi and A. K. Tyagi, J. Phys. Chem. C, 2021, 125, 1793–1810 CrossRef CAS
.
- W. Wang, Y. Yang, H. Luo, H. Peng and F. Wang, Ind. Eng. Chem. Res., 2011, 50(19), 10936–10942 CrossRef CAS
.
- W. Li, P. Da, Y. Zhang, Y. Wang, X. Lin, X. Gong and G. Zhneng, ACS Nano, 2014, 8(11), 11770–11777 CrossRef CAS PubMed
.
- H. Fang, C. Y. Ma, T. L. Wan, M. Zhang and W. H. Shi, J. Phys. Chem. C, 2007, 33, 12872 CrossRef
.
- J. Choi, H. H. H. Kim, K. M. M. Lee, N. Chen, M. S. Kim, J. Seo, D. Lee, H. Cho, H. I. Kim, J. Lee, H. Lee and C. Lee, Chem. Eng. J., 2022, 432, 134401 CrossRef CAS
.
- K. Chang, H. Zhang, M. J. Cheng and Q. Lu, ACS Catal., 2020, 10, 13–631 Search PubMed
.
- C. Doornkamp and V. Ponec, J. Mol. Catal. A: Chem., 2000, 162, 19–32 CrossRef CAS
.
- W. M. H. Sachtler, G. J. H. Dorgelo, J. Fahrenfort and R. J. H. Voorhoeve, in Proceedings of the 4th International Congress on Catalysis, Akademiai Kiado, Budapest, 1971, vol. 1, p. 454 Search PubMed.
- A. Kiado, C. A. Koutstaal, P. A. J. M. Angevaare and V. Ponec, J. Catal., 1993, 143, 573 CrossRef
.
- Z. F. Pei and V. Ponec, Appl. Surf. Sci., 1996, 103, 171 CrossRef CAS
.
- X. Zhao, Y. Yan, L. Mao, M. Fu, H. Zhao, L. Sun, Y. Xiao and G. Dong, RSC Adv., 2018, 8, 31081–31093 RSC
.
Footnote |
| † Electronic supplementary information (ESI) available: Fig. S1 shows the pre-treatment of the vanadium oxide catalyst dispersed on ceria at different temperatures for 120 min; Fig. S2 shows the BET nitrogen adsorption desorption isotherms of ceria, VC, WC and VWC; Table S1 represents the concentration of Ce3+ present in the different samples and the samples after being used as a catalyst; Table S2 represents the concentration of the catalyst from the surface elemental concentration; Table S3 represents the concentration of O-vacancy after the reaction on the different thermal catalysts from XPS; Fig. S4 shows the different kinetics for the percentage conversion of v (%) to CO2 as the product from the oxidation of o-DCB using the different catalysts, showing the percentage o-DCB conversion on the three different catalysts (A) VC; (B) WC and (c) VWC as a function of temperature for: (1) 100 °C; (2) 120 °C; (3) 175 °C; and (4) 200 °C; Table S4 (ESI†) represents typical desorption temperature for the catalytic reaction of o-DCB and air and without oxygen; Table S5: SAED pattern calculation for the VC and VWC samples; Fig. S5: intermediates and products formed upon reaction of o-DCB and air over ceria support at different temperatures; Fig. S6: TG-DSC for decomposition of cerium(III) carbonate under air flow; Fig. S7: XRD patterns for ceria prepared by direct decomposition of cerous carbonate at 250 °C and 350 °C; Fig. S8: FT-IR data for the CeO2 catalysts as a function of temperature: (a) 100 °C; (b) 200 °C; and (c) 300 °C. See DOI: 10.1039/d3ma00628j |
| This journal is © The Royal Society of Chemistry 2024 |

