 Open Access Article
Dual-phase Yb-doped La2Ce2O7 materials for fuel flexible SOFCs†
Bishnu
Choudhary
 *ab and
Shahid
Anwar
 *ab
*ab
aAcademy of Scientific and Innovative Research (AcSIR), Ghaziabad-201002, India. E-mail: shahidanwr@gmail.com; shahid@immt.res.in; bishnumailg@gmail.com
bCSIR-Institute of Minerals and Materials Technology (IMMT), Bhubaneswar-751013, India
First published on 30th January 2024
Abstract
La2−xYbxCe2O7 (where x = 0, 0.05, 0.10, 0.15, and 0.20) has been studied as a possible electrolyte material for solid oxide fuel cells (SOFCs), demonstrating a novel material. Nanosized La2−xYbxCe2O7 ceramics have been synthesized via the glycine nitrate combustion method. To elucidate the dual phase character (F-type and C-type phase) present in the Yb-doped La2Ce2O7, extensive X-ray diffraction and Raman spectroscopy analyses have been performed to thoroughly investigate the crystal structure and phases. Furthermore, doping has been shown to affect the dual phases present in the system. The ionic conductivity and the space charge potential of the Yb-doped La2Ce2O7 have been analyzed in details and the highest ionic conductivity of 3.3 × 10⁻³ S cm−1 at 700 °C is achieved at x = 0.05. Therefore, the La1.95Yb0.05Ce2O7 composition has been chosen for the electrophoretic deposition (EPD) for SOFCs fabrication. The La1.95Yb0.05Ce2O7 film, coated using EPD in isopropanol, is found to be crack-free and dense with a thickness of approximately 14 μm. The maximum power density of the fabricated cell is observed to be 589 and 420 mW cm−2 at 700 °C in wet hydrogen and methane fuel, respectively. Impedance spectrum analysis utilizing the distribution of relaxation time (DRT) analysis shows that the gas diffusion process in the electrodes plays a significant role in the overall polarization of the cell.
1. Introduction
Several A2B2O7-based oxides, in particular doped La2Ce2O7 (LCO), have been demonstrated in recent studies to have fairly good proton conductivity and to be robust in moist environments, making them a potential replacement for conventional materials used in SOFC devices.1–7 In comparison to the electrolytes associated with Ba(Ce–Zr–Y)O3, LCO bulk (pellet) has shown a range of sintering temperatures ranging from 1100 to 1300 °C. This represents a noteworthy reduction in sintering temperature in the free-standing pellet form. Therefore, there is a possibility of reduction of the processing temperature in SOFC devices using LCO.2,8–11 The use of a lower processing/sintering temperature, nanomaterials, and new technologies has the potential benefit of lowering the expense of fuel cell manufacturing in addition to enhancing the electrochemical performance.12–14 Nevertheless, when employing La2Ce2O7 related electrolytes, the electrochemical performance is relatively low in comparison to Ba(Ce–Zr–Y)O3 based electrolytes due to the lower proton conductivity.7,15–19 New strategies are necessary for the enhancement of proton conductivity while simultaneously ensuring the preservation of the chemical and thermal stability of newly doped La2Ce2O7 materials. There are new challenges in predicting the structural phase of doped La2Ce2O7 ceramics, which are known to be biphasic in nature (F-type and C-type phases), each with its own distinct ionic conducting behavior.2,9 A number of elemental doping strategies were executed on LCO with the aim of enhancing its ionic conductivity with retained chemical stability.7 Nonetheless, the investigations concerning the influence of the F/C phases and oxygen deficiencies on the ionic conductivity in these particular systems still lack clarity and demand further exploration to enable the engineering of material properties.The LCO based materials have been reported to demonstrate exceptional catalytic activity for the oxidation coupling of methane within the intermediate temperature range of SOFCs.7,20–23 Recently, Zhao et al.24 reported the use of LCO and Sm-doped LCO (La1.95Sm0.05Ce2O7) as an internal reforming layer for methane, which was found to be stable in wet methane as compared to Sm-doped ceria. They proposed that when CH4 was supplied, it first reaches the catalyst Ni–La1.95Sm0.05Ce2O7 layer, and undergoes water absorption and is converted into syngas before reaching the anode (Ni–Sm doped ceria). When compared with CH4, syngas has been determined to possess superior carbon resistance and electroactivity. As a consequence, SOFCs with a catalytic layer of Ni+ Sm-doped LCO display ameliorated electrochemical performance and stability in the presence of wet CH4, in contrast to those without the catalyst layer. This study elucidates that doped LCO has the potential to serve as a viable candidate for a direct internal reforming layer. The direct use of doped LCO as an anode and a direct methane reforming layer without any extra layers may present a potential benefit for the advancement of SOFC technology. These potential benefits should be investigated to determine their stability in methane fuel to the anode made of doped LCO ceramics.
The thin coating of electrolyte on the anodic surface (anode supported cell) is a challenging endeavor that necessitates the utilization of an inexpensive and uncomplicated approach from a commercial standpoint. The anode supported electrolyte films based on LCO utilize the dry pressing method, which has been applied in most of the LCO-based SOFC studies.1,8,25,26 However, this technique may pose challenges for larger SOFC production. The electrophoretic deposition of thin and compact electrolytes may be regarded as a cost-effective technology for SOFC industries.27–29 Several classes of electrolyte material coatings utilizing EPD have been documented in the literature for the application of SOFCs.29 A few attempts have been made towards the deposition of LCO-based electrolytes.30–32 However, the investigation of EPD coatings for Yb-doped LCO has not been explored.
In this particular study, the synthesis of La2−xYbxCe2O7 (where x values are 0, 0.05, 0.10, 0.15 and 0.20) nanoceramics was carried out by means of the glycine nitrate combustion route. A comprehensive study of the total ionic conductivity of the La2−xYbxCe2O7 series was conducted, with significant emphasis on the contributions of the grain and grain boundary. The optimization of the thin film electrolyte coating of La2−xYbxCe2O7 was achieved using EPD method. The resulting fuel electrode-supported SOFCs were fabricated using EPD, and their electrochemical performance was evaluated in the presence of wet hydrogen and wet methane at intermediate temperatures ranging from 700 to 500 °C (along with a short term stability test at 700 °C), with electrochemical reaction analysis being conducted using DRT analysis.
2. Experimental
La2−xYbxCe2O7 (x = 0, 0.05, 0.10, 0.15 and 0.20) nanoceramics were synthesized through the employment of the glycine nitrate combustion route. The detailed procedure of the synthesis can be found in the cited literature.9 The material compositions for La2Ce2O7, La1.95Yb0.05Ce2O7, La1.90Yb0.10Ce2O7, La1.85Yb0.15Ce2O7, and La1.80Yb0.20Ce2O7 will be represented as LCO, Yb5, Yb10, Yb15, and Yb20, respectively, in the upcoming part of the paper. The phase and purity of the obtained powder (Rigaku, Ultima IV) were examined using the X-ray diffraction (XRD) technique using Cu Kα radiation with a wavelength of 0.15406 nm across a 2θ range of 20–80°. The synthesized powder was uniaxially pressed in a 15 mm strong steel die and sintered for 5 h at 1400 °C with a ramp rate of 3 °C min−1. The study of the fluorite and C-type phases present in the La2−xYbxCe2O7 series were analyzed using Raman spectroscopy. The materials' Raman spectra were captured using a Renishaw InVia Raman spectrometer with a Renishaw RenCam CCD detector and an argon laser excitation source operating at 532 nm. The surface morphology was inspected using a scanning electron microscope (Carl Zeiss, SUPRA GEMINI55). An impedance analyzer (IM3570 impedance analyzer, Hikoi, Japan) was used to evaluate the ionic conductivity in moist oxygen (∼3% H2O) from 200 to 700 °C with a signal amplitude of 100 mV. For improved current collection, the sintered electrolyte pellets were brush-coated with a silver paste. The silver paste was then heated at 250 °C for 2 h to evaporate the organics. Impedance spectra are matched with circuit components utilizing Zsimpwin software to glean information about the numerous electrochemical interactions. The anode composition was 60% NiO + 40% La1.95Yb0.05Ce2O7 + starch (20%). The process of electrophoretic deposition was fine-tuned to create a thin and impermeable coating of La1.95Yb0.05Ce2O7 electrolyte on the anode's surface to manufacture fuel electrode-supported SOFCs similar to the ref. 33. The article goes into detail about the various factors including the suspension chemistry that were improved to achieve the production of thin electrolyte films. After the fabrication of the thin film of La1.95Yb0.05Ce2O7 electrolyte followed by sintering at 1450 °C for 5 h, the cathode layer (70% LSCF–30% La1.95Yb0.05Ce2O7) was brush painted on the surface of the dense electrolyte to yield a complete fuel electrode-supported asymmetrical SOFC. High-temperature alumina adhesive paste was used to seal the SOFC devices onto an alumina tube. The electrochemical performances (I–V and impedance tests) of the cells were then evaluated using a CHI660E electrochemical workstation in a lab-made cell testing setup. The electrochemical performance of the cells was evaluated in the temperature range of 600–700 °C with wet H2 and methane as the fuel and static air as the oxidant. DRT analysis was employed to scrutinize the fundamental electrochemical rate limiting mechanisms in the testing conditions of the SOFCs.3. Results and discussion
3.1. Structural characterizations
The X-ray diffraction (XRD) spectra of the La2−xYbxCe2O7 ceramics are presented in Fig. 1a. The diffraction pattern exhibits concurrence with the JCPDS card (JCPDS #04-12-6396), thereby indicating the presence of a distorted cubic fluorite phase. The absence of impurity peaks shows that all of the Yb has been completely doped to the La site. In order to conduct a thorough investigation into the effects of Yb doping, a close-up view of the (111) and (200) crystallographic plane is presented in Fig. 1b. When the smaller ionic radius of Yb3+, measuring at 0.985 Å, is utilized to replace the larger La3+ ion with a radius of 1.16 Å, the resulting peak shift is observed towards higher angles. Ultimately, this phenomenon culminates in a reduction of the unit cell parameter shown in Fig. 1c. La2−xYbxCe2O7 series crystallite sizes were observed to range from 9 to 15 nm on average. It should be emphasised, nonetheless, that the C-type structure in the La2−xYbxCe2O7 series, a crucial phase that influences the electrolyte's total ionic conductivity, is not revealed by the XRD peaks of LCO.9 F and C type phases of La2−xYbxCe2O7 are revealed by Raman spectroscopy in the next section. | ||
| Fig. 1 (a) XRD pattern of the La2−xYbxCe2O7 series calcined at 800 °C, (b) zoomed-in view of the (111) and (200) planes and (c) effect of lattice parameters on the doping of Yb. | ||
In Fig. 2a, the pellets of the La2−xYbxCe2O7 (normalized) Raman spectra are displayed. To examine the structural characteristics of the La2−xYbxCe2O7 series, the peaks were deconvoluted using the Gaussian function to analyze the F and C-type phases. The intensity as well as area of the designated peaks were considered for calculation.32 The Raman spectra typically show four strong peaks at about 578, 450, 361, and 254 cm−1. The oxygen vacancy (O1) and F2g are represented by the first two wide mode peaks at 578 and 450 cm−1, respectively.2,5,9,34 According to the ref. 2, 35 and 36, the oxygen vacancy (O2) and C-type phases are represented by the peaks at 361 and 254 cm−1, respectively. According to certain sources,34,37,38 the determination of the oxygen defect concentration in ceria-based materials can be explained by the area of peak O1 (578 cm−1) and F2g (450 cm−1). In this study, the area of peak O1 (∼578 cm−1) and F2g (∼450 cm−1) will be represented as (A575/A445). The ratio A575/A445 exhibited a decreasing trend until x = 0.10. Subsequent doping of Yb (at x = 0.15 and 0.20) resulted in a very marginal increase, as depicted in Fig. 2b. This suggests that when Yb is doped in LCO, the concentration of oxygen vacancies (O1) falls. The analysis of the oxygen vacancy (O1) peaks at 578 cm−1 holds important consideration; nonetheless, it is equally imperative to consider the peaks at 260 cm−1 (O2) owing to their connection with localized lattice distortions, which can facilitate in understanding the concentration and correlation of defects.39 The calculation was conducted in order to investigate the impact of Yb doping on the 261 cm−1 and 578 cm−1 bands. The designated intensity ratio of O1 and O2, denoted as I260/I575, was utilized for this purpose. It was observed that the intensity ratio of I260/I575 exhibited an initial increase until x = 0.05, followed by a subsequent decrease. However, it should be noted that the ratio I260/I575 for compositions above x = 0.05 still remained higher than that of the pristine LCO, as illustrated in Fig. 2b. The observed data demonstrates that following the introduction of Yb, the band located at 261 cm−1 assumed a position of prominence, surpassing the band situated at 578 cm−1. The biphasic character of Yb doped LCO can be discerned by employing the ratio of the intensity of the fluorite phase (F2g) peak to the intensity of the C type phase (F/C phase). The F/C ratio of Yb-doped LCO has been computed and it has been observed that the F/C ratio increases until x = 0.10, after which the F/C phase ratio decreases (Fig. 2b). Such a modification in the phase composition may potentially impact the ionic conducting properties of the material.
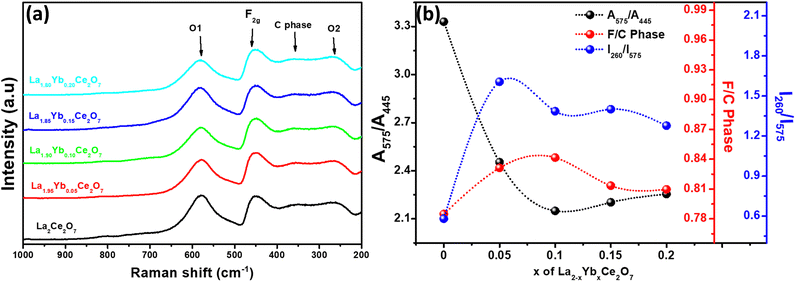 | ||
| Fig. 2 (a) Normalized Raman spectra of La2−xYbxCe2O7 pellets and (b) the effect of Yb doping on the ratio of (A575/A445), I260/I575 and F/C phase. | ||
3.2. Sintering studies
Pellets of La2−xYbxCe2O7 were subjected to sintering in air at a temperature of 1400 °C for a duration of 5 h. The resulting microstructure of the pellets was analyzed through the use of SEM images, as illustrated in Fig. 3(a–e). The SEM images reveal that the La2−xYbxCe2O7 pellets exhibit polygonal configurations, with a noticeably higher degree of densification in their surface morphologies, except for the La1.80Yb0.20Ce2O7 composition. In the case of the La1.80Yb0.20Ce2O7 composition (at x = 20), pores were observed in the microstructure, as shown in Fig. 3e. The determination of the average grain size was carried out through the utilization of ImageJ software. This involved a meticulous consideration of over 100 grains from the microstructures of each composition. Furthermore, as the Yb doping increases, the average grain size decreases, as seen in Fig. 3f. The decelerated diffusion mechanism that occurs across the grain boundaries during the process of sintering may be responsible for the reduction in mean grain sizes in Yb-doped LCO.25,40 It was revealed in a recent work by Ishmil and Han41 that the Yb doping of LCO (La2Ce1.9Yb0.1O7−δ) caused the observation of pores in the microstructure. However, our materials are sintered at 1400 °C, which is 200 °C lower than theirs. They sintered the La2Ce1.9Yb0.1O7−δ at 1600 °C (produced via the solid-state approach).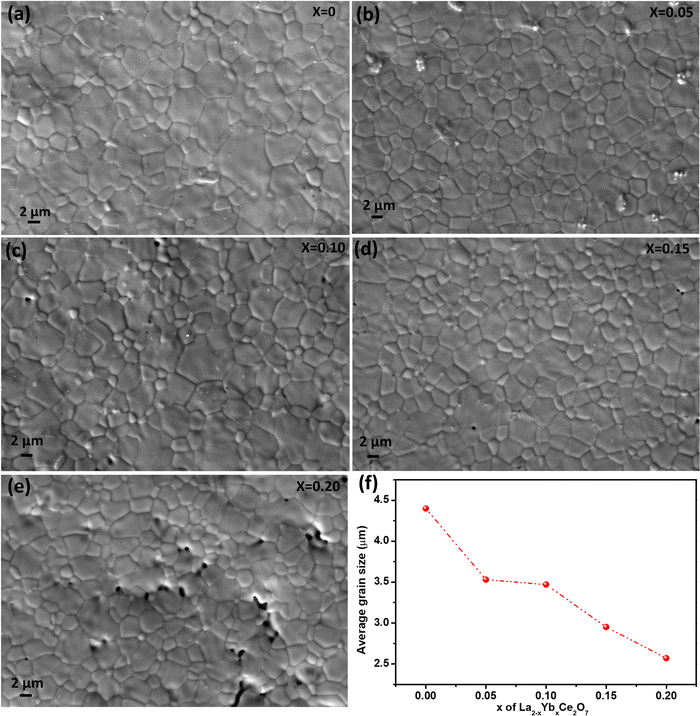 | ||
| Fig. 3 (a)–(e) Surface morphology of La2−xYbxCe2O7 pellets sintered at 1400 °C for 5 h and (f) average grain size against Yb doping level for the LCO. | ||
3.3. Ionic conductivity of La2−xYbxCe2O7 ceramics
The Nyquist plot for the La1.95Yb0.05Ce2O7 system at 700 °C is effectively depicted in Fig. 4, serving as a representative image. The Nyquist plots of the La2−xYbxCe2O7 series were fitted using the circuit element (RQ)(RQ)(RQ), with R representing resistance and Q representing a constant phase element (CPE). The following equation is used to calculate total ionic conductivity: | (1) |
 | (2) |
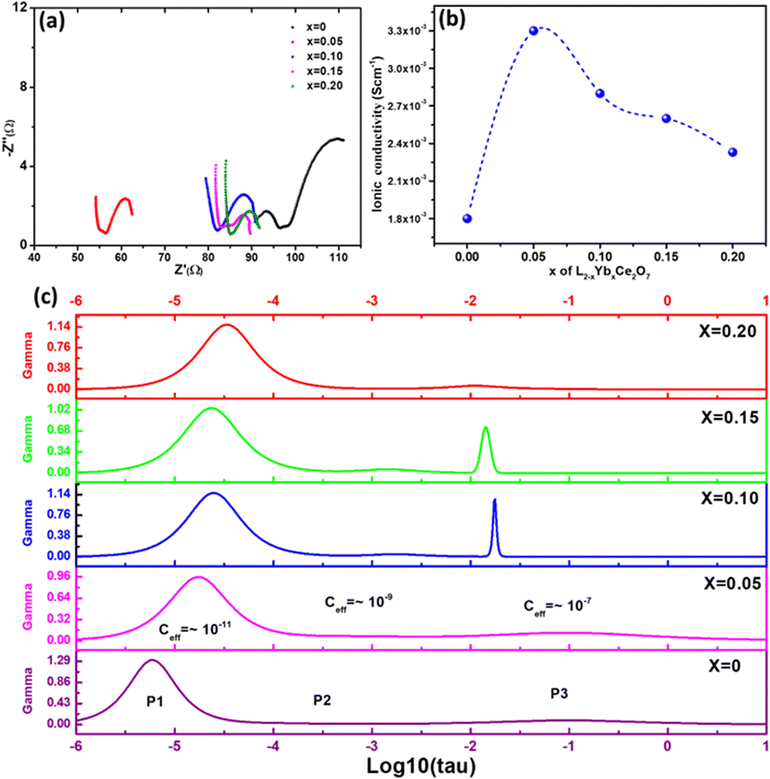 | ||
| Fig. 4 (a) Impedance spectra of the La2−xYbxCe2O7 series in moist oxygen at 700 °C, (b) effect of Yb doping on ionic conductivity and (c) ISGP spectra of the La2−xYbxCe2O7 series at 300 °C. | ||
3.4. EPD of La 1.95 Yb 0.05 Ce 2 O 7 powders
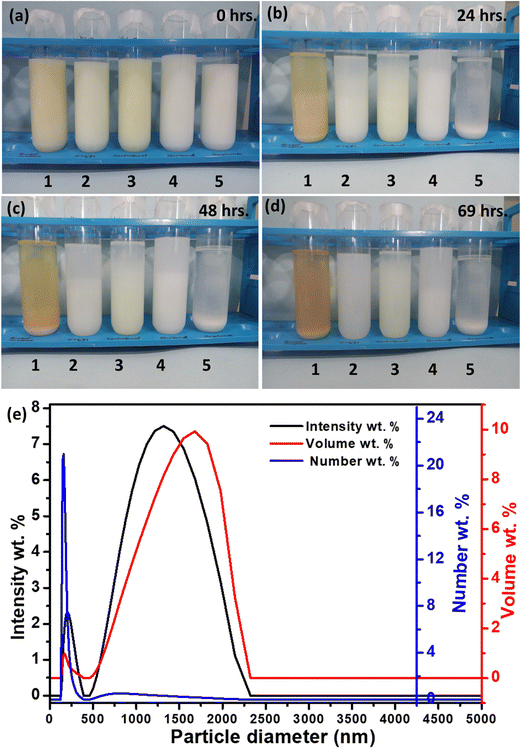
Among the ceramics of La2−xYbxCe2O7, the highest ionic conductivity is exhibited by La1.95Yb0.05Ce2O7 (at x = 0.05). Consequently, it was ultimately selected as the preferred electrolyte for the fabrication of SOFCs. The EPD methodology was employed to produce a thin and compact electrolyte layer on the fuel electrode. To prepare the suspension of La1.95Yb0.05Ce2O7, a 2 wt% La1.95Yb0.05Ce2O7 powder was dispersed in acetylacetone, ethanol, isopropanol, butanol, and acetone. These suspensions were labelled as 1, 2, 3, 4, and 5, respectively, as illustrated in Fig. 6. After a duration of 69 h, the suspensions were evaluated for stability, and it was observed that isopropanol exhibited the highest stability, followed by butanol, ethanol, acetylacetone, and finally acetone (as shown in Fig. 6d). The particle size distribution of the La1.95Yb0.05Ce2O7 suspension in isopropanol is shown in Fig. 6e. The EPD of La1.95Yb0.05Ce2O7 was performed in isopropanol (mean zeta potential = +41.7 mV) by varying the deposition parameters (electrode distance: ∼1.5 cm, time: 45 s to 6 min; and voltage: 40 to 60 V). It was found that 50 V for 4 min of deposition was the ideal deposition condition followed by 5 h of sintering at 1450 °C. The resultant La1.95Yb0.05Ce2O7 film coated by EPD in isopropanol was observed to possess a thin, crack-free, and dense structure. The subsequent section of the paper shall elucidate upon the microstructure of the film. Additional details concerning the preparation and processing of the suspension may be obtained from the ESI.†3.5. Microstructure and electrochemical performance
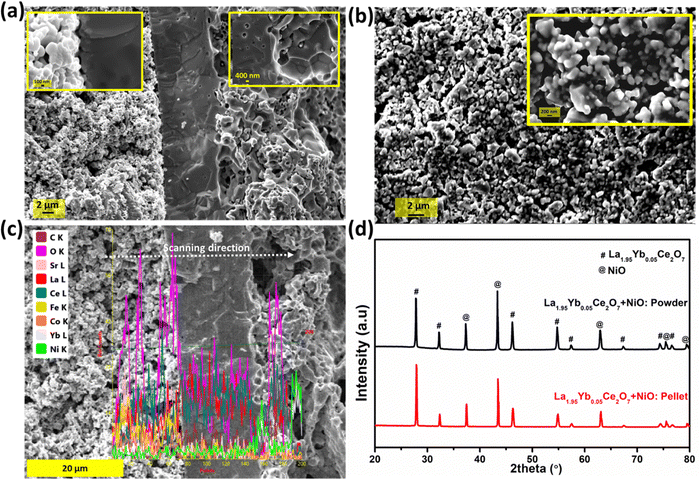
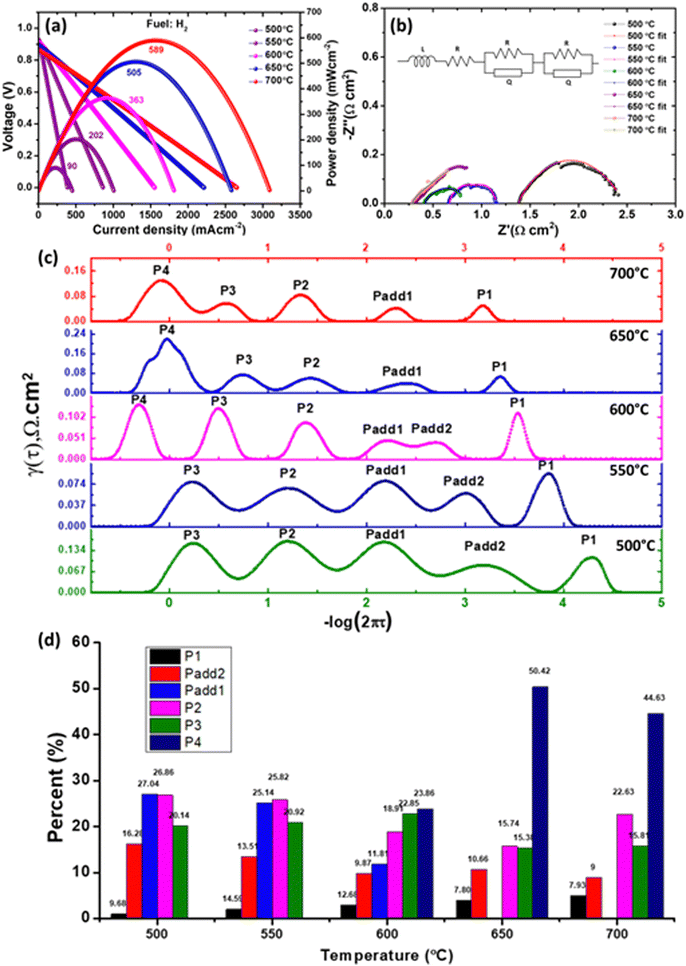
The thickness of the cell's components was calculated to be approx. 35, 14, and 800 μm for the cathode, electrolyte, and anode, respectively. The microstructure of the tested cell (after testing in methane and hydrogen fuel and stability test) is shown in Fig. 7a. After sintering at 1450 °C for 5 h, the electrophoretically deposited La1.95Yb0.05Ce2O7 electrolyte was dense and adherent to the anode, as illustrated in Fig. 7a. The interface between anode and electrolyte is depicted in the inset image of Fig. 7a (right side), demonstrating that no cracks or delamination were observed following testing in both H2 & CH4 fuels, as well as short-term stability testing. Similarly, it was observed that the interface existing between the cathode and electrolyte was devoid of any cracks, as can be seen from the left inset image of Fig. 7a. Nonetheless, it is evident that the cathode layer was not entirely integral to the electrolyte layer (Fig. S3, ESI†). Thus, it can be observed that the triple phase boundary (TPB) existing between the cathode and electrolyte is comparatively less as compared to the TPB existing between the anode and electrolyte. The porosity calculated from the microstructure of the cathode (Fig. 7b) was approx. 28%. Fig. 7c depicts the elemental line mapping of the evaluated cell. Notably, no new phases or elemental reactions occurred during the course of the testing or sintering during cell fabrication. In addition, reactivity between the NiO and La1.95Yb0.05Ce2O7 (after sintering at 1450 °C for 5 h) was also checked using XRD. Fig. 7d clearly illustrates that the distinct phase of La1.95Yb0.05Ce2O7 and cubic NiO phase (JCPDS 47-1049) were formed without any reactions between them.The electrochemical behavior of the cell was evaluated within the temperature spectrum of 500–700 °C, utilizing a moist hydrogen fuel with a water content of approximately 3%, while static air was employed as the oxidizing agent. The maximum power density (MPD) generated by cell [Ni–La1.95Yb0.05Ce2O7 (anode)//La1.95Yb0.05Ce2O7 (electrolyte)//LSCF + La1.95Yb0.05Ce2O7 (cathode)] was 589, 505, 363, 202 and 90 mW cm−2 at 700, 650, 600, 550, and 500 °C, respectively. The MPD of this study is well comparable with the LCO and BZCY-based electrolyte.5,26,50,52–54 This research demonstrates enhancement in MPD when compared to the La1.85Y0.15Ce2O7 electrolyte-based SOFC.31 However, it should be noted that some literatures have reported high performances, which are based on doped LCO; for example, Zhang et al.1 achieved the MPD of 1031 mW cm−2 at 700 °C and Wu et al.8 reported the MPD of 897 mW cm−2 at 700 °C by utilizing La1.85Mg0.15Ce2O7−δ electrolyte.
Under the testing conditions for the fuel cell, the open circuit voltage (OCV) obtained was recorded as 0.866, 0.89, 0.915, 0.927 and 0.927 V at temperatures of 700, 650, 600, 550, and 500 °C, respectively. The present study reveals an observed improvement in the OCV value when high-performance devices are compared.1,8 However, the potential for further enhancement of OCV exists through anode composition modification. As an example, Ling et al.53 have demonstrated an increase in OCV from 0.92 V to 1.0 V through the utilization of NiO–BaZr0.1Ce0.7Y0.2O3−δ as an anode instead of NiO–LCO. This improvement was attributed to the development of a proton conducting phase at the interface between the anode and electrolyte, which represents a promising area for future study. However, these OCV values were found to be lower than the theoretical values. This discrepancy is attributed to the electronic leakage in the LCO-based electrolytes, which occurs due to the reduction of Ce4+ to Ce3+ under reducing atmospheres.7 This suggested that a rise in the temperature of the testing medium results in a decline in ionic transportation. This decrease can be attributed to the higher mobility of holes and proton dehydration in the structure.50 This phenomenon also extends a possible explanation for the decrease in the OCV value. We performed an EIS of the cell under OCV conditions to isolate the resistance contribution (ohmic resistance, Ro; polarization resistance, RP) in the constructed cell. The EIS of the cell tested in the 500–700 °C range is shown in Fig. 8b. The cell's Ro was calculated to be 0.28, 0.32, 0.40, 0.59, and 1.33 Ω cm2 at 700, 650, 600, 550, and 500 °C, respectively, while the Rp was calculated to be 0.82, 0.76, 0.43, 0.62, and 1.14 Ω cm2 at 700, 650, 600, 550, and 500 °C, respectively. It was strange to note that Rp calculated at 700 and 650 °C was higher than that calculated at 600 and 550 °C. From EIS, the size of the low frequency arc was higher (at 700 and 650 °C), as shown in Fig. S4 (ESI†). The observed phenomenon may be attributed to the destabilization of the cell and electronic leakage in the electrolyte at elevated operating temperatures, specifically at 700 and 650 °C.32 Nevertheless, it is noteworthy that the cell may exhibit stability over prolonged operation, as evidenced by the findings of DiGiuseppe,55 who reported a great reduction in the polarization resistance of LSCF-based cathode after a duration of 1050 h. Furthermore, in order to comprehensively comprehend the polarization contribution of the electrodes in the cell with utmost precision, the utilization of the distribution of relaxation time (DRT) method was implemented.56,57Fig. 8c depicts the DRT curves that were obtained from the impedance spectroscopy data within the temperature range of 500–700 °C. The four peaks found on the DRT curves were labelled as P1–P4 (from high to low frequency). Each peak functions as an indicator of the rate-limiting steps in the electrode reactions, and every peak manifests a distinct variation tendency at diverse testing temperatures. The peak denoted as P1 and Padd2 is fundamentally associated with the anode reactions encompassing hydrogen absorption, dissociation, proton formation, and proton assimilation into the lattice of the electrolyte.6,58 The peak P1 and Padd2 moves to a lower frequency as the testing temperature rises, indicating that the process is thermally active. However, Padd2 disappeared from 650 to 700 °C. The incorporation of O2− in the electrolyte lattice, as evidenced by all DRT curves, could potentially be denoted by Padd1.58 P2 depicts the process of proton diffusion in the cell's air electrode, P3 represents gas diffusion to the anodic and cathodic parts of the cell, and P4 may show the illustrated polarization owing to anodic gas diffusion.6 It is noteworthy to observe that P4 is observed at elevated temperatures. This is attributed to the electrolyte's alteration towards oxide ion dominance over protons beyond the threshold of 600 °C. Consequently, fuel dilution phenomena manifest. From the data presented in Fig. 8d, it is noteworthy to observe that the anodic polarization (P4) resistance was found to be the predominant factor contributing towards the cell's performance above 600 °C of operation. However, it is important to mention that the combined effect of P1 and Padd1 was responsible for nearly half of the overall polarization resistance.
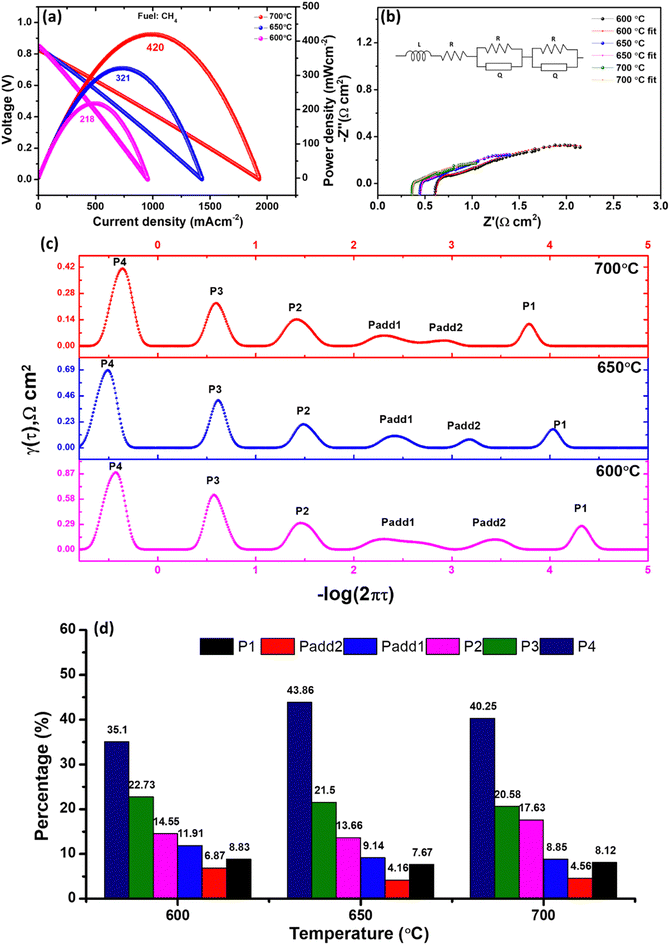
To the best of our knowledge, we are reporting for the first time the utilization of an LCO-based anode in CH4 fuel. The MPD of the cell, as depicted in Fig. 9a, was determined through the utilization of moist methane as a fuel. The MPD values were calculated at different temperatures, namely 700 °C, 650 °C, and 600 °C, and were found to be 420, 321, and 218 mW cm−2, respectively. Also, the OCV values were evaluated at the same temperatures and amounted to 0.83, 0.84, and 0.85 V, respectively. The MPD exhibited in this study can be compared to that of proton conducting SOFCs.58–60 However, there are other studies that have demonstrated high performance in methane fuel. For instance, Konwar et al.61,62 have reported an MPD exceeding 800 mW cm−2 at 600 °C, while Duan et al.17 have reported a power density exceeding 300 mW cm−2 at the same temperature. It is noteworthy that the aforementioned investigations were conducted under conditions of reduced methane concentration or with the inclusion of an extra catalyst layer to augment performance and mitigate coking; however, in our experimentation, no supplementary catalyst layer was incorporated. Apart from Ni in the anode, La1.95Yb0.05Ce2O7 is believed to be an excellent catalyst for methane according to the study performed by Zhao et al.24 The Ro of the cell from the impedance spectra (Fig. 9b) was calculated to be 0.358, 0.43 and 0.57 Ω cm2 at 700, 650, and 600 °C, respectively, whereas Rp was calculated to be 1.52, 2.66 and 2.88 Ω cm2 at 700, 650, and 600 °C, respectively. The DRT spectra are shown in Fig. 9c. Here, internal reforming of methane was taking place at the fuel electrode to produce syngas according to the following equations:
| CH4 + 2H2O → CO2 + 4H2 | (3) |
| CH4 + H2O → CO + 3H2 | (4) |
An additional rate limiting step was formed Padd1 (Padd1 splits from 650 °C) in DRT at 600 °C. Fig. 9d illustrates the polarization resistance in percentage and it can be noticed that almost 50% of the polarization contribution was from electrode gas diffusion processes. Therefore, engineering the interface along with the catalyst layer (externally or internally) on the cell is a futuristic study to reduce the electrode gas diffusion resistance.
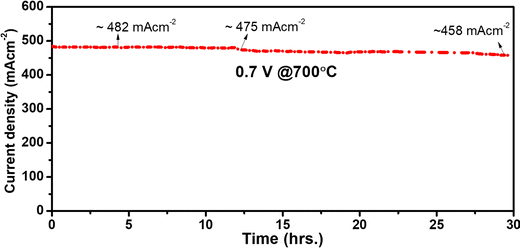
The short-term stability test was carried out in moist hydrogen at 700 °C, as illustrated in Fig. 10. Initially, the cell appears to be stable for up to 12 h with a steady current density (482 mA cm−2). After 12 h, the current density drops from 482 to 475 mA cm−2, and after 30 h, the current density drops to 458 mA cm−2. At 700 °C, the electrochemical performance dropped by 5% after 30 h of operation.
4. Conclusions
The crystal structure and phases present in the Yb-doped La2Ce2O7 were studied extensively using X-ray diffraction and Raman spectroscopy to reveal its dual phase character F-type and C-type phase. Doping affects the dual phases in the system. The ionic conductivity and space charge potential of the Yb-doped La2Ce2O7 were studied and at x = 0.05 it showed the highest ionic conductivity of 3.3 × 10⁻³ S cm−1 at 700 °C. The La1.95Yb0.05Ce2O7 film coated by EPD in isopropanol was established with a crack-free and dense coating with a thickness of approx. 14 μm. The MPDs in hydrogen fuel generated by the cell were 589, 505, 363, 202 and 90 mW cm−2 at 700, 650, 600, 550, and 500 °C, respectively. In moist methane as a fuel, the MPD reached a value of 420, 321, and 218 mW cm−2 at 700, 650, and 600 °C, respectively. DRT analysis using Impedance spectra analysis suggests that the gas diffusion process in the electrodes contributes greatly to the total polarization of the cell. Therefore, the manipulation of the interface coupled with the catalyst layer (either externally or internally) on the cell is a prospective area of research aimed at mitigating the resistance to the diffusion of electrode gases.Conflicts of interest
There are no conflicts to declare.Acknowledgements
Director, CSIR-IMMT is acknowledged for consistent support and encouragement. The authors acknowledge financial support from CSIR India. The authors also acknowledge the Central Characterization Cell and Hydro-Electro Metallurgy of CSIR-IMMT for characterization facilities. The authors would like to extend their gratitude to Dr Laxmidhar Besra for providing the coating facility.References
- M. Zhang, D. Wang, L. Miao, Z. Jin, K. Dong and W. Liu, Electrochem. Commun., 2021, 107026 CrossRef CAS.
- J. Zamudio-Garcia, L. dos Santos-Gomez, J. M. Porras-Vázquez, E. R. Losilla and D. Marrero-Lopez, J. Alloys Compd., 2020, 816, 152600 CrossRef CAS.
- W. Sun, S. Fang, L. Yan and W. Liu, Fuel Cells, 2012, 12, 457–463 CrossRef CAS.
- S. A. Ismail, L. Jiang, P. Zhong, T. Norby and D. Han, J. Alloys Compd., 2022, 899, 163306 CrossRef CAS.
- T. Tu, B. Zhang, J. Liu, K. Wu and K. Peng, Electrochim. Acta, 2018, 283, 1366–1374 CrossRef CAS.
- X. Wang, Z. Ma, T. Zhang, J. Kang, X. Ou, P. Feng, S. Wang, F. Zhou and Y. Ling, ACS Appl. Mater. Interfaces, 2018, 10, 35047–35059 CrossRef CAS PubMed.
- B. Choudhary, L. Besra, S. Anwar and S. Anwar, Int. J. Hydrogen Energy, 2023, 48, 28460–28501 CrossRef CAS.
- Y. Wu, Z. Gong, J. Hou, L. Miao, H. Tang and W. Liu, Int. J. Hydrogen Energy, 2019, 44, 13835–13842 CrossRef CAS.
- B. Choudhary, S. Anwar, D. A. Medvedev, L. Besra and S. Anwar, Ceram. Int., 2022, 48, 6758–6766 CrossRef CAS.
- J. Li, C. Wang, X. Wang and L. Bi, Electrochem. Commun., 2020, 112, 106672 CrossRef CAS.
- F. J. A. Loureiro, N. Nasani, G. S. Reddy, N. R. Munirathnam and D. P. Fagg, J. Power Sources, 2019, 438, 226991 CrossRef CAS.
- Z. Cao, L. Fan, G. Zhang, K. Shao, C. He, Q. Zhang, Z. Lv and B. Zhu, Catal. Today, 2019, 330, 217–221 CrossRef CAS.
- L. Yu, J. Huang, Y. Li, Y. Jing, K. Maliutina, R. Ma and L. Fan, Ceram. Int., 2021, 47, 16956–16963 CrossRef CAS.
- L. Fan, B. Zhu, P.-C. Su and C. He, Nano Energy, 2018, 45, 148–176 CrossRef CAS.
- W. Bian, W. Wu, B. Wang, W. Tang, M. Zhou, C. Jin, H. Ding, W. Fan, Y. Dong, J. Li and D. Ding, Nature, 2022, 604, 479–485 CrossRef CAS PubMed.
- Z. Tao, M. Fu, Y. Liu, Y. Gao, H. Tong, W. Hu, L. Lei and L. Bi, Int. J. Hydrogen Energy, 2022, 47, 1947–1953 CrossRef CAS.
- C. Duan, R. J. Kee, H. Zhu, C. Karakaya, Y. Chen, S. Ricote, A. Jarry, E. J. Crumlin, D. Hook and R. Braun, Nature, 2018, 557, 217–222 CrossRef CAS PubMed.
- L. Yang, S. Wang, K. Blinn, M. Liu, Z. Liu, Z. Cheng and M. Liu, Science, 2009, 326, 126–129 CrossRef CAS PubMed.
- Z. Zhu, B. Liu, J. Shen, Y. Lou and Y. Ji, J. Alloys Compd., 2016, 659, 232–239 CrossRef CAS.
- J. Xu, Y. Zhang, X. Xu, X. Fang, R. Xi, Y. Liu, R. Zheng and X. Wang, ACS Catal., 2019, 9, 4030–4045 CrossRef CAS.
- J. Xu, L. Peng, X. Fang, Z. Fu, W. Liu, X. Xu, H. Peng, R. Zheng and X. Wang, Appl. Catal., A, 2018, 552, 117–128 CrossRef CAS.
- J. Wang, F. Liu, J. Wu, S. Zou and J. Fan, Catal. Sci. Technol., 2023, 13, 2493–2499 RSC.
- R. Singh Pal, S. Rana, S. Kumar Sharma, R. Khatun, D. Khurana, T. Suvra Khan, M. Kumar Poddar, R. Sharma and R. Bal, Chem. Eng. J., 2023, 458, 141379 CrossRef CAS.
- J. Zhao, X. Xu, W. Zhou, I. Blakey, S. Liu and Z. Zhu, ACS Appl. Mater. Interfaces, 2017, 9, 33758–33765 CrossRef CAS PubMed.
- B. Zhang, Z. Zhong, T. Tu, K. Wu and K. Peng, J. Power Sources, 2019, 412, 631–639 CrossRef CAS.
- T. Tu, J. Liu and K. Peng, Ceram. Int., 2017, 43, 16384–16390 CrossRef CAS.
- S. Hu, W. Li, H. Finklea and X. Liu, Adv. Colloid Interface Sci., 2020, 276, 102102 CrossRef CAS PubMed.
- L. Besra and M. Liu, Prog. Mater. Sci., 2007, 52, 1–61 CrossRef CAS.
- E. Y. Pikalova and E. Kalinina, Renewable Sustainable Energy Rev., 2019, 116, 109440 CrossRef.
- B. Choudhary and S. Anwar, Solid State Ionics, 2023, 401, 116356 CrossRef CAS.
- B. Choudhary, K. S. Dash, S. Anwar, L. Besra and S. Anwar, J. Power Sources, 2023, 583, 233543 CrossRef CAS.
- B. Choudhary and S. Anwar, ACS Appl. Energy Mater., 2023, 6, 11817–11827 CrossRef CAS.
- B. Choudhary, S. Anwar, L. Besra and S. Anwar, Int. J. Appl. Ceram. Technol., 2019, 16, 1022–1031 CrossRef CAS.
- Y. Xu, F. Wang, X. Liu, Y. Liu, M. Luo, B. Teng, M. Fan and X. Liu, J. Phys. Chem. C, 2019, 123, 18889–18894 CrossRef CAS.
- K. Singh, R. Kumar and A. Chowdhury, Ultrason. Sonochem., 2017, 36, 182–190 CrossRef CAS PubMed.
- A. Nakajima, A. Yoshihara and M. Ishigame, Phys. Rev. B: Condens. Matter Mater. Phys., 1994, 50, 13297–13307 CrossRef CAS PubMed.
- Z.-Y. Pu, X.-S. Liu, A.-P. Jia, Y.-L. Xie, J.-Q. Lu and M.-F. Luo, J. Phys. Chem. C, 2008, 112, 15045–15051 CrossRef CAS.
- Z.-Y. Pu, J.-Q. Lu, M.-F. Luo and Y.-L. Xie, J. Phys. Chem. C, 2007, 111, 18695–18702 CrossRef CAS.
- R. Schmitt, A. Nenning, O. Kraynis, R. Korobko, A. I. Frenkel, I. Lubomirsky, S. M. Haile and J. L. M. Rupp, Chem. Soc. Rev., 2020, 49, 554–592 RSC.
- M. Amsif, D. Marrero-Lopez, J. C. Ruiz-Morales, S. N. Savvin, M. Gabás and P. Nunez, J. Power Sources, 2011, 196, 3461–3469 CrossRef CAS.
- S. A. Ismail and D. Han, J. Am. Ceram. Soc., 2022, 105, 7548–7557 CrossRef CAS.
- S. Hershkovitz, S. Baltianski and Y. Tsur, Solid State Ionics, 2011, 188, 104–109 CrossRef CAS.
- T. Paul, N. Yavo, I. Lubomirsky and Y. Tsur, Solid State Ionics, 2019, 331, 18–21 CrossRef CAS.
- T. Paul and Y. Tsur, Solid State Ionics, 2018, 323, 37–43 CrossRef CAS.
- A. K. Baral and Y. Tsur, Solid State Ionics, 2017, 304, 145–149 CrossRef CAS.
- A. K. Baral and Y. Tsur, J. Am. Ceram. Soc., 2019, 102, 239–250 CrossRef CAS.
- D. R. Clark, H. Zhu, D. R. Diercks, S. Ricote, R. J. Kee, A. Almansoori, B. P. Gorman and R. P. O’Hayre, Nano Lett., 2016, 16, 6924–6930 CrossRef CAS PubMed.
- C.-T. Chen, C. E. Danel and S. Kim, J. Mater. Chem., 2011, 21, 5435–5442 RSC.
- M. F. Yan, R. M. Cannon and H. K. Bowen, J. Appl. Phys., 1983, 54, 764–778 CrossRef CAS.
- Z. Wang, L. Ding, S. Yu, H. Xu, X. Hao, Y. Sun and T. He, ACS Appl. Energy Mater., 2022, 5, 3369–3379 CrossRef CAS.
- R. Guo, D. Li, R. Guan, D. Kong, Z. Cui, Z. Zhou and T. He, ACS Sustainable Chem. Eng., 2022, 10, 5352–5362 CrossRef CAS.
- H. Shimada, T. Yamaguchi, H. Sumi, Y. Yamaguchi, K. Nomura, Y. Mizutani and Y. Fujishiro, ACS Appl. Energy Mater., 2018, 2, 587–597 CrossRef.
- Y. Ling, J. Chen, Z. Wang, C. Xia, R. Peng and Y. Lu, Int. J. Hydrogen Energy, 2013, 38, 7430–7437 CrossRef CAS.
- N. Nasani, D. Ramasamy, S. Mikhalev, A. V. Kovalevsky and D. P. Fagg, J. Power Sources, 2015, 278, 582–589 CrossRef CAS.
- G. DiGiuseppe, Ionics, 2023, 1–8 Search PubMed.
- T. H. Wan, M. Saccoccio, C. Chen and F. Ciucci, Electrochim. Acta, 2015, 184, 483–499 CrossRef CAS.
- F. Ciucci and C. Chen, Electrochim. Acta, 2015, 167, 439–454 CrossRef CAS.
- N. Shi, F. Su, D. Huan, Y. Xie, J. Lin, W. Tan, R. Peng, C. Xia, C. Chen and Y. Lu, J. Mater. Chem. A, 2017, 5, 19664–19671 RSC.
- L. Lei, J. M. Keels, Z. Tao, J. Zhang and F. Chen, Appl. Energy, 2018, 224, 280–288 CrossRef CAS.
- D. Konwar, N. T. Q. Nguyen and H. H. Yoon, Int. J. Hydrogen Energy, 2015, 40, 11651–11658 CrossRef CAS.
- D. Konwar, B. J. Park, P. Basumatary and H. H. Yoon, J. Power Sources, 2017, 353, 254–259 CrossRef CAS.
- D. Konwar and H. H. Yoon, J. Mater. Chem. A, 2016, 4, 5102–5106 RSC.
Footnote |
| † Electronic supplementary information (ESI) available. See DOI: https://doi.org/10.1039/d3ma00739a |
| This journal is © The Royal Society of Chemistry 2024 |


