 Open Access Article
Creative Commons Attribution 3.0 Unported Licence
Mica nanosheets synthesized via liquid Ga embrittlement: demonstrating enhanced CO2 capture†
P. Vishakha T.
Weerasinghe
a,
Shunnian
Wu
a,
W.P. Cathie
Lee
a,
Qiang
Zhu
 b,
Ming
Lin
 b and
Ping
Wu
 *a
*a
aEntropic Interface Group, Engineering Product Development, Singapore University Technology and Design, Singapore. E-mail: wuping@sutd.edu.sg
bInstitute of Materials Research and Engineering (IMRE), A*STAR (Agency for Science, Technology and Research), 2 Fusionopolis Way, Singapore 138634, Singapore
First published on 6th December 2023
Abstract
We introduce a pioneering approach to synthesize 2D mica nanosheets by leveraging the liquid gallium embrittlement mechanism, effectively addressing the challenges involved in exfoliating mica due to its strong non-van-der-Waals bonds. To gain insights into the underlying mechanisms, including energy barrier determination in liquid metal embrittlement and biaxial straining, and to provide valuable guidance for designing 2D nanosheet synthesis, we propose an integrated model that incorporates first-principles calculations, biaxial straining principles, and experimental design. Our experimental findings demonstrate the successful exfoliation of mica nanosheets with lateral dimensions ranging from 100 to 300 nm and thicknesses ranging from 1 to 15 nm. Remarkably, we found a significant reduction in resistance, from 50 ± 8 MΩ for natural mica to 28 ± 10 MΩ for Ga-intercalated mica. Moreover, when compared to natural mica, these 2D mica nanosheets exhibit a remarkable 76% enhancement in CO2 capture efficiency. This work advances the synthesis of 2D materials and contributes to a comprehensive understanding and effective management of liquid metal embrittlement phenomena, paving the way for a groundbreaking approach to 2D structure synthesis.
Introduction
Two-dimensional (2D) materials have gained increasing attention since the discovery of graphene in 2004.1 Most of these 2D materials are often formed by exfoliating the corresponding three-dimensional (3D) bulk, where the crystal planes are held together by weak van der Waals forces. However, the strict requirement of van der Waals nature confines a library of 2D materials, excluding the vast majority of industrially viable and commercially utilized materials. Thus, a new and diverse class of 2D materials is emerging from non-van der Waals (non-vdW) 2D solids.22D mica sheets are a fascinating material obtained through the exfoliation of their bulk counterpart, which naturally exists as a 3D non-van der Waals layered material. These 2D mica sheets outperform graphene as an anticorrosive agent.3 Mica is also used in many other fields, such as cell growth,4 electron tunneling devices,5 flexible and transparent devices6 and CO2 capture7 and separation.8 The present study focuses on muscovite mica (KAl3Si3O10·(OH)2), whose chemical structure is represented by an octahedral layer of alumina sandwiched between two identical tetrahedral layers of silica, separated by a layer of potassium ions. This results in strong Coulombic interactions between neighboring layers, making the exfoliation process challenging. Some reported techniques for mica exfoliation include liquid phase exfoliation using ions’ or molecules’ intercalation followed by sonication,3,5,6,8–10 as well as mechanical exfoliation using scotch tape. However, these current exfoliation approaches often require difficult experimental setups, hazardous chemical reagents, excessive energy consumption, or lengthy processing times. Therefore, there is a need for a scalable method to produce mica nanosheets of high quality.
Liquid-metal embrittlement (LME) happens when intrinsically ductile metals, such as Al, Ni, and Cu, contact with liquid metals (LM) such as Ga and Bi, which brings about intergranular failure with exceptionally dramatic stress loss. The mechanism consists of two basic steps: (1) crack initiation at the site of contact between the aggressive liquid metal and the solid sample, and (2) rapid crack propagation along grain boundaries.11 LME has raised concern due to liquid metal-induced damage in aircraft,12 nuclear reactors, and the corrosion and embrittlement caused by a liquid alloy.13 There have been incidents like the Flixborough damage caused by molten zinc on stainless steel.14 In this work, we take advantage of the properties of LME to exfoliate layer-structured materials in spite of these negative consequences.
Although there are several models that attempt to explain LME, a comprehensive understanding of its fundamental mechanisms is still unattainable. Among the models that are currently used are the Reduction in Surface Energy (RSE) model, the Adsorption Induced Reduction in Cohesion Model (AIRCM), the Enhanced Dislocation Emission (EDE) Model, and the Dissolution-Condensation Mechanism (DCM).15 These models were developed through computational or experimental means. First-principles calculations have been used to describe LME phenomena at the atomic scale for solid materials such as steel, Mg, Al, Ti and their alloys with liquid metals such as Hg, Ga, Bi, Pb, Sn, Zn and Cd through interatomic bonding energy, solubility, vacancy formation, and intermetallic formation.16 However, the challenge is determining the occurrence of embrittlement for a particular solid–liquid metal element system under specific test conditions, which is known as the specificity of LME.17
Here, we examined the main factor influencing the specificity of LME for a Ga–mica system using first-principles calculations for the first time. By incorporating these calculated results and biaxial straining principles, we propose a novel model for fast crack propagation in layered materials via LME. We evaluated the exfoliation ability based on LME through experiments. The exfoliated mica via Ga intercalation is comprehensively characterized in terms of morphology, elemental composition, and electrical resistivity, suggesting a viable approach for the scalable exfoliation of 2D nanosheets. Additionally, we assess the CO2 capture performance, demonstrating the applicability of Ga-intercalated mica nanosheets for CO2 capture.
Materials and methods
Computational simulations
The first-principles calculations were carried out using a periodic supercell model employing the Vienna Ab initio simulation package (VASP)18,19 with the Perdew–Burke–Ernzerhof (PBE) generalized gradient approximation (GGA) exchange–correlation functional.20 A projector augmented wave (PAW) method19,21 was adopted with a 500 eV energy cutoff. The van der Waals (vdW) corrected functional (DFT+D3 correction method22) was incorporated in all mica calculations. A Monkhorst–Pack K-points mesh23 was adopted for sampling the Brillouin zone, where the number of K-points, NK, is adjusted to maintain NK × L (L is the lattice constant) about 45 Å for structural optimization and 75 Å for electronic calculations, respectively. The internal optimization is converged with the force on each atom to be less than 0.01 eV Å−1. The energy convergence with respect to the k-points and cutoff energy has been tested to be less than 0.01 eV per cell.The stable structure of mica has been obtained in our previous work.10 The smallest repeated unit adopted for calculations is the 1 × 1 × 2 supercell containing 84 atoms. One, two and four Ga atoms are gradually introduced into the interlayer of mica in this work, which are denoted as 1ga-mica, 2ga-mica and 4ga-mica, respectively. Their ground configurations were obtained by performing full geometry optimization. Their formation enthalpy Ef is calculated using the equation Ef = 12EAl + 12ESi + 48EO + 8EH + nGaEGa, where nGa is the amount of inserted Ga atoms, EO and EH refer to the energy per atom in O2 and H2 gas, which are the most stable elementary form of O and H under ambient conditions, respectively. EAl, ESi and EGa are energy per atom for metals Al, Si, and Ga, each in the form of its own most stable elementary substance, respectively.
The interlayer spacing is defined as Dint = Zoh − Zol, where Zoh and Zol are the averaged Cartesian z coordinates of three lowest oxygen atoms among the oxygens forming tetrahedrons in the upper sheet and of three highest oxygen atoms among the oxygens forming tetrahedrons in the lower sheet, respectively. To calculate the exfoliation energy Eexf for the mica, their two sheets and one sheet placed in a supercell were constructed and fully optimized to determine their total energy E2L and E1L, respectively.24 The cleavage plane was placed normal to the c axis, and the lattice parameters a and b and β were set as the calculated lattice constants of the corresponding bulk mica. At least 20 Å vacuum to eliminate the impact of periodic boundary conditions is imposed on these mica nanosheets. Half of the interlayer cations were separated on each side of the mica nanosheets surface, with the initial cation position at the center of the corresponding hexagonal tetrahedral ring. Eexf is calculated as Eexf = E2L − 2E1L. To further calculate the exfoliation energy Eexf for the Ga-inserted micas, Ga atoms are placed and removed on up and down one sheet, respectively, which are denoted as E1UG, E1U, E1DG and E1D, and Eexf is calculated as 
Materials and reagents
Natural ground muscovite mica of 99.5% purity was obtained from Huajing mica Co. Ltd (Shijiazhuang City, China). Gallium ingot (99.9999%) was purchased from VWR Singapore Pte Ltd.Ga intercalation assisted mica exfoliation
For exfoliation of ground mica, 4 g of natural mica was first mixed with 0.4 g of Ga using a motor and pestle for 30 minutes. To keep Ga in the liquid state, the temperature of the motor was maintained at about 45 °C using a hot plate. The mixed sample was kept in the oven at 60 °C for 30 minutes. Then, the sample was divided into two equal weights and put into two 100 ml grinding vessels. Grinding was performed in a dry environment using 90 g grinding balls of sizes 3, 5, 10 and 15 mm in Ziconia vessels (Changsha Tianchuang Powder Technology CO., Ltd). The spinning speed of the high energy planetary ball mill was maintained at 600 rpm for 30 minutes. The obtained powder was sonicated (5 s pulse and 2 s rest) for 1 hour using a Q125 Tip Sonicator with a variable power of 0–500 W and a vibration frequency of 20 kHz (Qsonica L.L.C.). The final product was centrifuged at 6000 rpm for 10 min to remove the unexfoliated mica.Instrumental characterization
Mica sheet morphology was evaluated using scanning electron microscopy (SEM) JEOL JSM-7600F coupled with energy dispersive X-ray spectroscopy (EDS) and FEI Titan 80/300 Scanning/Transmission Electron Microscopy (TEM) (200 KV). For electrical resistivity measurements, 4.5 g powder samples were pressed into pellets measuring 13 mm in diameter and 1.4 mm in thickness using a Manual Hydraulic Press (FTIR + XRF Pellet Press, Specac, UK). The resistance between two sides of the cylindrical pallet was measured using two probes (Fluke 289 True- RMS Data Logging Multimeter). The resistance between two faces of the cylindrical pallet was measured using a two probes method (Fluke 289 True-RMS Data Logging Multimeter). CO2 capturing performance was tested using a Thermo Gravimetric Analyzer (TGA, TGA Q50 analyzer, TA Instruments, New Castle, DE, USA). To perform CO2 adsorption TGA analysis, ∼6.5 mg samples were loaded onto a platinum (Pt) pan within the TGA apparatus. To prevent errors arising from pre-adsorbed species, including ambient CO2, water, and other contaminants, the samples underwent pre-treatment at 150 °C for 60 minutes. This pre-treatment was carried out under a high-purity N2 flow rate of 40 mL min−1, with the temperature being raised at a rate of 10 °C min−1. Subsequently, the gas was changed from N2 to pure CO2 (1 atm, 40 ml min−1), while the temperature was gradually lowered to 30 °C at a rate of 10 °C min−1. The sample was then maintained in this 100% CO2 atmosphere for a period of 90 minutes, during which the weight change of the sample was continuously monitored in relation to both temperature and time. The CO2 adsorption capacity can be precisely determined by the measurement of the weight change.Results and discussion
Energy barrier determination via first-principles calculations
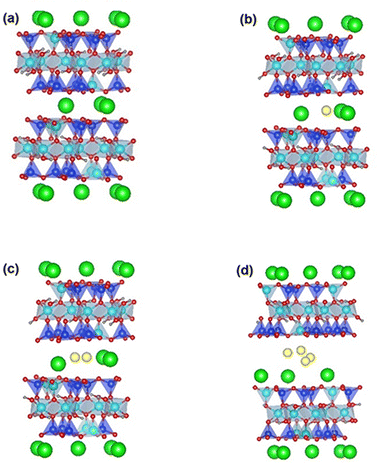
In this phase of the study, we aimed to gain insights into the mechanism underlying Ga-intercalated mica's LME (Layered Mica Expansion). To achieve this, we evaluated the energy barrier related to fracture propagation using first-principle calculations. In particular, our first-principle calculations included two crucial elements:(1) Examining the feasibility of intercalating gallium atoms—namely, one, two, and four gallium atoms, denoted as 1Ga mica, 2Ga mica, and 4Ga mica, respectively (as depicted in Fig. 1).
(2) Determining the energy barrier in the presence of gallium, concentrating on the formation energy of the Ga/mica surface.
First, as shown in Fig. 1, we investigated the viability of intercalating gallium atoms into mica, including one, two, and four gallium atoms, which are referred to 1Ga-mica, 2Ga-mica, and 4Ga-mica, respectively. It was found that the energy required for Ga incorporation decreases significantly with increasing number of Ga atoms inserted into the mica interlayers, which is due to the formation of Ga2 and Ga4 clusters: Ecluster Ga2 − 1.66 eV and Ecluster Ga4 − 0.99 eV (Table 1), where Ecluster = (EnGa-mica − Emica − nEGa)/n with EnGa-mica, Emica and EGa, represents the total energy of mica with inserted Ga, parent mica and Ga, respectively, and n represents the number of inserted Ga. Additionally, the electronic band gap was lowered from 4.92 eV for mica to 0.63 eV for 4Ga-mica by inserting Ga atoms (Table 1).
| E cluster (eV) | E f (eV) | Bandgap (eV) | |
|---|---|---|---|
| Mica | −230.71 | 4.92 | |
| 1Ga-mica | 3.40 | −227.31 | 4.35 |
| 2Ga-mica | 1.66 | −227.38 | 1.25 |
| 4Ga-mica | 0.99 | −226.77 | 0.63 |
We then turned our attention to the formation energy of the Ga/mica surface and proceeded to evaluate the energy barrier in the presence of gallium. According to the Griffith theory,25 crack propagation (Fig. 2(a)) occurs when the reduction in potential energy, which is in the form of strain energy U (Fig. 2(b)), equals or surpasses the increase in surface energy W (Fig. 2(b)) as a result of a crack's expansion. This increase in surface energy is associated with the creation of new free surfaces as the crack spreads.
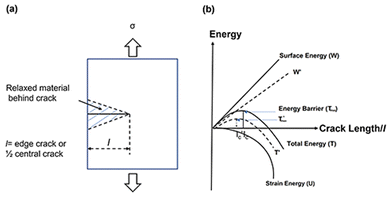 | ||
| Fig. 2 (a) Sketch of a micro edge crack with length l. (b) Schematic illustration of Griffith's theory of energetics of crack propagation. | ||
The critical event of crack propagation occurs when the crack length l reaches lc (Fig. 2(b)), at which point the total energy T (Fig. 2(b)) reaches its maximum value, known as Tmax (Fig. 2(b)). The energy barrier stopping fracture growth is this maximum energy. An unstable state arises from the energy balance between U and W: when U < W, it corresponds to a sealed crack for which the crack length, l < lc. On the other hand, when U ≥ W, it indicates crack growth, where the crack length, l ≥ lc.
In this work, we described a method that lowers surface formation energy in order to speed up fracture propagation. This is accomplished by shifting the mica layers from W to W′ by inserting Ga between them. Therefore, we predict that this strategy will cause the total energy T to change to T′ (depicted in Fig. 2(b)), and the energy barrier Tmax (Fig. 2(b)) may decrease to zero or even become negative ( of Fig. 2(b)). As a result, it is expected that the critical crack length (lc), denoted as
  , will drop (Fig. 2(b)). This reduction in critical crack length is anticipated to facilitate rapid crack propagation when Ga is present.
The formation energy of mica/Ga–mica surfaces is approximated using the formation enthalpies Ef provided in Table 2. Consequently, the decrease in the energy barrier can be quantified by the reduction in the formation energies, as indicated by eqn (1):
| Ef-reduction = Ef(air/mica) − Ef(Ga/mica) | (1) |
| D int (Å) | E exf (eV) | |
|---|---|---|
| Mica | 3.49 | −3.05 |
| 1Ga-mica | 4.56 | −2.72 |
| 2Ga-mica | 5.02 | −2.29 |
| 4Ga-mica | 7.11 | −1.95 |
Additionally, the interaction of Ga between the layers was evaluated by looking at exfoliation energies. Compared to pure mica, it was found that exfoliation energy for 2Ga-mica and 4Ga-mica dropped by 25% and 36%, respectively. Interestingly, when compared to pure mica, the calculated interlayer distances also showed significant increases, expanding by 1.43 times and 2.04 times, respectively.
It may be concluded that the insertion of Ga efficiently promotes the rapid fracture process based on the decrease in the energy barrier, the decreased exfoliation energy, and the increased interlayer spacing.
Biaxial straining model
The analysis of biaxial straining offers crucial information on the underlying mechanisms in the investigation of Ga-inserted mica exfoliation. Applying forces along two perpendicular axes is known as biaxial straining, and it leads to complex deformation behaviour in materials. The Poisson ratio can be used to calculate the material's response to biaxial straining. It helps us better understand the mechanical stability and deformation properties of Ga-inserted mica.Subsequently, the lattice parameters of all studied mica samples were determined through first principles calculations using density functional theory (DFT) and the results from the calculations are summarized in Table 3. Assuming that the loading force is perpendicular to the ab plane, Table 3 lists the strains in three directions εa, εb, and εc, and Poisson ratio va and vb calculated using the lattice parameters. Table 3 illustrates that the intercalation of 1Ga atom, 2Ga atoms and 4Ga atoms all bring about positive tensile strain εc, hence validating our assumption of the loading force direction. This agrees with the determined Poisson ratio va and vb, which indicates the degree of deformation of an object in the direction perpendicular to the loading force. It has been observed that the Poisson ratio decreases with an increase in the number of intercalated Ga atoms.
According to a theory established by our group, strain entropy is the driving force behind the exfoliation of non-van-der-Waals crystals, as delineated by eqn (2).26,27
 | (2) |
Wu et al.28 conducted a theoretical study wherein they examined the thermodynamic aspects of entropy modification resulting from mechanical loading. This concept was validated through experiments conducted by Wu and Tan et al.,28,29 which involved surface wetting measurements on NiTi thin films. They introduced eqn (2) to describe the stress–strain nonlinear deformation from entropy changes on the surface. Therefore, eqn (2) can be understood as a cubic polynomial denoted as Δθ(ε) = ΔS + Aε + Bε2 + Cε3, in which θ represents the water contact angle. According to Young's equation, this angle depends on surface tension, which is affected by surface straining.
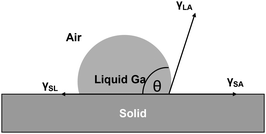
The (1 − ν)M term constitutes a component of coefficient C. Both M and (1 − ν) increase as the number of inserted Ga atoms rises. Table 3 demonstrates that (1 − ν)M increases by 26% with the insertion of Ga atoms, progressing from 1Ga to 4Ga. A larger value of (1 − ν)M leads to significant alterations in the cubic component of eqn (2), implying that the entropy contribution from phonon–phonon interactions is likely to play a dominant role. Consequently, this improves the contact angle of intercalated Ga between the layers. An increased contact angle augments the driving force for layer separation, which is the vertical component of the surface tension (γLVsinθ) of Ga, as depicted in Fig. 3. As a result, this promotes the detachment of surface mica layers from the bulk particle. An even higher stress is induced in the vertical direction, as indicated by the significant increase in γLVsinθ due to the dominance of the cubic term ε3 in eqn (2). This escalation ultimately reaches a tensile threshold, causing layer exfoliation through primary bond breakage.
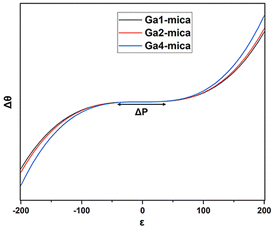
As a measure of the biaxial straining impact that is represented by the quadratic and cubic terms in eqn (2), the extent of the plateau region (illustrated in Fig. 4) can be denoted as ΔP. This value is computed as the difference between P1 and P2. P1 and P2 refer to the strain values at which the first derivative of θ(ε) with respect to ε becomes zero, as determined using eqn (3):
 | (3) |
By substituting the coefficients of eqn (3) in eqn (4), we obtain:
 | (4) |
The extent of the plateau zone (eqn (5)) can be calculated using ΔP = P2 − P1:
 | (5) |
Hence, the lower threshold for this non-linear shift, ranging from 1Ga to 4Ga, suggests a faster transition from electron–electron interactions to interactions involving both electrons and phonons. This occurs at a significantly reduced level of strain. Consequently, there is an abrupt and non-linear rise in the stress at this lower strain point, thereby fostering rapid crack propagation under biaxial straining in the presence of Ga. In the end, this phenomenon facilitates mica exfoliation by accelerating the detachment of surface layers from the larger particle.
Experiments involving liquid metal embrittlement of mica by gallium
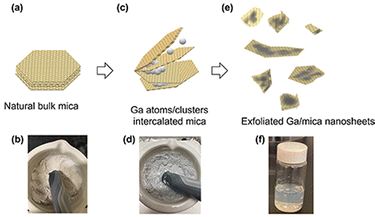
To validate the results of our first-principles calculations and biaxial straining principles, we conducted an experimental study in which Ga was intercalated into natural bulk mica. The schematic illustration shows bulk mica (Fig. 5(a) and (b)) and Ga immersion between mica layers (Fig. 5(c) and (d)).The initial insertion of Ga atoms between mica layers was propelled by mechanical forces employed during the ball milling process. According to our DFT calculations, injecting Ga clusters rather than individual atoms is preferable. The insertion of Ga induces biaxial strain in the mica layers, leading to a higher contact angle of the inserted Ga clusters. This, in turn, promotes rapid layer expansion. Simultaneously, the expanded mica layers can be further separated by applying continuous shear force, achieved by keeping the ball milling speed at 600 rpm for 30 min. In addition to the shear force, a compressive force can also be applied to the separated thin mica layers, which also results in thin layers that are smaller in lateral size. After ball milling for 30 minutes, the aggregated mica thin sheets were further separated into individual layers through sonication. Then, the non-exfoliated particles were separated from the sonicated sample by centrifugation at 6000 rpm for 10 minutes, resulting in exfoliated Ga/mica nanosheet composites (Fig. 5(e) and (f)).
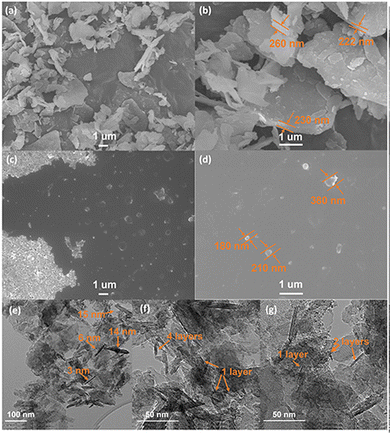
Fig. 6(a) shows the alumina silicate layers of natural mica with an average particle diameter of 2.07 ± 0.70 μm, containing hundreds of layers. The magnified image of the natural mica as shown in Fig. 6(b) provides quantitative thickness information with an average thickness of 293.37 ± 164.20 nm. Exfoliated Ga/mica nanosheet composites show a sheet-like structure with a uniform size in the range of 100–300 nm in width (Fig. 6(c) and (d)). Magnified TEM images of single and few layered nanosheets show a thickness of 1–15 nm (Fig. 6(e)–(g)). The presence of Ga in mica was confirmed by EDS elemental mapping, as shown in Fig. S1 and S2 (ESI†), where the surface atomic percentages of Ga are 0% and 2.1%, Al are 8.1% and 9.4%, Si are 9.5% and 11.3%, O are 79.9% and 74.2%, K are 2.5% and 3.0% for natural bulk mica and the exfoliated Ga/mica nanosheet composite, respectively (S1, ESI†).
Electrical resistance of exfoliated mica
DFT calculations have revealed that the band gap of mica is lowered by the insertion of Ga. This decrease in the electronic band gap facilitates the transition of valence electrons into conduction electrons, acting as charge carriers, thereby enhancing electric current conduction and reducing electrical resistance.In this study, the measured electrical resistance of cylindrical powder dies made from natural mica and Ga-intercalated mica was found to be 50 ± 8 MΩ and 28 ± 10 MΩ, respectively. This twofold decrease in resistance aligns with the reduction in the band gap from 4.92 eV to 1.25 eV and 0.63 eV for Ga2 and Ga4 clusters, respectively. Despite fixing the amount of added Ga at 10 wt% of the total mica, corresponding to an atomic fraction of 50%, the atomic surface fraction obtained from EDS only indicates a 2% atomic fraction for Ga. This discrepancy could be attributed to Ga incorporation into the interlayers of mica rather than on its surface. Schematic diagrams in Fig. 7 illustrate various ways Ga can be incorporated into mica: (1) continuous deposition as a thin film on the mica surface (Fig. 7(a)), (2) discontinuous deposition as a thin film on the mica surface (Fig. 7(b)), and (3) immersion of Ga between mica layers (Fig. 7(c)).
Based on Ohm's law, resistance of mica for these three types of Ga deposition can be modelled (ESI,† S2) as follows using eqn (6)–(8).
 | (6) |
 | (7) |
 | (8) |
Since ρ1 ≫ ρ2 (ρ1 = 1 × 10¹¹ to 1 × 10¹⁵ and ρ2 = 5 × 10⁻⁷ to 1.4 × 10⁻⁷),31 the total resistance values given by eqn (7) and (8) are ∼ρ1l/2w1t1 which are more consistent with the experimental results of halfway reduction of resistance. Nonetheless, it can be inferred from DFT calculations, EDS findings, and resistance measurements that there is a high probability of Ga clusters being in the spaces between the mica layers, which would reduce the band gap and electrical resistance.
CO2 capturing performance
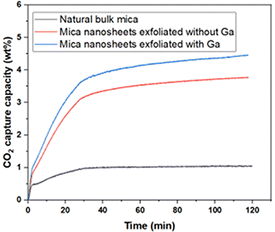
2D nanomaterials are prodigious candidates for CO2 adsorption to substitute the traditional adsorbents because of their inherent factors such as ultra-microporous structure, high specific surface area, availability of active sites, and the presence of functional groups for better interaction between the adsorbate and the adsorbent.Furthermore, T. Van Khai et al. reported that the C atom concentration slightly increases during exfoliation, which could be due to the contamination of CO2 on the exposed mica surface.9 Therefore, in order to investigate the engineering applications of this novel 2D nanomaterial, preliminary CO2 capture experiments were performed. The CO2 adsorption capacity of the as-prepared samples was tested at room temperature (30 °C) using TGA. As shown in Fig. 8, the adsorption capacities of natural bulk mica and the Ga/mica nanosheets composite exfoliated using Ga are 1.05% and 4.45%, respectively, representing a significant 4.23-fold increase in adsorption capacity. Moreover, the result was compared with that of the control sample synthesized using the same procedure but without adding Ga. It can be concluded that the addition of Ga enhanced the exfoliation process and led to a 20% increase in CO2 adsorption capacity compared to the control sample. Additionally, the exfoliated Ga/mica nanosheets demonstrated a significantly higher adsorption of CO2 (4.45 wt%) compared to N2 (1.47 wt%), indicating a notable selectivity for CO2 over N2 (ESI,† S3). Similar to other clay minerals, exfoliation increases the surface area, active edge, and oncoming ditrigonal cavities which act as CO2 adsorption sites.32 The percentage of potassium cations on the surface rises with surface area. The quadrupole interaction between the potassium cations and the CO2 molecules, as well as the ditrigonal cavities that can trap air molecules, result in the physisorption of CO2. On the other hand, CO2 can easily form bonds with the O atoms of the octahedra at the nanosheet edges or be activated to CO32− or HCO3− ions by adsorbing H2O on the mica surface. These carbonates can react by chemisorption with the alkali metal cations on the surface of the 2D nanosheets or in the open space between tetrahedron rings to form K2CO3. The formation of K2CO3 on the mica surface has been previously reported in experiments,33 and further insights have been gained through first-principles calculations conducted by our research group.34 Our study demonstrated that the calculated binding energy between few-layered mica and K2CO3 is negative, indicating a favorable interaction. Additionally, we found that K2CO3 had a greater affinity for mica nanosheets than for bulk mica.34 This K2CO3 layer enhances electron transfer to CO2 and facilitates further CO2 adsorption through physisorption.7 Moreover, the efficiency of many CO2 capture systems can be affected by contaminants like water vapor or other organic substances. M. Ali et al. reported that the presence of organic acids led to a lower trapping potential due to the reduced wettability of CO2 on the mica surface. They observed that the wettability decreased further with an increase in the alkyl chain length in fatty acids, with the wettability of CO2 ranking as follows: hexanoic acid C6 > lauric acid C12 > stearic acid C18 > lignoceric acid C24.35 On the other hand, CO2 adsorption on the mica surface was catalysed by water and activated to form CO32− or HCO3− ions. The potential mechanism of this catalytic surface reaction was initially discussed by K. G. Bhattacharya et al. In this process, CO2 is presumed to attack a hydroxyl site in the outermost tetrahedral layer or H2O on the surface, leading to the formation of a bicarbonate species. Subsequently, this species would dissociate into a carbonate and a proton, with the proton migrating along the surface.36 These carbonates can react to form K2CO3 on the surface of the 2D nanosheets or in the open space between tetrahedron rings by chemisorption with the alkali metal cations. Thus, these literature data support the notion that both physisorption and chemisorption can cause CO2 sorption on the surface and between exfoliated mica layers. As a further exploration of increasing CO2 adsorption capacity, M. Khajeh et al. demonstrated an increase in CO2 adsorption capacity with rising pressure and a decrease with increasing temperature,37 a phenomenon also observed by M. Lutynski et al. for other clays, such as organic carbon (TOC).38 Our injection of cationic and anionic polymers resulted in a larger adsorption capacity.39 While there is no existing literature on the effect of amine-functionalization and acid treatment for CO2 adsorption on mica surfaces, a clay structure similar to mica, montmorillonite (MMT), exhibited a higher CO2 adsorption capacity following amine-functionalization and acid treatment.40 Therefore, octadecyl amine modification and acid treatment may hold potential for enhancing the CO2 adsorption capacity of mica.
Although Ga is used as an intercalation material in the exfoliation of mica to nanosheets, Ga/mica nanosheets could be a promising composite material for CO2 capture and conversion because aluminosilicate materials/metal composites such as Li–Rh/y-zeolite, Cu/SiO2, Cu–Ni/Al2O3 and Cu–Zn/Al2O3 have been used in the literature for the conversion of CO2 to hydrocarbons and other valuable chemicals.41 However, the performance of these composites can deteriorate if carbonaceous materials adhere to the catalytic metal surface. Theoretically, this issue can be resolved by replacing the metal component with a liquid metal, which is based on the phenomenon of LME, as proved experimentally by J. Tang et al.42 The liquid gallium interface allows the carbonaceous products to be spontaneously exfoliated and removed from the surface of mica through mechanical agitation during the catalyst reaction, maintaining the accessibility of the active sites. During the CO2 reduction process, Ga (0)s converted into Ga(1), while CO2 is activated into the CO2˙− radical.42 Finally, it can be concluded that the Ga/mica nanosheet composite demonstrates good CO2 adsorption capacity and has promising potential for expanding its CO2 conversion applications.
Conclusions
In conclusion, we explored combined theoretical, computational, and experimental approaches driven by LME to obtain 2D mica. The new LME-assisted exfoliation of 2D nanosheets utilizes the ability of layer separation by biaxial strain followed by phonon–phonon interaction and reducing the energy barrier for fracture propagation. The DFT calculations have shown that Ga intercalation results in positive tensile strain εc, perpendicular to the in-plane direction of mica sheets. This demonstrates a significant shift in the contact angle and suggests that biaxial strain had a noticeable impact. In particular, (1) it leads to a substantial increase in the contact angle of the intercalated liquid metal and (2) the expansion of mica layers caused by the surface tension force of the intercalated liquid metal results in the application of mechanical force. Moreover, DFT calculations have demonstrated that the insertion energy of Ga clusters is lower than that of a single Ga atom and the formation energy of the Ga–mica interface is lower than that of the air–mica interface, indicating a lower energy barrier for the fracture of the mica layer. These findings validate the hypothesis that liquid metal embrittlement (LME) can be used to exfoliate mica through Ga intercalation. Experimental results showed that the exfoliated product consists of single and few layers of mica sheets. Calculations and experiments both showed that the intercalation of Ga into mica decreased the resistance and the band gap. Furthermore, mica nanosheets exfoliated with gallium could be applied for CO2 capture, and possibly convert it. This is the first time that the liquid embrittlement method has been used to exfoliate a 2D material.Author contributions
P. Vishakha T. Weerasinghe: methodology, formal analysis, visualization, data curation, writing – original draft preparation, and writing and editing. Shunnian Wu: theoretical simulations, visualization, data curation, writing – original draft preparation, and writing and editing. W. P. Cathie Lee: visualization, writing – review and editing. Qiang Zhu: data curation and resources. Ming Lin: resources, data curation, and writing – review and editing. Ping Wu: conceptualization and biaxial strain modelling, funding acquisition, supervision, project administration, and writing – review and editing.Conflicts of interest
There are no conflicts to declare.Acknowledgements
This research was supported through the AME Individual Research Grant (A20E7c0108) by the Agency for Science, Technology and Research, Singapore; MOE2018-T2-1-163 from the Ministry of Education, Singapore; the Marine Science Research and Development program (MSRDP-P28) by the National Research Foundation, Prime Minister's Office, Singapore; the MOE-T1-program (SKI 2022_02_15) from the Ministry of Education, Singapore.Notes and references
- Z. Lin, A. McCreary, N. Briggs, S. Subramanian, K. Zhang, Y. Sun, X. Li, N. J. Borys, H. Yuan and S. K. Fullerton-Shirey, 2D Mater., 2016, 3, 042001 CrossRef.
- A. P. Balan, A. B. Puthirath, S. Roy, G. Costin, E. F. Oliveira, M. Saadi, V. Sreepal, R. Friedrich, P. Serles and A. Biswas, Mater. Today, 2022, 58, 164–200 CrossRef CAS.
- J. Ding, H. Zhao and H. Yu, Nanoscale, 2020, 12, 16253–16261 RSC.
- H. G. Hansma, J. Biomol. Struct. Dyn., 2013, 31, 888–895 CrossRef CAS.
- M. R. Islam and M. Tomitori, Appl. Surf. Sci., 2020, 532, 147388 CrossRef CAS.
- X.-F. Pan, H.-L. Gao, Y. Lu, C.-Y. Wu, Y.-D. Wu, X.-Y. Wang, Z.-Q. Pan, L. Dong, Y.-H. Song and H.-P. Cong, Nat. Commun., 2018, 9, 1–8 CrossRef.
- P. V. T. Weerasinghe, S. Wu, W. C. Lee, M. Lin, F. Anariba, X. Li, D. H. L. Seng, J. Y. Sim and P. Wu, Materials, 2023, 16, 2921 CrossRef CAS.
- W. Ying, B. Han, H. Lin, D. Chen and X. Peng, Nanotechnology, 2019, 30, 385705 CrossRef CAS PubMed.
- T. Van Khai, H. G. Na, D. S. Kwak, Y. J. Kwon, H. Ham, K. B. Shim and H. W. Kim, Nanotechnology, 2013, 24, 145602 CrossRef.
- S. Wu, P. V. T. Weerasinghe and P. Wu, FlatChem, 2023, 100565 CrossRef CAS.
- M. Razmpoosh, C. DiGiovanni, Y. Zhou and E. Biro, Prog. Mater. Sci., 2021, 121, 100798 CrossRef CAS.
- T.-J. Tarn and Y. Rasis, IEEE Trans. Autom. Control, 1976, 21, 441–448 CrossRef.
- C. Ye, Q. Li, P. Wu, G. Tang and W. Liu, 2016.
- G. Britain and R. J. Parker, The flixborough disaster: report of the court of inquiry, HM Stationery Office, 1975 Search PubMed.
- K. Nilsson and A. Hojna, EU Science Hub-European Commission, 2018, 450.
- M. Rajagopalan, M. Bhatia, M. Tschopp, D. Srolovitz and K. Solanki, Acta Mater., 2014, 73, 312–325 CrossRef CAS.
- M. Yamaguchi, T. Tsuru, M. Itakura and E. Abe, Sci. Rep., 2022, 12, 1–7 CrossRef PubMed.
- G. Kresse and J. Furthmuller, Phys. Rev. B: Condens. Matter Mater. Phys., 1996, 54, 11169–11186 CrossRef CAS PubMed.
- G. Kresse and J. Furthmuller, Comput. Mater. Sci., 1996, 6, 15–50 CrossRef CAS.
- B. Hammer, L. B. Hansen and J. K. Norskov, Phys. Rev. B: Condens. Matter Mater. Phys., 1999, 59, 7413–7421 CrossRef.
- G. Kresse and D. Joubert, Phys. Rev. B: Condens. Matter Mater. Phys., 1999, 59, 1758–1775 CrossRef CAS.
- S. Grimme, J. Antony, S. Ehrlich and H. Krieg, J. Chem. Phys., 2010, 132, 19 CrossRef.
- H. J. Monkhorst and J. D. Pack, Phys. Rev. B: Solid State, 1976, 13, 5188–5192 CrossRef.
- H. Sakuma, J. Geophys. Res.: Solid Earth, 2013, 118, 6066–6075 CrossRef.
- A. A. Griffith, Philos. Trans. R. Soc., A, 1921, 221, 163–198 Search PubMed.
- B. T. Tan, P. Wu and F. Anariba, Results Eng., 2022, 13, 100349 CrossRef CAS.
- W. C. Lee, S. Wu, F. Anariba and P. Wu, Mater. Today Adv., 2023, 19, 100406 CrossRef CAS.
- P. Wu and T. Wu, J. Alloys Compd., 2017, 705, 269–272 CrossRef CAS.
- P. Wu, B. T. Tan, J.-I. Jeong, J.-H. Yang, S. Wu and F. Anariba, J. Alloys Compd., 2020, 846, 156357 CrossRef CAS.
- R. F. Brady, Prog. Org. Coat., 2001, 43, 188–192 CrossRef CAS.
- J. Fowler and F. Farmer, Nature, 1955, 175, 648 CrossRef CAS PubMed.
- K. Sato, K. Fujimoto, W. Dai and M. Hunger, J. Phys. Chem. C, 2013, 117, 14075–14080 CrossRef CAS.
- J. N. Israelachvili, N. A. Alcantar, N. Maeda, T. E. Mates and M. Ruths, Langmuir, 2004, 20, 3616–3622 CrossRef CAS.
- S. Wu, W. Lee and P. Wu, Sci. Rep., 2022, 12, 1–11 CrossRef.
- M. Ali, A. Aftab, Z.-U.-A. Arain, A. Al-Yaseri, H. Roshan, A. Saeedi, S. Iglauer and M. Sarmadivaleh, ACS Appl. Mater. Interfaces, 2020, 12, 39850–39858 CrossRef CAS.
- H. K. Christenson and N. H. Thomson, Surf. Sci. Rep., 2016, 71, 367–390 CrossRef CAS.
- M. Khajeh and A. Ghaemi, J. Chin. Chem. Soc., 2020, 67, 253–266 CrossRef CAS.
- M. Lutyński, P. Waszczuk, P. Słomski and J. Szczepański, Energy Procedia, 2017, 125, 457–466 CrossRef.
- C. Dai, G. Zhao, Q. You and M. Zhao, J. Appl. Polym. Sci., 2014, 131(3) DOI:10.1002/app.39462.
- M. Khajeh and A. Ghaemi, Int. J. Environ. Anal. Chem., 2021, 1–26 Search PubMed.
- W. Wang, S. Wang, X. Ma and J. Gong, Chem. Soc. Rev., 2011, 40, 3703–3727 RSC.
- J. Tang, J. Tang, M. Mayyas, M. B. Ghasemian, J. Sun, M. A. Rahim, J. Yang, J. Han, D. Lawes and R. Jalili, 2020.
Footnote |
| † Electronic supplementary information (ESI) available. See DOI: https://doi.org/10.1039/d3ma00837a |
| This journal is © The Royal Society of Chemistry 2024 |

