 Open Access Article
Deep-blue emissive and colourless polyimides: optical property tuning by triphenylamino and carbazole chromophores†
Pavel
Šimon
 ab,
Jakub
Štrojsa
a,
Milan
Klikar
a,
Zuzana
Burešová
a,
Aleš
Růžička
 c,
Jiří
Zelenka
b,
Jiří
Kulhánek
a and
Jiří
Tydlitát
 *a
*a
aInstitute of Organic Chemistry and Technology, Faculty of Chemical Technology, University of Pardubice, Studentská 573, Pardubice 53210, Czech Republic. E-mail: jiri.tydlitat@upce.cz
bToseda s.r.o., U Panasonicu 376, Staré Čivice, Czech Republic
cDepartment of General and Inorganic Chemistry, Faculty of Chemical Technology, University of Pardubice, Studentská 573, Pardubice, 532 10, Czech Republic
First published on 11th January 2024
Abstract
Two novel emissive chromophores based on triphenylamine and carbazole have been designed, prepared and further utilized as comonomers towards end-capped emissive colourless polyimides. The polyimide films were fabricated using 1,2,4,5-cyclohexanetetracarboxylicdianhydride/2,2-bis[4-(4-aminophenoxy)phenyl]propane (CHDA-BAPP) and 4,4′-(hexafluoroisopropylidene)diphthalic anhydride/2,2'-bis(trifluoromethyl)benzidine (6FDA-TFMB), and 5, 1 or 0.1 mol% of comonomer. Fundamental structure–property relationships were elucidated both in solution and the polymeric backbone. Facile planarization/rigidification of the chromophore central donor turned out to be a useful strategy to modulate the optical and thermal properties both of the single molecule and polymeric film. The prepared films are highly thermally stable (T5% up to 526 °C) and highly transparent (T400 ranging between 72–86% for 0.1 mol% loadings), and most of the films were colourless. The luminescence colour of the films ranges from yellow-greenish to blue. CHDA-BAPP carbazole-terminated PIs showed deep-blue emission and excellent optical properties with CIEy ≤ 0.1 and high colour purity (FWHM 38 resp. 42 nm) doped with 1 resp. 0.1 mol% of comonomer. The experimental data were further corroborated by DFT calculations and single crystal X-ray analysis.
Introduction
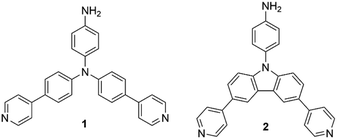
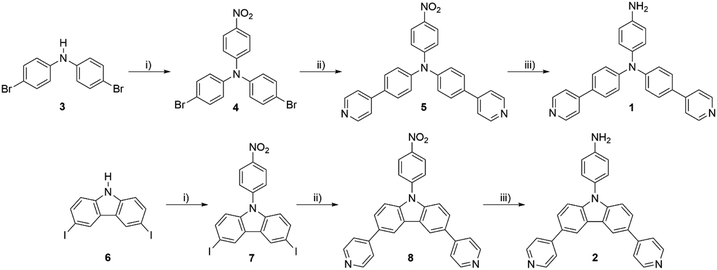
A tremendous number of emissive materials have been developed and found commercial applications across various fields. Yet, with endless technology development, these materials with tailored properties are very challenging and at the centre of interest. Emissive chromophores and polymers have wide potential applications in organic electronics; push–pull chromophores containing triphenylamine (TPA) or a carbazole moiety are particular examples. These emissive derivatives have found various applications in organic photovoltaics (OPVs)1 as, for example, luminescent solar concentrators (LSCs)2,3 and organic light emitting diodes (OLEDs),4–7 but also in the field of sensing of biological processes.8–11 TPA- and carbazole-derived chromophores have been extensively studied for their pronounced properties, such as aggregation induced emission (AIE),4,7,12 dual fluorescence,13 thermally activated delayed fluorescence (TADF),14 mechanofluorochromism7,15etc. Peculiar optical properties impart TPA and carbazole derivatives with the potential to be applied in organic electronics and sensing materials, especially as the emissive part of a polymeric backbone. Polyimide (PI) is a typical example due to its high thermal stability and thus suitability for space applications.16 Besides thermal robustness, optical transparency is often a required parameter of emissive PI films.17,18 Some emissive PIs containing TPA subunits19–21 and featuring electrochromic22,23 or luminescent24 properties have been described.Based on our previous work on emissive TPA derivatives,25,26 we report herein a facile synthesis of novel TPA and carbazole derivatives 1 and 2 (Fig. 1) that were further used as chromophoric comonomers to prepare fluorescent PIs. These push–pull molecules possess a D–π–D–(π–A)2 arrangement with two pyridine acceptors and one central amino donor (TPA or carbazole) equipped with a free amino group at the third branch. The latter allows 1 and 2 to be used as reactive comonomers affording emissive PI films.
Results and discussion
Comonomers
X-Ray single crystal analysis
After slow diffusion of hexane into DCM solution of 1, a suitable monocrystal for X-ray analysis was obtained. The ORTEP plot in Fig. 2 corresponds to the predicted structure of 1. It crystallizes in the monoclinic space group P21/c bearing eight molecules of 1 along with eight dichloromethane molecules within the unit cell. The core structure resembles the triphenyl- and tris(4-biphenyl)- and tris[4-(4-pyridyl)phenyl]amines26–28 found in the Cambridge Structural Database.29 The nitrogen atoms located between the three phenyl rings are deviated from the planes made by three pivotal carbon atoms (C1, C12 and C23; for one of the molecules shown in Fig. 2) by ∼0.1 Å. The same is expressed in a small difference of ∼2.5° from the ideal value (360°) for the sum of C–N–C angles in the trigonal planar arrangement. The supramolecular arrangement is dominated by H-bond interactions between the NH2 group and pyridyl nitrogen atoms of neighbouring molecules with NH⋯N separations of ∼3 Å (see Table S2 and Fig. S15, ESI†). The second pyridyl in the same molecule is bound to the dichloromethane solvent by CH⋯N interaction (Fig. S15, ESI†). The rest of the atomic distances and angles are found to be in a predictable range.30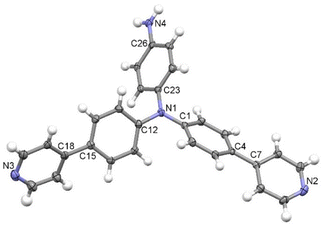 | ||
| Fig. 2 The molecular structure of 1. ORTEP diagram with displacement ellipsoids at the 50% probability level. Dichloromethane solvent molecules are omitted for clarity. | ||
Photophysical properties
The optical characteristics of amines 1 and 2 were investigated in DCM and THF, and the measured data are summarized in Table 1 and Fig. 3. The absorption maxima of carbazole 2 were found within the UV area (324/327 nm in DCM/THF; Fig. 3b). On the other hand, TPA chromophore 1 possesses the absorption maxima red-shifted to 369/371 nm with the absorption edges reaching the Vis area (Fig. 3a), which imparts the solution of 1 with pale yellow colour. In general, three excitonic transitions are anticipated for tripodal chromophores.31,32 Whereas flexible TPA derivative 1 has only two low-energy peak maxima (∼325/370 nm) with the most intense longest-wavelength absorption band appearing at around 370 nm, rigid carbazole 2 possesses one similar peak at intermediate energy (seen as a shoulder at around 325 nm) and a dominant high-energy peak at ∼290 nm. These spectral features are in accordance with the absorption spectra of similar TPA- and carbazole-centred chromophores published in the literature.33–37 Having the same D–π–D–(π –A)2 arrangement and bearing the same chromophoric units, the spectral difference must be ascribed to the planarized central amino donor in carbazole derivative 2. Whereas the central nitrogen atom of TPA derivative 1 adopts a tetrahedral arrangement (see Fig. 2), and allows conjugation of the lone electron pair into the appended pyridine-terminated branches, the planarized structure of 2 (Fig. S16, ESI†) diminishes intramolecular charge-transfer to both pyridine acceptors resulting in hypsochromically shifted spectra by about 45 nm.38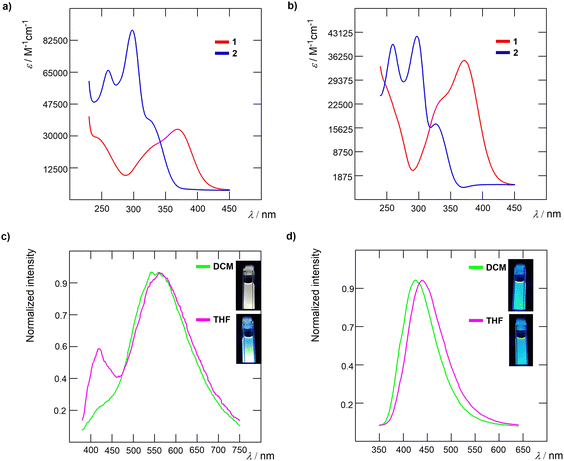 | ||
| Fig. 3 Absorption spectra of 1 and 2 in (a) DCM and (b) THF. Normalized emission spectra of chromophores in DCM and THF solutions (c) 1 and (d) 2. | ||
Both amines 1 and 2 are emissive in DCM and THF (Fig. 3c and d), with the emission maxima within the range of 427 to 565 nm. Whereas rigid 2 showed blue luminescence in both solvents, flexible 1 showed yellowish luminescence in DCM and blue emission in THF. This behaviour reflects their structural features, where 1 most likely undergoes significant structural rearrangement upon excitation as compared to 2. The measured Stokes shift is higher for 1, which further corroborates the aforementioned conclusion. In addition to the main fluorescence band, 1 exhibited a second, high-energy emission band at around 420 nm in THF (seen as a shoulder in DCM). This may be assigned to a locally excited state corresponding to electron transition between the peripheral amino donor and TPA core.39 The low-energy fluorescence band is assigned to electron transition between the TPA core and pyridine acceptors similar to that we have seen in our previous work on TPA derivatives.26 Increasing the polarity of the media (polarity index P′ = 3.1/4.0 for DCM/THF)40 resulted in red-shifted emission maxima of 1 and 2.
Electrochemical properties
The electrochemical characterization of target chromophores 1 and 2 was carried out in THF containing 0.1 M Bu4NPF6 in a three-electrode cell by cyclic voltammetry (CV). The acquired data are summarized in Table 2, and CV diagrams and further CV description are given in the ESI.†| C | E p(ox1) [V] | E p(red1) [V] | ΔEa [eV] | E HOMO [eV] | E LUMO [eV] | T m (°C) | T d (°C) | T i (°C) | T 5% (°C) |
|---|---|---|---|---|---|---|---|---|---|
| a E p(ox1) and Ep(red1) are peak potentials of the first oxidation and reduction, respectively, as measured by CV; all potentials are given vs. SSCE, ΔE = Ep(ox1) − Ep(red1). b −EHOMO/LUMO = (Ep(ox1) + 0.036) or (Ep(red1) + 0.036) + 4.28 (vs. SCE).41,42 The increment of +0.036 V corresponds to the difference between SCE (0.241 vs. SHE) and SSCE (0.205 vs. SHE).43 c T m = melting point (the point of intersection of a baseline and a tangent of thermal effect = onset). d T d = thermal decomposition (pyrolysis in N2 atmosphere). e T i = initial temperature of thermal degradation (determined as the last common point of the TGA curve and its first derivation - DTG curve). f T 5% = temperature of 5% weight loss (determined by a gradual horizontal step on the TGA curve). | |||||||||
| 1 | 0.76 | −2.33 | 3.09 | −5.08 | −1.99 | — | >460 | 225 | 300 |
| 2 | 1.02 | −2.36 | 3.38 | −5.34 | −1.96 | 349 | >490 | 215 | 315 |
The first oxidation and reduction processes were primarily captured by voltammetric measurements. These oxidations/reductions were recorded as irreversible processes, see Fig. S17 (ESI†). The Ep(ox1) and Ep(red1) values for chromophores 1 and 2 were found within the range of 0.76 to 1.02 and −2.33 to −2.36 V, respectively, and were further recalculated to the HOMO/LUMO levels (Table 2). Despite the fact that the electrochemically derived peak potentials do not correspond in absolute values with the HOMO/LUMO levels (half-wave potentials are not available), these values were used as uniform for describing the electrochemical trends. Assuming the first oxidation as a one-electron process located at the terminal amino donor, according to the anodic/cathodic current maxima, the first reduction was recorded as a multi-electron process (2–3 e−). This corresponds with the number of pyridine acceptors in the molecule. Multi-electron nature is further confirmed by the presence of a shoulder at Esh = −2.25 V within the first reduction peak of chromophore 2. However, the potential of the first reduction was related to the peak (current) maxima of these consecutive electron processes.
Thermal properties
Thermal behaviour of chromophores 1 and 2 was studied by differential scanning calorimetry (DSC) and thermogravimetric analysis (TGA). Melting points (Tm) and thermal decomposition temperatures (Td) were measured by DSC. Initial temperatures of thermal degradation (Ti) and temperatures of 5% weight loss (T5%) were determined by the TGA analysis. All these values are summarized in Table 2.Target molecules possess high thermal stability as deduced from the DSC records. Compound 2 underwent a melting process (Tm = 349 °C), which was recorded as a typical sharp endothermic peak (Fig. S19, ESI†). Under the ongoing heating program, a gradual endothermic evaporation of the liquid phase was observed. During evaporation, the DSC curve turns into an exothermic process (up to 490 °C), which most likely indicates thermal decomposition. A carbonized residue in the crucible after measurement further confirmed thermal degradation of 2 during the evaporation process. In contrast, a different thermal behaviour was observed for 1, which does not melt and its solid sample distinctly sublimes above 350 °C. Analogously with molecule 2, a partial decomposition of the remaining sample 1 occurred at around 460 °C (Fig. S18, ESI†). In addition, a small broad endothermic peak between 120–140 °C was detected for compound 1, which probably indicates the desorption of residual solvent molecules from the crystal lattice. This probably led to the partial disintegration of the lattice and the formation of an amorphous solid arrangement, which was confirmed by a re-cooling and re-heating process that revealed a glass transition at around 100 °C (Fig. S18, ESI†). These conclusions were further supported by the TGA analysis (Fig. S20a, ESI†). A weight loss of ca. 2.5% was captured between 100–200 °C for 1, which corresponds with the aforementioned desorption of residual solvents. When the samples 1–2 were isothermally held at 30 °C above their Ti, the linear trend in weight loss confirmed their weak sublimation, especially for 1 (Fig. S21, ESI†). Since the TGA analysis was carried out in fully open crucibles (unlike the DSC), compound 1 suffered a significant weight loss (ca. 85%) between 300 and 370 °C due to intense sublimation. On the other hand, the significant weight loss of compound 2 is given by the evaporation of the liquid sample after its melting above 350 °C. Nevertheless, more than 40% of carbonized residues after TGA analysis indicates a clear thermal degradation of compound 2, which can be related to the distinctive shoulder seen in the corresponding DTG curve at around 440 °C (Fig. S20b, ESI†).
DFT Calculations
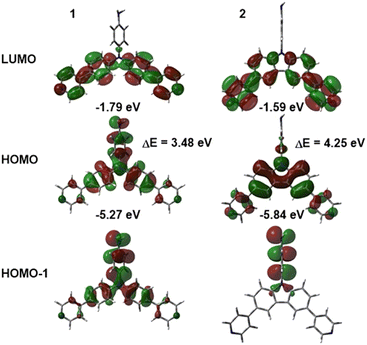
To obtain further insight into the spatial arrangement and properties of amino comonomers 1 and 2, DFT calculations were performed by using Gaussian 16 W at the B3LYP/6-311++G(2d,p) level in THF. The optimized geometries were used for all further calculations. The theoretical electronic absorption spectra were calculated at the TD-DFT (nstates = 10) CAM-B3LYP/6-311++G(2d,p) level in THF.44 Optimized geometries, localization of the frontier molecular orbitals and the energies of the HOMO and LUMO are shown in Fig. 4 and Fig. S23 (ESI†). Whereas TPA chromophore 1 shows a typical propeller-shaped arrangement of phenyls, the phenylamino group in carbazole 2 is almost perpendicular to the carbazole moiety. This structural arrangement affects the electron distribution and thus fundamental properties of both chromophores. In both chromophores, the LUMO (−1.79 eV for 1, −1.59 for 2) is similarly spread across the pyridine moieties, while localization of the occupied orbitals is strongly affected by the structure. The twisted phenylamino moiety in carbazole 2 is electronically almost isolated from the rest of the molecule, which results in the localization of the HOMO (−5.84 eV) across the carbazole unit and the HOMO−1 on the phenylamino group. TPA chromophore 1 possesses both the HOMO (−5.27 eV) and the HOMO−1 distributed over all three branches. These structural features are reflected by a significantly narrowed energy band gap of 3.48 eV calculated for 1, which is in contrast to 4.25 eV for 2. These calculated values further corroborate the experimental data obtained from the electrochemical and photophysical measurements. As compared to experimental ones, the calculated electronic absorption spectra are similarly shaped (Fig. S22, ESI†) and slightly blue-shifted (by ca 45 nm), which is consistent with our previous observations.45 Transition analysis revealed the longest-wavelength band of both 1 and 2 generated by the HOMO → LUMO transition, whereas transitions from the HOMO-2 and the HOMO to higher unoccupied orbitals were identified for the high-energy peaks (Fig. S22, ESI†).Polyimide films
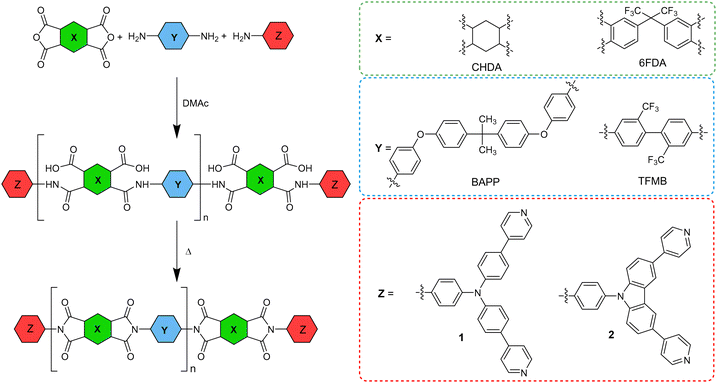
Synthesis
Utilizing two emissive amino-capped comonomers 1 and 2 and two sets of starting amines/anhydrides (BAPP/CHDA and TFMB/6FDA), four series of emissive PI films were prepared (Scheme 2) along with two non-emissive blanks for comparison. Three amounts of 1 and 2 were used (5, 1 and 0.1 mol %), which afforded three transparent PI materials in each series (Table 3). The PI films were prepared in a two-step reaction sequence involving the synthesis of PAA and its subsequent casting on glass plates and thermal imidization under high vacuum. All prepared PI films were transparent, emissive and flexible except for PI-2.1b, which was brittle. A repeated dissolving of PI-2.1b produced insoluble microgels and, therefore, it was not further studied. Successfully prepared PI films were analysed using FTIR (see Fig. S24–S27, ESI†). The characteristic bands at around 1780 cm−1, 1720 cm−1 and 1370 cm−1 corresponding to the C![[double bond, length as m-dash]](https://www.rsc.org/images/entities/char_e001.gif) O asymmetric stretching, C
O asymmetric stretching, C![[double bond, length as m-dash]](https://www.rsc.org/images/entities/char_e001.gif) O symmetric stretching and C–N stretching in the imide moieties, respectively, were evidenced. On the other hand, the absorption peak of C
O symmetric stretching and C–N stretching in the imide moieties, respectively, were evidenced. On the other hand, the absorption peak of C![[double bond, length as m-dash]](https://www.rsc.org/images/entities/char_e001.gif) O in PAA at around 1660 cm−1 wasn’t observed, confirming complete imidization of the materials.
O in PAA at around 1660 cm−1 wasn’t observed, confirming complete imidization of the materials.
| Polymer | Amine | Anhydride | Comon. | Mol. [%] | Emission | Colour | λ cut-off [nm]b | T 400 [%]c | T 700 [%]c | λ Amax [nm] | λ xEma [nm] | Chromaticity CIEd (x, y) | FWHM [nm] |
|---|---|---|---|---|---|---|---|---|---|---|---|---|---|
| a Brittle. b Cut-off wavelength. c T 400, T700: transmittance at 400/700 nm of average 50 μm thick film. d CIE coordinates of the emission spectra calculated according to ref. 46. | |||||||||||||
| PI-1 | TFMB | 6FDA | — | — | NO | Colourless | 348 | 81 | 90 | — | — | — | — |
| PI-2 | BAPP | CHDA | — | — | NO | Colourless | 295 | 86 | 91 | — | — | — | — |
| PI-1.1a | TFMB | 6FDA | 1 | 5 | YES | Yellowish | 393 | 5 | 90 | 418 | 588 | 0.487, 0.470 | 129 |
| PI-1.1b | TFMB | 6FDA | 1 | 1 | YES | sl. yellowish | 369 | 48 | 90 | 405 | 580 | 0.438, 0.472 | 135 |
| PI-1.1c | TFMB | 6FDA | 1 | 0.1 | YES | Colourless | 354 | 72 | 90 | 398 | 509 | 0.308, 0.399 | 160 |
| PI-2.1a | BAPP | CHDA | 1 | 5 | YES | sl. yellowish | 392 | 10 | 89 | 410 | 427 | 0.211, 0.234 | 117 |
| PI-2.1b | BAPP | CHDA | 1 | 1 | YES | —a | —a | —a | —a | —a | —a | —a | —a |
| PI-2.1c | BAPP | CHDA | 1 | 0.1 | YES | Colourless | 298 | 75 | 89 | 400 | 410 | 0.162, 0.044 | 54 |
| PI-1.2a | TFMB | 6FDA | 2 | 5 | YES | sl. yellowish | 365 | 33 | 89 | 455 | 518 | 0.322, 0.485 | 121 |
| PI-1.2b | TFMB | 6FDA | 2 | 1 | YES | Colourless | 353 | 72 | 90 | 443 | 504 | 0.274, 0.421 | 117 |
| PI-1.2c | TFMB | 6FDA | 2 | 0.1 | YES | Colourless | 352 | 77 | 90 | 378 | 502 | 0.277, 0.386 | 127 |
| PI-2.2a | BAPP | CHDA | 2 | 5 | YES | Colourless | 354 | 73 | 88 | 367 | 383 | 0.178, 0.164 | 48 |
| PI-2.2b | BAPP | CHDA | 2 | 1 | YES | Colourless | 333 | 82 | 89 | 360 | 381 | 0.166, 0.054 | 38 |
| PI-2.2c | BAPP | CHDA | 2 | 0.1 | YES | Colourless | 295 | 86 | 90 | 356 | 380 | 0.173, 0.106 | 42 |
Photophysical properties
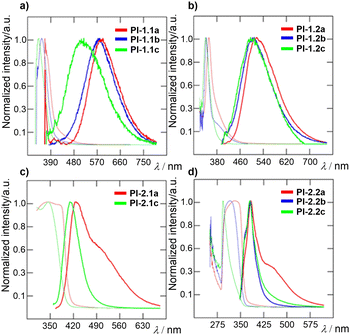
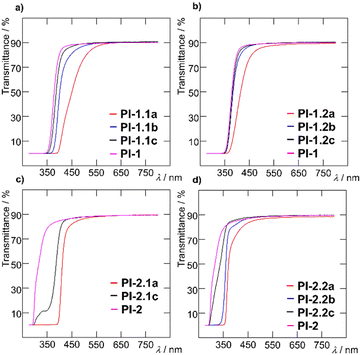
The optical characteristics of the PI films were investigated as summarized in Table 3. All materials, except blanks, are transparent as well as luminescent (see Table S4 for real images, ESI†). Polyimides containing 1 or 5 mol% of amino comonomer 1 are yellowish, while films PI-1.1c and PI-2.1c containing 0.1 mol% of 1 are colourless. Polyimides containing carbazole-based amino comonomer 2 are colourless except for PI-1.2a, which is slightly yellowish. The normalized UV-Vis and photoluminescent (PL) spectra of the target thin films are displayed in Fig. 5. Normalized absorption spectra of PI films show the same shape and differ in the position of the absorption band and onset absorption band, that shift hypsochromically with decreasing amount of comonomer 1 (e.g. Δλ = 70 nm when going from PI-1.2a to PI-1.2c; Fig. 5b). This observation is in accordance with the decreasing molecular weight within the order of c → b → a. The photoluminescence spectra are composed of one emission peak found within the region of 350–700 nm, which is red-shifted upon increasing the molar ratio of 1 and 2. As compared to the emission of 1 and 2 in solution, PI-films containing a TFMB-6FDA core possess bathochromically shifted emission, while the emission bands of BAPP-CHDA films are shifted hypsochromically. When compared to the emission of model imides MC-1 and MC-2 (see the ESI†), the emission maxima of both films are generally red-shifted. This phenomenon was observed earlier.24 When comparing the polyimide cores, TFMB-6FDA vs. BAPP-CHDA, films made of the latter possess significantly blue-shifted emission (e.g. λEmax = 518/383 nm for PI-1.2a/PI-2.2a), which can be ascribed to the fluorinated TFMB-6FDA aromatic structure vs. semi-aliphatic BAPP-CHDA. When considering general interest in blue emitters featuring CIEy ≤ 0.1 and high colour purity,47,48 BAPP-CHDA films with 2, namely PI-2.2b and PI-2.2c with CIE coordinates of (0.166, 0.054) resp. (0.173, 0.106) (Fig. 7) and very narrow full-width half-maximum (FWHM; 38 resp. 42 nm), are considered as very promising blue emitting polymeric materials (Table 3).Transmittance of PI films (Table 3) strongly depends on the wavelength (400 and 700 nm), type of PI film and amount of the chromophores 1 and 2 (Fig. 6). Increasing concentration of 1 or 2 increased λcutt-off and decreased T400. This effect is most pronounced when going from a to c within the series PI-1.1, where transmittance ranges from 5 to 72%. All PI films are well transparent at 700 nm (T700 = 88 to 91%). Blue-shifted absorption of 2, in respect to 1, brings also higher transparency of carbazole-terminated polymers at 400 nm (Fig. 6).
 | ||
| Fig. 7 (a) CIE chromaticity diagram 1931 of emissive PI film series PI2.2a–c,46 (b) photographs of PI films under ambient light and a hand-held UV lamp (254 and 365 nm). | ||
Thermal properties
Thermal properties of PI films were investigated by DSC and TGA (Table 4 and Fig. S30 and S31, ESI†). Thermal robustness is mostly dictated by the polyimide backbone, and aromatic TFMB-6FDA proved to be more thermally robust as compared to aliphatic BAPP-CHDA (e.g. ΔT5% = 57 °C). On the other hand, the effect of comonomer 1 or 2 is diminished, e.g. a slight improvement is seen when comparing doped and unmodified PI films PI-1 and PI-2 (T5% = 526/511 °C for PI-1.2c/PI-1). This effect is ascribed to PI films terminated by more thermally robust aromatic compounds 1 or 2. Higher thermal robustness of carbazole-terminated films further corroborates this supposition. On the contrary, increasing amount of 1 and 2 shortens the PI chain and reduces the T5% and Tg values.| Polymer | T 5% (N2)a [°C] | T 10% (N2)a [°C] | Char yieldb [%] | T g [°C] |
|---|---|---|---|---|
| a T 5% and T10% are temperatures of 5 and 10% weight loss, respectively. b Char yield after TGA analysis at 600 °C under N2 atmosphere. c T g means glass transition temperature measured by DSC. d Brittle. | ||||
| PI-1 | 511 | 531 | 60 | 327 |
| PI-2 | 454 | 470 | 30 | 258 |
| PI-1.1a | 510 | 531 | 62 | 306 |
| PI-1.1b | 515 | 535 | 65 | 317 |
| PI-1.1c | 516 | 536 | 62 | 325 |
| PI-2.1a | 455 | 464 | 39 | 262 |
| PI-2.1b | —d | —d | —d | —d |
| PI-2.1c | 458 | 471 | 34 | 252 |
| PI-1.2a | 524 | 545 | 67 | 304 |
| PI-1.2b | 524 | 547 | 72 | 323 |
| PI-1.2c | 526 | 545 | 70 | 332 |
| PI-2.2a | 457 | 470 | 43 | 265 |
| PI-2.2b | 448 | 463 | 31 | 260 |
| PI-2.2c | 454 | 473 | 38 | 265 |
Experimental
Detailed synthetic and experimental procedures, and additional data concerning all materials and instrumentation used for separation, isolation and analysis for this article have been included in the ESI.†Conclusions
Two new emissive chromophores and their utilization as comonomers for the preparation of emissive polyimides are reported. The chromophores were based on triphenylamine and a carbazole central unit. As compared to tetrahedral triphenylamine 1, the partially planarized/rigid structure of carbazole 2 brings different photophysical and thermal properties. Its absorption has been found fully in the near UV area, which is promising for the production of a transparent PI film. The thermal stability of the carbazole chromophore is also improved. Semi-aliphatic polyimides (CHDA-BAPP) and fluorinated aromatic polyimides (6FDA-TFMB) were combined with amino-capped comonomers 1 and 2 (5, 1 or 0.1 mol%) to afford various emissive PI films. Except for one film, all the prepared polyimides were shown to be flexible, transparent, and luminescent with high thermal stability; six of the PI films were colourless. Their fundamental properties can be easily tuned by a proper combination of PI backbone and comonomer. Fluorinated aromatic PIs possess red-shifted emission maxima as compared to semi-aliphatic ones (CHDA-BAPP), especially TPA-terminated ones (series PI-1.1a–PI-1.1c). On the contrary, semi-aliphatic polyimides prepared from CHDA-BAPP are more optically transparent but possess lower thermal stability and Tg as compared to fluorinated polyimides. Semi-aliphatic carbazole-terminated PIs (films PI-2.2b–PI-2.2c) showed excellent optical properties with CIEy ≤ 0.1 and high colour purity determined by FWHM 38 resp. 42 nm and, therefore can be considered as interesting blue emitters. In summary, carbazole-terminated PIs showed better trade-off between optical transparency and thermal stability.Author contributions
J. T.: conceptualization. P. Š., J. Š., M. K., Z. B., A. R.: investigation. J. T., P. Š., M. K., Z. B., A. R.: writing – original draft. J. Z., J. K.: supervision. J. T.: writing – review & editing.Conflicts of interest
There are no conflicts to declare.Acknowledgements
This work was supported by European Regional Development Fund-Project “ High sensitive sensors and low-density materials based on polymeric nanocomposites – NANOMAT (No. CZ.02.1.01/0.0/0.0/17_048/0007376)”.Notes and references
- J. Roncali, P. Leriche and P. Blanchard, Adv. Mater., 2014, 26, 3821–3838 CrossRef CAS PubMed.
- F. Mateen, T. G. Hwang, L. F. Boesel, W. J. Choi, J. P. Kim, X. Gong, J. M. Park and S. K. Hong, Int. J. Energy Res., 2021, 45, 17971–17981 CrossRef CAS.
- C. Papucci, T. A. Geervliet, D. Franchi, O. Bettucci, A. Mordini, G. Reginato, F. Picchioni, A. Pucci, M. Calamante and L. Zani, Eur. J. Org. Chem., 2018, 2657–2666 CrossRef CAS.
- W. Z. Yuan, Y. Gong, S. Chen, X. Y. Shen, J. W. Y. Lam, P. Lu, Y. Lu, Z. Wang, R. Hu, N. Xie, H. S. Kwok, Y. Zhang, J. Z. Sun and B. Z. Tang, Chem. Mater., 2012, 24, 1518–1528 CrossRef CAS.
- C. Y. Chan, M. Tanaka, Y. T. Lee, Y. W. Wong, H. Nakanotani, T. Hatakeyama and C. Adachi, Nat. Photonics, 2021, 15, 203–207 CrossRef CAS.
- S. O. Jeon, K. H. Lee, J. S. Kim, S. G. Ihn, Y. S. Chung, J. W. Kim, H. Lee, S. Kim, H. Choi and J. Y. Lee, Nat. Photonics, 2021, 15, 208–215 CrossRef CAS.
- X. Liu, X. Wei, Y. Miao, P. Tao, H. Wang and B. Xu, Tetrahedron, 2021, 86, 132061 CrossRef CAS.
- N. Jiang, B. Wang, T. Liu, Q. Liu, Q. Wei, Y. Xing and G. Zheng, Anal. Methods, 2019, 11, 232–235 RSC.
- Y. Gu, R. Yuan, X. Yan, C. Li, W. Liu, R. Chen, L. Tang, B. Zheng, Y. Li, Z. Zhang and M. Yang, Anal. Chim. Acta, 2015, 889, 113–122 CrossRef CAS PubMed.
- S. Wu, H. Song, J. Song, C. He, J. Ni, Y. Zhao and X. Wang, Anal. Chem., 2014, 86, 5922–5928 CrossRef CAS PubMed.
- X. Wang, G. Ding, Y. Wang, S. Mao, K. Wang, Z. Ge, Y. Zhang, X. Li and C. H. Hung, Tetrahedron, 2020, 76, 131726 CrossRef CAS.
- T. G. Hwang, J. Y. Kim, J. W. Namgoong, J. M. Lee, S. B. Yuk, S. H. Kim and J. P. Kim, Photochem. Photobiol. Sci., 2019, 18, 1064–1074 CrossRef CAS PubMed.
- Y. Kuramoto, T. Nakagiri, Y. Matsui, E. Ohta, T. Ogaki and H. Ikeda, Photochem. Photobiol. Sci., 2018, 17, 1157–1168 CrossRef CAS PubMed.
- P. Pander, R. Motyka, P. Zassowski, M. K. Etherington, D. Varsano, T. J. Da Silva, M. J. Caldas, P. Data and A. P. Monkman, J. Phys. Chem. C, 2018, 122, 23934–23942 CrossRef CAS.
- J. Moon Lee, S. Bum Yuk, J. Woong Namgoong and J. Pil Kim, Dyes Pigm., 2021, 185, 108864 CrossRef.
- I. Gouzman, E. Grossman, R. Verker, N. Atar, A. Bolker and N. Eliaz, Adv. Mater., 2019, 31, 1807738 CrossRef PubMed.
- H. Ni, J. Liu, Z. Wang and S. Yang, J. Ind. Eng. Chem., 2015, 28, 16–27 CrossRef CAS.
- T. Xiao, X. Fan, D. Fan and Q. Li, Polym. Bull., 2017, 74, 4561–4575 CrossRef CAS.
- A. Tabuchi, T. Hayakawa, S. Kuwata, R. Ishige and S. Ando, Polymers, 2021, 13, 4050 CrossRef CAS PubMed.
- K. Kanosue, S. Hirata, M. Vacha, R. Augulis, V. Gulbinas, R. Ishige and S. Ando, Mater. Chem. Front., 2019, 3, 39–49 RSC.
- K. Kanosue, R. Augulis, D. Peckus, R. Karpicz, T. Tamulevičius, S. Tamulevičius, V. Gulbinas and S. Ando, Macromolecules, 2016, 49, 1848–1857 CrossRef CAS.
- S. H. Lee, J. Bae, H. M. Seo, J. H. Im, H. S. Shin, E. J. Yoo and S. W. Lee, Mol. Cryst. Liq. Cryst., 2014, 598, 6–15 CrossRef CAS.
- C. H. Chang, K. L. Wang, J. C. Jiang, D. J. Liaw, K. R. Lee, J. Y. Lai and K. H. Lai, Polymer, 2010, 51, 4493–4502 CrossRef CAS.
- A. Iqbal, N. Khalid, H. M. Siddiqi, O. O. Park and T. Akhter, J. Fluoresc., 2018, 28, 311–321 CrossRef CAS PubMed.
- J. Tydlitát, M. Fecková, P. le Poul, O. Pytela, M. Klikar, J. Rodríguez-López, F. Robin-le Guen and S. Achelle, Eur. J. Org. Chem., 2019, 1921–1930 CrossRef.
- J. Tydlitát, S. Achelle, J. Rodríguez-López, O. Pytela, T. Mikýsek, N. Cabon, F. Robin-le Guen, D. Miklík, Z. Růžičková and F. Bureš, Dyes Pigm., 2017, 146, 467–478 CrossRef.
- L. Cao, L. Zhou, G.-H. Kang, C.-S. Ruan and B.-M. Ji, Z. Kristallogr. – New Cryst. Struct., 2013, 228, 329–330 CAS.
- B. Mondal, K. Acharyya, P. Howlader and P. S. Mukherjee, J. Am. Chem. Soc., 2016, 138, 1709–1716 CrossRef CAS PubMed.
- C. R. Groom, I. J. Bruno, M. P. Lightfoot and S. C. Ward, Acta Crystallogr., Sect. B: Struct. Sci., Cryst. Eng. Mater., 2016, 72, 171–179 CrossRef CAS PubMed.
- F. H. Allen, D. G. Watson, L. Brammer, A. G. Orpen and R. Taylor, Int. Tables Crystallogr., 2006, 790–811 Search PubMed.
- K. Seintis, I. K. Kalis, M. Klikar, F. Bureš and M. Fakis, Phys. Chem. Chem. Phys., 2020, 22, 16681–16690 RSC.
- H. Ceymann, M. Balkenhohl, A. Schmiedel, M. Holzapfel and C. Lambert, Phys. Chem. Chem. Phys., 2016, 18, 2646–2657 RSC.
- X. Du, J. Zhao, W. Liu, K. Wang, S. Yuan, C. Zheng, H. Lin, S. Tao and X. H. Zhang, J. Mater. Chem. C, 2016, 4, 10301–10308 RSC.
- K. Yu, J. Pan, M. Tian, H. Zhang, C. Jin, H. Zhang, Z. Mao and Q. He, Chem. – Asian J., 2022, 17, e202200571 CrossRef CAS PubMed.
- A. R. Marri, F. A. Black, J. Mallows, E. A. Gibson and J. Fielden, Dyes Pigm., 2019, 165, 508–517 CrossRef CAS.
- Y. L. Zhang, Q. Ran, Q. Wang, Q. S. Tian, F. C. Kong, J. Fan and L. S. Liao, Org. Electron., 2020, 81, 105660 CrossRef CAS.
- W. W. Tao, K. Wang, J. X. Chen, Y. Z. Shi, W. Liu, C. J. Zheng, Y. Q. Li, J. Yu, X. M. Ou and X. H. Zhang, J. Mater. Chem. C, 2019, 7, 4475–4483 RSC.
- A. Vogel, T. Schreyer, J. Bergner, F. Rominger, T. Oeser and M. Kivala, Chem. – Eur. J., 2022, 28, e202201424 CrossRef CAS PubMed.
- M. D. Zhang, Z. Q. Shi, M. D. Chen and H. G. Zheng, Dalton Trans., 2015, 44, 5818–5825 RSC.
- L. R. Snyder, J. Chromatogr. Sci., 1978, 16, 223–234 CAS.
- T. J. Carter, R. Mohtadi, T. S. Arthur, F. Mizuno, R. Zhang, S. Shirai and J. W. Kampf, Angew. Chem., Int. Ed., 2014, 53, 3173–3177 CrossRef CAS PubMed.
- A. A. Isse and A. Gennaro, J. Phys. Chem. B, 2010, 114, 7894–7899 CrossRef CAS PubMed.
- D. T. Sawyer, A. Sobkowiak and J. L. Roberts, Electrochemistry for chemists, J. Wiley and Sons Inc., 2nd edn, 1995 Search PubMed.
- M. J. Frisch, G. W. Trucks, H. B. Schlegel, G. E. Scuseria, M. A. Robb, J. R. Cheeseman, G. Scalmani, V. Barone, G. A. Petersson, H. Nakatsuji, X. Li, M. Caricato, A. V. Marenich, J. Bloino, B. G. Janesko, R. Gomperts, B. Mennucci, H. P. Hratchian, J. V. Ortiz, A. F. Izmaylov, J. L. Sonnenberg, D. Williams-Young, F. Ding, F. Lipparini, F. Egidi, J. Goings, B. Peng, A. Petrone, T. Henderson, D. Ranasinghe, V. G. Zakrzewski, J. Gao, N. Rega, G. Zheng, W. Liang, M. Hada, M. Ehara, K. Toyota, R. Fukuda, J. Hasegawa, M. Ishida, T. Nakajima, Y. Honda, O. Kitao, H. Nakai, T. Vreven, K. Throssell, J. A. Montgomery, Jr., J. E. Peralta, F. Ogliaro, M. J. Bearpark, J. J. Heyd, E. N. Brothers, K. N. Kudin, V. N. Staroverov, T. A. Keith, R. Kobayashi, J. Normand, K. Raghavachari, A. P. Rendell, J. C. Burant, S. S. Iyengar, J. Tomasi, M. Cossi, J. M. Millam, M. Klene, C. Adamo, R. Cammi, J. W. Ochterski, R. L. Martin, K. Morokuma, O. Farkas, J. B. Foresman and D. J. Fox, Gaussian 16, Gaussian, Inc., Wallingford CT, 2019 Search PubMed.
- M. Klikar, D. Georgiou, I. Polyzos, M. Fakis, Z. Růžičková, O. Pytela and F. Bureš, Dyes Pigm., 2022, 201, 110230 CrossRef CAS.
- E. H. H. Hasabeldaim, CIE chromaticity diagram 1931, 2021, https://sciapps.sci-sim.com/CIE1931.html.
- M. Xie, M. Sun, S. Xue and W. Yang, Dyes Pigm., 2022, 208, 110799 CrossRef CAS.
- X. Yang, X. Xu and G. Zhou, J. Mater. Chem. C, 2015, 3, 913–944 RSC.
Footnote |
| † Electronic supplementary information (ESI) available: Syntheses, NMR, HR-MS, thermal properties, electrochemistry, DFT calculations, and films. CCDC 2206624. For ESI and crystallographic data in CIF or other electronic format see DOI: https://doi.org/10.1039/d3ma00871a |
| This journal is © The Royal Society of Chemistry 2024 |

![[thin space (1/6-em)]](https://www.rsc.org/images/entities/char_2009.gif) :
: