 Open Access Article
Entanglement of cation ordering and manipulation of the magnetic properties through a temperature-controlled topotactic interface reaction in nanocomposite perovskite oxides†
Sudipa
Bhattacharya
a,
Radhamadhab
Das
a,
Shreyashi
Chowdhury
a,
K. K.
Supin
 bc,
M.
Vasundhara
 *bc,
Jyoti Ranjan
Sahu
d,
Trilochan
Bhunia
e,
Arup
Gayen
 e,
Oleg I.
Lebedev
f and
Md. Motin
Seikh
 *a
*a
aDepartment of Chemistry, Visva-Bharati University, Santiniketan–731235, West Bengal, India. E-mail: mdmotin.seikh@visva-bharati.ac.in
bPolymers and Functional Materials Department, CSIR-Indian Institute of Chemical Technology, Hyderabad-500007, India. E-mail: mvas@iict.res.in
cAcademy of Scientific and Innovative Research (AcSIR), Ghaziabad-201002, India
dP.G. Department of Physics, Maharaja Sriram Chandra Bhanja Deo University, Baripada-757003, India
eDepartment of Chemistry, Jadavpur University, Kolkata 700032, India
fLaboratoire CRISMAT, ENSICAEN UMR6508, 6 Bd Maréchal Juin, Cedex 4, Caen-14050, France
First published on 13th March 2024
Abstract
Achievement of B-site cation ordering for LaFe0.5Mn0.5O3, unlike other LaB0.5B′0.5O3 perovskites, has not been reported yet in polycrystalline samples. Thus far, there has been only one report on Fe and Mn ordering in LaMnO3–LaFeO3 artificial superlattices constructed on SrTiO3 using laser MBE methods [Ueda et al. Phys. Rev. B, 1999, 60, R12561.]. The ferromagnetic ordering with the TC around 230 K has been attributed to the Fe3+(d5)–O–Mn3+(d4) superexchange interaction for the superlattice with 1/1 stacking periodicity. Here, for the first time, we report the Fe and Mn ordering at the interface of the La0.45Ca0.55MnO3–LaFeO3 (LCMO–LFO) nanocomposite, achieving a TC of ∼225 K. It has been also observed that such an ordering is very sensitive to the processing temperature. Processing the composite at 1000 °C leads to complete randomization in the cationic distribution, which results in suppression of the high temperature transition at 225 K observed for 700 and 800 °C heat-treated samples. High-resolution TEM, HAADF, EDX mapping and ED analysis support the interfacial phase formation. This cationic ordering through interfacial reaction is further substantiated by the formation of a well-studied La2MnCoO6 double perovskite obtained from a LaMnO3–LaCoO3 nanocomposite by thermal treatment under similar conditions as that of the LCMO–LFO system. Our study revealed that by means of the interface reaction during composite processing, the product phase may dominate the overall property of the system. The temperature-controlled cationic ordering at the interfacial product phase of dominating magnetic properties may provide a novel route to design functional ceramic materials.
Introduction
The most popular advantage of composite materials is their improved structural functionalities such as specific strength, creep and fatigue behaviour, wear resistance, and damping properties for engineering applications.1–3 The structural integrity and mechanical behaviour of composite materials are sensitive to the chemical compatibility between reinforcement and a matrix. The chemical compatibility is demonstrated by interfacial reaction between the components, which is generally avoided due to loss of the reinforcement, as well as possible formation of a brittle intermetallic product phase. Thus, it is desirable to circumvent the interfacial reaction. The reinforcement should chemically wet the matrix to establish chemical bonding strength, as well as minimize interfacial energy. However, the multiphase composite materials behave as an interfacial material. Consequently, their performance depends on the characteristics of internal interfaces.4–7 The polycrystalline solids consist of a large number of interfaces that are full of diverse non-periodic atomic structures. Thus, a detailed description and fundamental understanding of interfaces and their influence on the macroscopic properties of solids are really a formidable task. A matrix and reinforcement may result in a thermodynamically compatible composite member by an intentional reaction at a local interface area through in situ processing.5,8,9 For the formation of an intermediate phase at the interface, the composite members experience a compositional change through the phase equilibria and diffusion pathways.10–12 The produced intermediate phase may play a crucial role in determining the properties of the composite phase.The customization of the physical properties of an electronically correlated oxide nanocomposite system is nontrivial. This is because of the complex nature of the individual components, which exhibits intriguing physical properties associated with the strong electronic correlation. Such complexity is further augmented when the particle size is reduced to the nanoscale.13–16 The materials with combined functionality are of interest for various practical applications. Composite materials can provide such functionality based on the product property where the cross-correlated electronic and magnetic properties can serve the purpose.17,18 The product property (such as magnetoelectric coupling) can be achieved from the composite of magnetostrictive and piezoelectric phases.17,19,20 There are numerous studies that have shown modification of physical properties in correlated functional oxides nanocomposites.21–30 The optimized interface between the hard (SrFe12O19) and soft (CoFe2O4) magnetic phases results from symbiotic grain growth, where one phase helps in the crystallization of the other one in the sol–gel process through the strong interfacial magnetic coupling between the two phases.29 A decrease in a magnetic moment with an increase in the coercive field of La0.7Sr0.3MnO3 is observed in the La0.7Sr0.3MnO3/NiFe2O4 core–shell structure.21 The morphology-dependent magnetic coupling has been reported for the La0.7Ca0.3MnO3/CoFe2O4 nanocomposite.22 The magnetic proximity effects and interface exchange interactions are reported to change the ferromagnetic TC by ∼50 K for SrFe12O19 and La0.7Sr0.3MnO3 in composite with CaCu3Ti4O12.25 For oxide nanocomposite systems, the proper choice of a second phase can be used to tune the magnetic properties of the matrix.27 A dramatic change in the magnetic properties of the multiferroic double perovskite La2MnCoO6 in composite with CaCu3Ti4O12 is observed due to local structural modification across the grain boundary.26 The interfacial interaction between the Fe3O4 nanoparticles and reduced graphene oxide nanosheets is reported to exhibit high performance as an anode material for lithium-ion batteries.31 However, the effect of the temperature-dependent interfacial reaction between the nanocomposites to modify their properties has not been explored in detail.
In this manuscript, we have explored the potential of the temperature-controlled interface reaction to control the cationic ordering for developing functional materials. The creation of new materials with unique physical properties can be achieved through the superlattice deposition by controlled atomic ordering in the film plane.32–34 Theoretical calculations revealed the A-type antiferromagnetic (A-AFM) ordering at the interface of the SrCrO3/YCrO3 superlattice where SrCoO3 and YCrO3 are of C-AFM and G-AFM, respectively, and it becomes ferromagnetic under a compressive strain of 1%.35 In this regard, it is worth mentioning the atomic ordering in LaMnO3–LaFeO3 artificial superlattices constructed on SrTiO3 using laser MBE methods.36 The magnitude of magnetization increases with the increase in the number of Fe–Mn interfaces. The superlattice with 1/1 stacking periodicity shows ferromagnetic ordering with the TC around 230 K.36 These ferromagnetic interactions at the LaMnO3–LaFeO3 interfaces have been attributed to the Fe3+(d5)–O–Mn3+(d4) superexchange, according to the Goodenough–Kanamori rule.37,38 However, the partial displacement between Fe and Mn with the decrease in the number of LaMnO3–LaFeO3 interfaces results in reduced magnetization, which corresponds to the antisite disordering, as observed in La2MnMO6 (M = Co and Ni).39–42 The observation of long range ferromagnetic ordering in LaMn0.5Fe0.5O3 through the Fe3+(d5)–O–Mn3+(d4) superexchange interaction, which is achieved by cationic ordering across the LaMnO3–LaFeO3 interface in a thin film is of significant importance. This is because of the fact that polycrystalline LaMn0.5Fe0.5O3 fails to exhibit long range spin ordering, unlike other LaB0.5B′0.5O3 compositions.43–46 LaMn0.5Cr0.5O3, LaMn0.5Co0.5O3 and LaMn0.5Ni0.5O3 exhibit the ferromagnetic TC at around 120, 225 and 280 K, respectively,41,42,47–50 whereas LaCo0.5Fe0.5O3, LaCo0.5Cr0.5O3 and LaFe0.5Ni0.5O3 are antiferromagnetic with the TN 370, 295 and ∼100 K, respectively.51–53 However, LaMn0.5Fe0.5O3 with uniform Fe and Mn distribution was found to be of nonmagnetic behavior, where cluster-like ferromagnetic or antiferromagnetic states appear for inhomogeneous cationic distribution.54–56 Even the hole-doped La1−xAxFe0.5Mn0.5O3 (A = Ca, Sr, Ba and Pb) with altered valence in the B-site failed to manifest the long-range ordering.57,58 On the other hand, the magnetic properties of LaMn0.5Fe0.5O3 are very much sensitive to the synthesis conditions and annealing temperatures, resulting in controversial magnetic states, particularly in nanostructured form.46,59,60
Here, we observed that atomic ordering of Fe3+(d5) and Mn3+(d4)/Mn4+(d3) takes place at the interface of the composite made up from La0.45Ca0.55MnO3 and LaFeO3. The cation ordered phase exhibits a magnetic transition at ∼225 K in agreement with the reported thin film. Such ordering is sensitive to the thermal treatment. For the 700 and 800 °C annealed samples, such ordering prevailed. However, for the 1000 °C annealed samples, a uniform distribution of Fe3+(d5) and Mn3+(d4)/Mn4+(d3) takes place with the formation of the non-magnetic single phase La0.725Ca0.275Mn0.5Fe0.5O3 composition. Such cation ordering due to the interface reaction is substantiated from a similar study on the LaMnO3–LaCoO3 nanocomposite, which results in the formation of the well-known double perovskite La2MnCoO6 with a TC of 220 K. This result demonstrates the temperature-controlled evolution of the product phase from the topotactic reaction at the interface of the nanocomposite for novel functionality.
Experimental details
The composites (La0.45Ca0.55MnO3)1−x(LaFeO3)x (where, x = 0, 0.5 and 1.0) were fabricated by intimate mixing of the two individual pure phase components, La0.45Ca0.55MnO3 and LaFeO3, followed by heating at different temperatures. The individual components La0.45Ca0.55MnO3 and LaFeO3 in their nanodimension were chemically synthesized via conventional sol–gel self-combustion synthesis technique using citric acid as a gelling agent. For the preparation of nanostructured LaFeO3 and La0.45Ca0.55MnO3, a stoichiometric ratio of metal nitrate salts La(NO3)3·6H2O (Alfa Aesar, 99.9%), Fe(NO3)3·9H2O (Alfa Aesar, 99.9%) [for LaFeO3] and La(NO3)3·6H2O (Alfa Aesar, 99.9%), Ca(NO3)2·4H2O (Sigma Aldrich, 99.9%) and Mn(OAc)2·4H2O (99.5%, Merck) [for La0.45Ca0.55MnO3] were dissolved in 50 mL double-distilled water. About 2 mL of conc. nitric acid was added to prevent the hydrolysis of the aquated metal ions. The reaction mixture was stirred for 2 h using a magnetic stirrer, followed by the addition of citric acid at about four times the mole ratio of the metal ions until a homogeneous, clear solution was obtained. The resulting solution was then stirred at 60 °C for 6 h, followed by evaporation at 90 °C to form the gel. The gel was dried at 150 °C and the resulting crude was ground thoroughly using an agate mortar-pestle, and then heated in air at 500 °C for 10 h and 15 h to obtained fine powders of LaFeO3 and La0.45Ca0.55MnO3, respectively. The La0.45Ca0.55MnO3–LaFeO3 composite was prepared by physical mixing of equimolar La0.45Ca0.55MnO3 and LaFeO3 in a mortar-pestle with ethanol to obtain a fine mixture of the two pristine phases. Then, this equimolar composite was divided into four parts to anneal at different temperatures, more specifically at 600, 700, 800 and 1000 °C for 10 h.A Bruker D8 Advance X-ray diffractometer operating at 40 kV and 40 mA with Cu Kα radiation (λ = 1.5418 Å) was used to record the powder X-ray diffraction (PXRD) patterns. The data were collected in the 2θ range of 10°–100° using the LYNXEYE detector (1D mode) with a dwell time of 1 s per step. A Zeiss GeminiSEM 450 field emission scanning electron microscope (FE-SEM), operated at an accelerating voltage of 20 kV, was used for imaging the sample surface morphology, to determine the particle size, energy dispersive X-ray analysis (EDX) and elemental mapping. Transmission electron microscopy (TEM), including electron diffraction (ED), high-angle annular dark-field scanning TEM (HAADF-STEM), and simultaneously acquired energy dispersive X-ray (EDX) elemental mapping experiments were carried out on an aberration double-corrected cold FEG JEM ARM200F microscope operated at 200 kV and equipped with a CENTURIO EDX detector, ORIUS Gatan camera and Quantum GIF. For all of the samples, X-ray photoelectron spectroscopy (XPS) measurements were carried out on the powder form at room temperature. The XPS spectra were recorded using a PHI 5000 Versa Probe II, ULVAC-PHI, Inc. instrument using Al Ka1 as the X-ray source. During the measurement time, the XPS chamber pressure was maintained at 5 × 10⁻¹⁰ mbar. The binding energy (B.E.) of the elements was corrected by C 1s as the reference energy (C 1s = 284.8 eV). A wide scan was performed to detect the presence of total elements in the sample surface, which confirms the purity of the samples as well. The high-resolution scans of the La 3d, Ca 2p, Mn 2p, Fe 2p and O 1s regions were collected. The XPS spectra were fitted using MultiPak Spectrum: ESCA. The Shirley method was used to subtract the spectral background. The dc-magnetization measurements were carried out using a vibrating sample magnetometer attached to the physical property measurement system, Quantum Design Inc., (USA). The dc magnetic measurements were performed on the compact powder sample inside the Teflon capsule. The magnetic data were recorded as a function of temperature and applied magnetic field of ±9 Tesla at fixed temperatures.
Results
Structure and microstructure
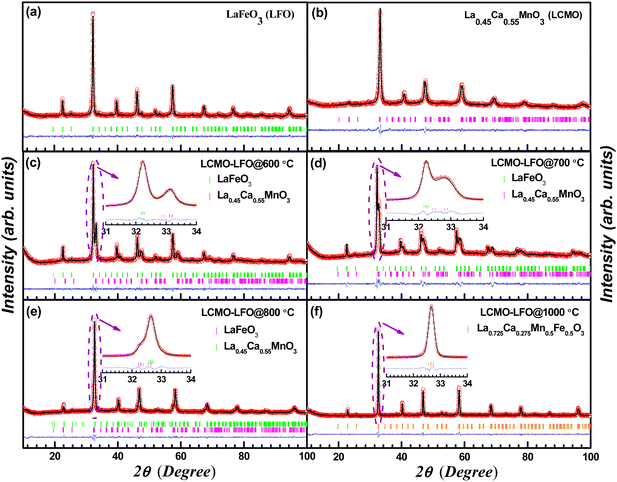
Fig. 1 shows the powder X-ray diffraction patterns of the parent phases LaFeO3 (LFO), La0.45Ca0.55MnO3 (LCMO) and their 1![[thin space (1/6-em)]](https://www.rsc.org/images/entities/char_2009.gif) :
:![[thin space (1/6-em)]](https://www.rsc.org/images/entities/char_2009.gif) 1 composite La0.45Ca0.55MnO3–LaFeO3 (LCMO–LFO) annealed at different temperatures, namely at 600, 700, 800 and 1000 °C. The patterns of LFO and LCMO synthesized at 500 °C can be well indexed with Pbnm space group without any additional reflection confirming the purity of the parent phases (Fig. 1(a) and (b)). The pattern of the LCMO–LFO composite annealed at 600 °C clearly attests the appearance of both phases, and it can be indexed with combined phases (Fig. 1(c)). However, with the increase in annealing temperature, the identity of the parent phases was gradually suppressed, resulting to the formation of a single phase La0.725Ca0.275Mn0.5Fe0.5O3 (Fig. 1(f)). This is clearly evidenced from the enlarged view of the main peaks in the insets of Fig. 1(c)–(e). The evolution of PXRD patterns with annealing temperature supports the formation of the product phase out of the parent phases at the interfaces of the composite grains. The persistence of parent phases was realized up to the annealing temperature of 800 °C (Fig. 1(e)). The refinement parameters and cell constants for all of the samples are summarized in Table 1. It is worth noting that the diffraction peak position of LCMO shifted towards high angle for the 700 and 800 °C annealed samples, which are clear from the enlarged plot between 31–34° (Fig. 1(d) and (e)). This is also reflected in the cell parameters given in Table 1. The cell volume of the LCMO phase increased from 224.350(5) Å3 for the 600 °C annealed sample to 230.768(3) Å3 for the 700 °C sample. Actually, at this point, there should be a coexistence of three phases: LCMO, LFO and the phase formed at the interface. This may be at the origin of the peak broadening in the diffraction patterns for the 700 and 800 °C annealed samples. However, we have continued to refine the patterns with the LCMO and LFO phases only. Up to 800 °C, the LFO phase retains its identity (Fig. 1(e)). For the 1000 °C sample, it results in a single sharp peak, confirming a homogeneous phase formation. This observation is highly consistent with the observed magnetic behaviour discussed in the following section.
1 composite La0.45Ca0.55MnO3–LaFeO3 (LCMO–LFO) annealed at different temperatures, namely at 600, 700, 800 and 1000 °C. The patterns of LFO and LCMO synthesized at 500 °C can be well indexed with Pbnm space group without any additional reflection confirming the purity of the parent phases (Fig. 1(a) and (b)). The pattern of the LCMO–LFO composite annealed at 600 °C clearly attests the appearance of both phases, and it can be indexed with combined phases (Fig. 1(c)). However, with the increase in annealing temperature, the identity of the parent phases was gradually suppressed, resulting to the formation of a single phase La0.725Ca0.275Mn0.5Fe0.5O3 (Fig. 1(f)). This is clearly evidenced from the enlarged view of the main peaks in the insets of Fig. 1(c)–(e). The evolution of PXRD patterns with annealing temperature supports the formation of the product phase out of the parent phases at the interfaces of the composite grains. The persistence of parent phases was realized up to the annealing temperature of 800 °C (Fig. 1(e)). The refinement parameters and cell constants for all of the samples are summarized in Table 1. It is worth noting that the diffraction peak position of LCMO shifted towards high angle for the 700 and 800 °C annealed samples, which are clear from the enlarged plot between 31–34° (Fig. 1(d) and (e)). This is also reflected in the cell parameters given in Table 1. The cell volume of the LCMO phase increased from 224.350(5) Å3 for the 600 °C annealed sample to 230.768(3) Å3 for the 700 °C sample. Actually, at this point, there should be a coexistence of three phases: LCMO, LFO and the phase formed at the interface. This may be at the origin of the peak broadening in the diffraction patterns for the 700 and 800 °C annealed samples. However, we have continued to refine the patterns with the LCMO and LFO phases only. Up to 800 °C, the LFO phase retains its identity (Fig. 1(e)). For the 1000 °C sample, it results in a single sharp peak, confirming a homogeneous phase formation. This observation is highly consistent with the observed magnetic behaviour discussed in the following section.
| Composition and phase | Lattice parameters | Bond distance (Å) | Bond angle (°) | Atomic coordinates | ||||
|---|---|---|---|---|---|---|---|---|
| Atom | x | y | z | |||||
| La0.45Ca0.55MnO3 | ||||||||
| La0.45Ca0.55MnO3 Orthorhombic (S.G. Pbnm) | a = 5.405 (7) Å | 1 × Ca1/La1–O1: 2.4353(3) | ∠Mn1–O1–Mn1: 162.133(3) | La | 0.50604(3) | 0.51900(2) | 0.25000(0) | |
| b = 5.398 (0) Å | 1 × Ca1/La1–O1: 2.6181(4) | ∠Mn1–O2–Mn1: 164.322(3) | Ca | 0.50604(1) | 0.51900(2) | 0.25000(1) | ||
| c = 7.688 (4) Å | 2 × Ca1/La1–O2: 2.4844(2) | Mn | 0.50000(2) | 0.00000(0) | 0.00000(1) | |||
| V = 224.352(5) Å3 | 2 × Ca1/La1–O2: 2.6489(2) | O1 | 0.44410(2) | 0.00000(1) | 0.25000(3) | |||
| R b = 1.80 | 2 × Mn1–O1: 1.9456(2) | O2 | 0.74640(5) | 0.29440(2) | 0.02420(2) | |||
| R f = 1.80 | 2 × Mn1–O2: 1.7736(2) | |||||||
| χ 2 = 1.68 | 2 × Mn1–O2: 2.0817(2) | |||||||
| LaFeO3 Orthorhombic (S.G. Pbnm) | a = 5.556(0) Å | 2 × La1–O1: 2.4496(2) | ∠Fe1–O1–Fe1: 157.084(5) | La | 0.99300(5) | 0.02970(1) | 0.25000(2) | |
| b = 5.568(4) Å | 2 × La1–O1: 2.6920(2) | ∠Fe1–O2–Fe1: 154.031(3) | Fe | 0.00000(0) | 0.50000(2) | 0.00000(1) | ||
| c = 7.845(6) Å | 1 × La1–O2: 2.3855(3) | O1 | 0.71900(5) | 0.30200(2) | 0.02900(0) | |||
| V = 242.737(6) Å3 | 1 × La1–O2: 2.5810(4) | O2 | 0.08000(0) | 0.48500(4) | 0.25000(1) | |||
| R b = 2.26 | 2 × Fe1–O1: 1.9248(2) | |||||||
| R f = 2.81 | 2 × Fe1–O1: 2.0882(3) | |||||||
| χ 2 = 1.13 | 2 × Fe1–O2: 2.0127(2): | |||||||
| LCMO–LFO @600 °C | ||||||||
| LaFeO3 phase Orthorhombic (S.G. Pbnm) | a = 5.555(4) Å | 2 × La1–O1: 2.4488(2) | ∠Fe1–O1–Fe1: 157.086(5) | La | 0.99300(6) | 0.02970(1) | 0.25000(1) | |
| b = 5.560(8) Å | 2 × La1–O1: 2.6911(2) | ∠Fe1–O2–Fe1: 154.013(3) | Fe | 0.00000(1) | 0.50000(3) | 0.00000(0) | ||
| c = 7.843(4) Å | 1 × La1–O2: 2.3852(3) | O1 | 0.71900(5) | 0.30200(2) | 0.02900(1) | |||
| V = 242.34(6) Å3 | 1 × La1–O2: 2.5774(4) | O2 | 0.08000(1) | 0.48500(4) | 0.25000(2) | |||
| R b = 1.64 | 2 × Fe1–O1: 1.9239(2) | |||||||
| R f = 1.58 | 2 × Fe1–O1: 2.0862(2) | |||||||
| χ 2 = 1.12 | 2 × Fe1–O2: 2.0124(2) | |||||||
| La0.45Ca0.55MnO3 phase Orthorhombic (S.G. Pbnm) | a = 5.447(2) Å | 1 × Ca1/La1–O1: 2.4541(4) | ∠Mn1–O1–Mn1: 161.833(3) | La | 0.50600(4) | 0.51900(2) | 0.25000(1) | |
| b = 5.405(0) Å | 1 × Ca1/La1–O1: 2.6218(4) | ∠Mn1–O2–Mn1: 164.399(3) | Ca | 0.50600(3) | 0.51900(1) | 0.25000(0) | ||
| c = 7.618(0) Å | 2 × Ca1/La1–O2: 2.4792(2) | Mn | 0.50000(4) | 0.00000(0) | 0.00000(2) | |||
| V = 224.350(5) Å3 | 2 × Ca1/La1–O2: 2.6442(2) | O1 | 0.44410(3) | 0.00000(1) | 0.25000(3) | |||
| R b = 1.91 | 2 × Mn1–O1: 1.9288(2) | O2 | 0.74640(5) | 0.29440(3) | 0.02430(1) | |||
| R f = 2.72 | 2 × Mn1–O2: 1.7828(2) | |||||||
| χ 2 = 1.12 | 2 × Mn1–O2: 2.0900(2) | |||||||
| LCMO–LFO @700 °C | ||||||||
| LaFeO3 phase Orthorhombic (S.G. Pbnm) | a = 5.551(0) Å | 2 × La1—O1: 2.4475(2) | ∠Fe1–O1–Fe1: 157.086(5) | La | 0.99300(4) | 0.02970(1) | 0.25000(0) | |
| b = 5.557(8) Å | 2 × La1–O1: 2.6896(1) | ∠Fe1–O2–Fe1: 154.013(3) | Fe | 0.00000(0) | 0.50000(1) | 0.00000(1) | ||
| c = 7.829(9) Å | 1 × La1–O2: 2.3849(3) | O1 | 0.71900(5) | 0.30200(2) | 0.02900(1) | |||
| V = 242.155(5) Å3 | 1 × La1–O2: 2.5781(4) | O2 | 0.08000(0) | 0.48500(3) | 0.25000(2) | |||
| R b = 2.29 | 2 × Fe1–O1: 1.9237(2) | |||||||
| R f = 2.33 | 2 × Fe1–O1: 2.0862(2) | |||||||
| χ 2 = 1.49 | 2 × Fe1–O2: 2.0109(2) | |||||||
| La0.45Ca0.55MnO3 phase Orthorhombic (S.G. Pbnm) | a = 5.514 (4) Å | 2 × Ca1/La1–O1: 2.484(2) | ∠Mn1–O1–Mn1: 161.739(2) | La | 0.50600(2) | 0.51900(3) | 0.25000(1) | |
| b = 5.454 (9) Å | 2 × Ca1/La1–O1: 2.6460(2) | ∠Mn1–O2–Mn1: 164.429(2) | Ca | 0.50600(2) | 0.51900(1) | 0.25000(2) | ||
| c = 7.671 (6) Å | 2 × Ca1/La1–O2: 2.5013(1) | Mn | 0.50000(3) | 0.00000(2) | 0.00000(0) | |||
| V = 230.768(3) Å3 | 2 × Ca1/La1–O2: 2.6682(1) | O1 | 0.44410(2) | 0.00000(0) | 0.25000(2) | |||
| R b = 3.90 | 2 × Mn1–O1: 1.9420(1) | O2 | 0.74640(5) | 0.29440(2) | 0.02430(1) | |||
| R f = 2.45 | 2 × Mn1–O2: 1.8023(1) | |||||||
| χ 2 = 1.49 | 2 × Mn1–O2: 2.1117(1) | |||||||
| LCMO–LFO @800 °C | ||||||||
| LaFeO3 phase Orthorhombic (S.G. Pbnm) | a = 5.504(0) Å | 2 × La1–O1: 2.4310(3) | ∠Fe1–O1–Fe1: 157.110(6) | La | 0.99300(6) | 0.02970(1) | 0.25000(0) | |
| b = 5.555(0) Å | 2 × La1–O1: 2.6686(3) | ∠Fe1–O2–Fe1: 154.018(5) | Fe | 0.00000(1) | 0.50000(2) | 0.00000(2) | ||
| c = 7.770(0) Å | 1 × La1–O2: 2.3633(5) | O1 | 0.71900(5) | 0.30200(3) | 0.02900(1) | |||
| V = 237.584(7) Å3 | 1 × La1–O2: 2.5743(4) | O2 | 0.08000(0) | 0.48500(4) | 0.25000(3) | |||
| R b = 3.00 | 2 × Fe1–O1: 1.9112(3) | |||||||
| R f = 3.27 | 2 × Fe1–O1: 2.0780(2) | |||||||
| χ 2 = 1.75 | 2 × Fe1–O2: 1.9937(3) | |||||||
| La0.45Ca0.55MnO3 phase Orthorhombic (S.G. Pbnm) | a = 5.487(8) Å | 1 × Ca1/La1–O1: 2.4721(3) | ∠Mn1–O1–Mn1: 161.987(3) | La | 0.50600(3) | 0.51900(5) | 0.25000(2) | |
| b = 5.489(1) Å | 1 × Ca1/La1–O1: 2.4721(9) | ∠Mn1–O2–Mn1: 164.361(7) | Ca | 0.50600(3) | 0.51900(4) | 0.25000(1) | ||
| c = 7.7410(0) Å | 2 × Ca1/La1–O2: 2.5126(4) | Mn | 0.50000(2) | 0.00000(1) | 0.00000(2) | |||
| V = 233.200(4) Å3 | 2 × Ca1/La1–O2: 2.6801(4) | O1 | 0.44410(3) | 0.00000(1) | 0.25000(3) | |||
| R b = 1.82 | 2 × Mn1–O1: 1.9592(2) | O2 | 0.74640(6) | 0.29440(3) | 0.02430(0) | |||
| R f = 2.14 | 2 × Mn1–O2: 1.8018(5) | |||||||
| χ 2 = 1.75 | 2 × Mn1–O2: 2.1153(2) | |||||||
| LCMO–LFO @1000 °C | ||||||||
| La0.725Ca0.275Mn0.5Fe0.5O3: (100%) Orthorhombic (S.G. Pbnm) | a = 5.494(0) Å | 1 × Ca1/La1–O1: 2.4752(3) | ∠Mn1/Fe1–O1–Mn1/Fe1: 161.971(2) | La | 0.50600(4) | 0.51900(4) | 0.25000(1) | |
| b = 5.478(0) Å | 1 × Ca1/La1–O1: 2.6571(2) | ∠Mn1/Fe1–O2–Mn1/Fe1: 164.356(2) | Ca | 0.50600(3) | 0.51900(2) | 0.25000(2) | ||
| c = 7.744(0) Å | 2 × Ca1/La1–O2: 2.5127(1) | Mn | 0.50000(1) | 0.00000(0) | 0.00000(2) | |||
| V = 233.100(4) Å3 | 2 × Ca1/La1–O2: 2.6799(1) | O1 | 0.44410(2) | 0.00000(1) | 0.25000(0) | |||
| R b = 3.15 | 2 × Mn1/Fe1–O1: 1.9602(2) | O2 | 0.74640(3) | 0.29440(2) | 0.02430(0) | |||
| R f = 4.63 | 2 × Mn1/Fe1–O2: 1.8015(1) | |||||||
| χ 2 = 1.26 | 2 × Mn1/Fe1–O2: 2.1139(1) | |||||||
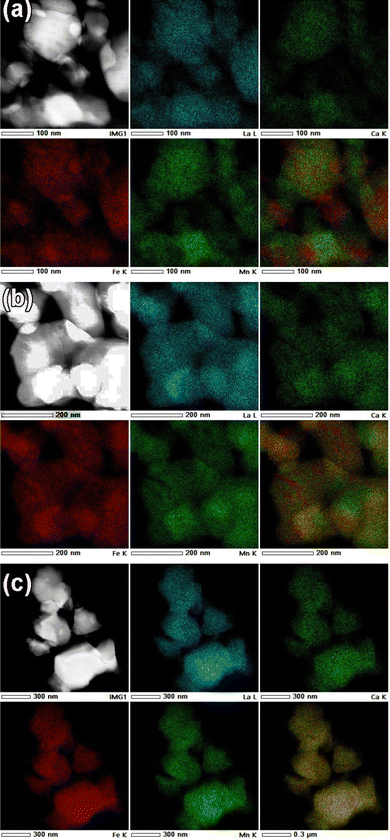
The FE-SEM micrographs of nanocrystalline La0.45Ca0.55MnO3 and LaFeO3, as well as for the composite, are shown in supplementary Fig. S1 (ESI†). The particle size of LCMO is rather small compared to that of the LFO (Fig. S1(a) and (b), ESI†). The temperature evolution of the particle size of the composite revealed the increase in particle size with the temperature, as expected. The cationic ratio obtained from EDX analysis for the parent phases matches well with the nominal cationic composition (Fig. S2 and S3, ESI†). More importantly, the gradual progress of the interface reaction is adequately probed from elemental mapping. A comparison of the elemental mapping for the LCMO–LFO composite annealed at 700 °C and 1000 °C is shown in Fig. 2. Fig. 2(a) clearly reveal the appearance of LCMO and LFO grains. The Ca-depleted encircled regions (numerically marked) in the Ca panel is complemented by brighter spots in the La panel with corresponding numeric values. These brighter spots in the La panel indicated the LFO grains. This is substantiated by the appearance of the Mn-depleted region at the same positions in the Mn panel and the brighter spots in the Fe panel, as shown by the numerically encircled zones. Similar features in the elemental mapping are noticed for the 600 °C and 800 °C samples (Fig. S4 and S6, ESI†). The separated grain-type features of LCMO and LFO are completely suppressed in the 1000 °C annealed samples, resulting in a homogeneous distribution of each element present in the samples, as shown in Fig. 2(b). This is further evidenced from the EDX analysis of the 1000 °C annealed samples corresponding to the composition La0.725Ca0.275Mn0.5Fe0.5O3 (Fig. S7, ESI†). However, the EDX elemental ratios of the 600, 700 and 800 °C annealed samples show variable ratios depending on the probed area (Fig. S4–S6, ESI†). This observation suggests the progressive reaction at the interfaces of LCMO and LFO to produce the new perovskite of average composition. However, the separate diffraction peaks of the new phase are not observed, which may possibly be due to very similar cell parameters. The product phase developed at the interface at lower temperatures is likely to have Mn and Fe ordering, and it gets randomized at higher temperature. A schematic diagram of the inter-growth phase formation at the interface of the pristine phases with cation ordering is shown in Fig. S8 (ESI†). A significant fraction of the product interface phase with Mn and Fe ordering is expected to show dominating properties.
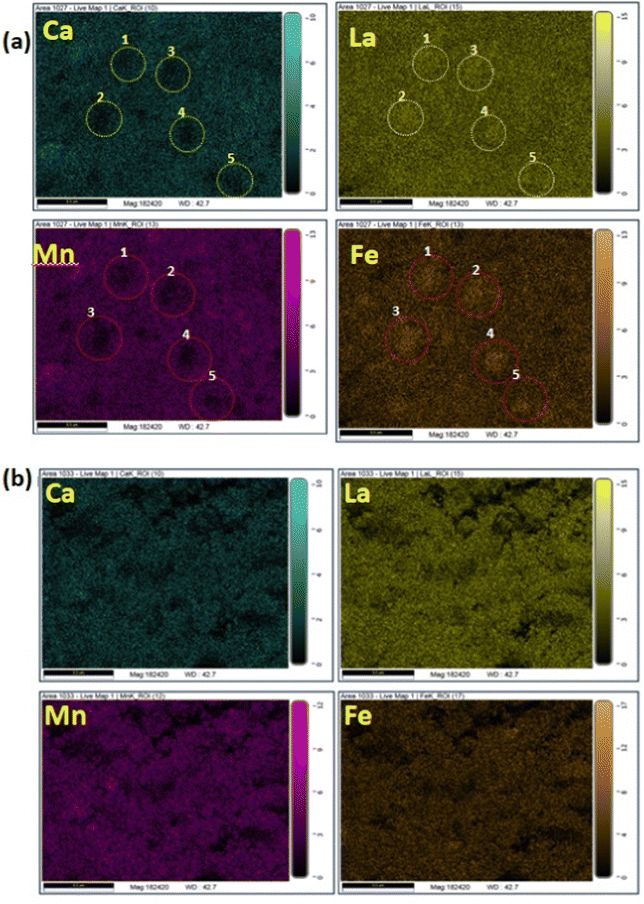 | ||
| Fig. 2 The elemental mapping of the La0.45Ca0.55MnO3–LaFeO3 (LCMO–LFO) composite annealed at: (a) 700 °C and (b) 1000 °C. | ||
TEM analysis
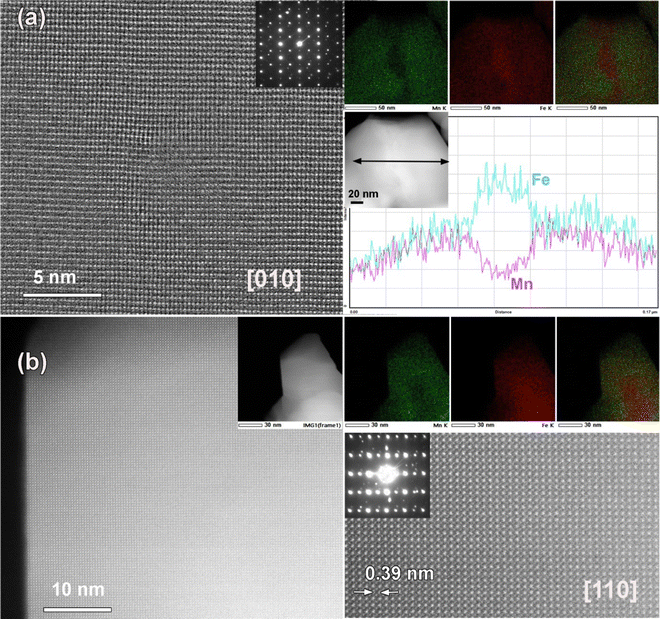
In order to substantiate our proposed model of the interfacial phase formation, as shown in Fig. S8 (ESI†), we have carried out TEM, EDX, ED and HAADF-STEM along the main zone axes of the cubic structure: [010] and [110]. We have shown the EDX-STEM elemental mapping of all three samples sintered at 700, 800 & 1000 °C in Fig. 3. The EDX mapping panels in Fig. 3(a) and (b) for the 700 °C and 800 °C annealed composites, respectively, clearly reveal the coexistence of pristine phases, along with the product phases formed in the forms of thin lamellas at the interfaces. However, it is clearly visualized from the lower panel in Fig. 3(c) that all of the elements are practically homogeneously distributed, unlike the contrasting features existing in Fig. 3(a) and (b) for the 700 °C & 800 °C annealed composites. These results are in corroboration with the FE-SEM analysis presented in the preceding section. This supported our proposed model, and this is further strengthened from the magnetic measurements. We have further carried out high-resolution HAADF-STEM along the [010] and [110] directions together with ED and simultaneously acquired EDX-STEM elemental mapping for the 800 °C annealed sample for a specific crystallite (Fig. 4a and b). The ED shows the well crystalline feature of the sample with a typical perovskite cell parameter. The EDX-STEM mapping along with the Fe/Mn elemental line scan profile across the Fe/Mn lamella over 20 nm for the 800 °C annealed sample is shown on the right panel of Fig. 4(a). It nicely depicts the Fe-rich region at the center of the crystallite and the existence of a comparable amount of Fe and Mn on both sides of the Fe-dominant region. This further authenticates our model. However, our high-resolution HAADF-STEM images do not directly support the chess-board type ordering of Mn (Z = 25) and Fe (Z = 26) due to their adjacent positions in the periodic table. In contrast, the indirect evidence of ordering is supported from the magnetization data discussed in the following section. It is worthwhile to mention that ED is also unable to detect the same results due to the structural identity of all of the pristine and intergrowth phases. The corresponding low-magnification and high-resolution HAADF-STEM image along the [110] direction, ED pattern and EDX-STEM elemental mapping are taken from the same crystallite shown in the lower panel in Fig. 4(b).XPS study
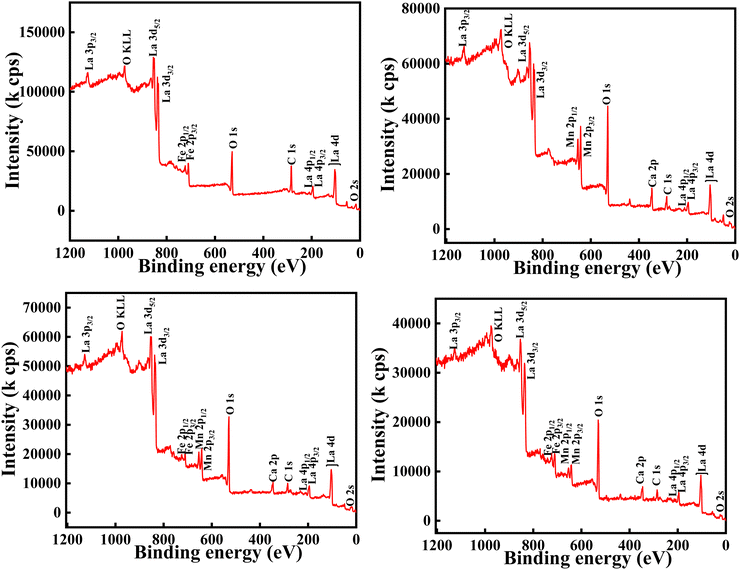
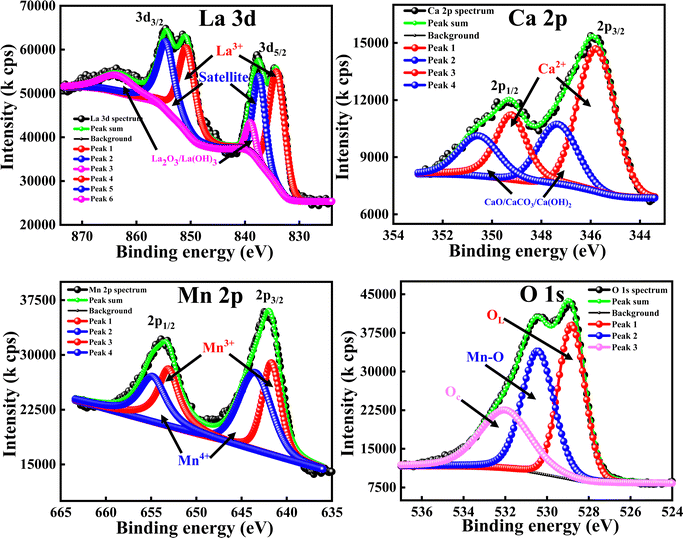
The XPS analysis was carried out to obtain a clear understanding of the oxidation states and elemental compositions present in all of the developed samples. All of the peaks were calibrated with respect to the C 1s peak positioned at 284.6 eV. The wide-scan XPS spectra of all of the samples are depicted in Fig. 5, which clearly reveal that there are no foreign elements present on the surfaces of the material. In order to determine the oxidation state of the composition, the high-resolution scans of the La 3d, Fe 2p and O 1s spectra of the LaFeO3 (LFO) sample were analysed and are shown in Fig. 6. Similar to this, Fig. 7 shows the high-resolution scans of the La 3d, Ca 2p, Mn 2p, and O 1s spectra of La0.45Ca0.55MnO3 (LCMO). Similarly, the high-resolution scans of the La 3d, Ca 2p, Mn 2p, Fe 2p and O 1s spectra of LCMO–LFO annealed at 600 °C & 1000 °C were analysed, and are shown in Fig. 8 and 9. The high-resolution scans of all of the elements present in all of the samples were deconvoluted. A detailed analysis of different elemental compositions, along with the deconvoluted peaks corresponding to the different B.E.'s, are summarised in Table 2.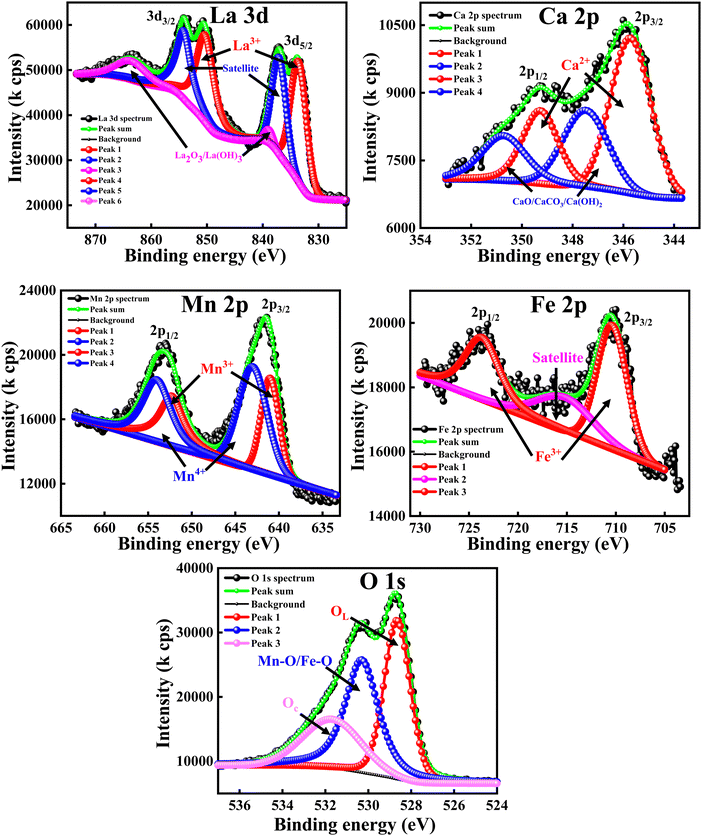 | ||
| Fig. 8 High-resolution XPS spectra of La 3d, Ca 2p, Mn 2p, Fe 2p and O 1s for LCMO–LFO annealed at 600 °C. | ||
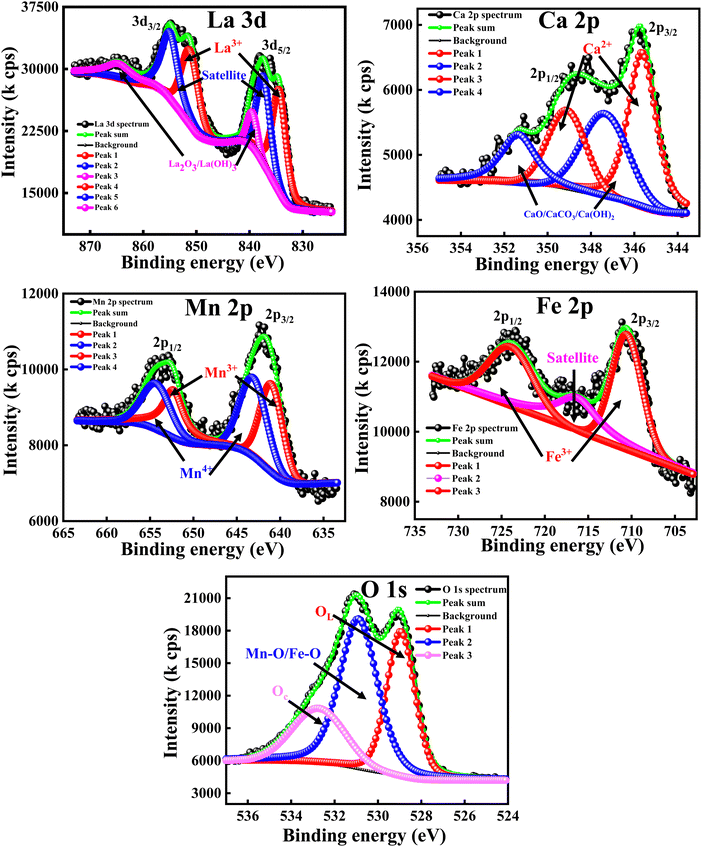 | ||
| Fig. 9 High-resolution XPS spectra of La 3d, Ca 2p, Mn 2p, Fe 2p and O 1s for LCMO–LFO annealed at 1000 °C. | ||
| Composition | La 3d spectrum | Mn 2p spectrum | O 1s spectrum | |||
|---|---|---|---|---|---|---|
| B.E. (eV) | Area (%) | B.E. (eV) | Area (%) | B.E. (eV) | Area (%) | |
| LaFeO3(LFO) | 834.12 (3d5/2, La3+) | 27.11 | 529.14 (OL) | 54.41 | ||
| 837.55 (satellite) | 20.91 | 531.45 (Fe–O) | 34.31 | |||
| 838.10 (La2O3/La(OH)3) | 14.14 | 533.07 (Oc) | 11.28 | |||
| 850.88 (3d3/2, La3+) | 21.56 | |||||
| 854.70 (satellite) | 15.66 | |||||
| 862.00 (La2O3/La(OH)3) | 0.62 | |||||
| La0.45Ca0.55MnO3 (LCMO) | 834.48 (3d5/2, La3+) | 26.49 | 641.68 (2p3/2, Mn3+) | 24.53 | 528.82 (OL) | 38.15 |
| 837.50 (satellite) | 14.14 | 643.84 (2p3/2, Mn4+) | 33.33 | 530.82 (Mn/Fe)–O | 34.12 | |
| 839.20 (La2O3/La(OH)3) | 3.31 | 653.05 (2p1/2, Mn3+) | 20.29 | 532.01 (Oc) | 27.73 | |
| 851.20 (3d3/2, La3+) | 25.83 | 654.64 (2p1/2, Mn4+) | 21.85 | |||
| 854.44 (satellite) | 21.09 | |||||
| 863.58 (La2O3/La(OH)3) | 9.14 | |||||
| LCMO–LFO@600 °C | 833.56 (3d5/2, La3+) | 25.36 | 641.22 (2p3/2, Mn3+) | 22.92 | 528.68 (OL) | 41.44 |
| 837.06 (satellite) | 18.75 | 643.59 (2p3/2, Mn4+) | 31.96 | 530.33 (Mn/Fe)–O | 34.07 | |
| 838.92 (La2O3/La(OH)3) | 1.44 | 652.48 (2p1/2, Mn3+) | 22.04 | 531.70 (Oc) | 24.49 | |
| 850.32 (3d3/2, La3+) | 26.90 | 654.24 (2p1/2, Mn4+) | 23.08 | |||
| 854.12 (satellite) | 19.65 | |||||
| 863.45 (La2O3/La(OH)3) | 7.90 | |||||
| LCMO–LFO@1000 °C | 834.42 (3d5/2, La3+) | 25.16 | 641.20 (2p3/2, Mn3+) | 27.86 | 528.94 (OL) | 38.40 |
| 837.37 (satellite) | 19.69 | 643.59 (2p3/2, Mn4+) | 31.19 | 530.89 (Mn/Fe)–O | 41.24 | |
| 839.48 (La2O3/La(OH)3) | 5.16 | 652.32 (2p1/2, Mn3+) | 18.00 | 532.73 (Oc) | 20.36 | |
| 851.20 (3d3/2, La3+) | 22.40 | 654.57 (2p1/2, Mn4+) | 22.95 | |||
| 854.98 (satellite) | 19.25 | |||||
| 864.65 (La2O3/La(OH)3) | 8.34 | |||||
The slow scan of the La 3d spectra in all of the samples showed a broad peak that is deconvoluted into three additional peaks, indicating the presence of La3+, satellite peaks61 and La2O3 or La(OH)3,62 respectively. The presence of La2O3 or La(OH)3 can be due to the chemisorption of oxygen and moisture with the chemically active La element. It is very difficult to predict the contributions of each La2O3 and La(OH)3 separately, so the peaks located at 838–839.50 eV (3d5/2) and 862.00–864.65 eV (3d3/2) correspond to the mixed composition of La2O3 and La(OH)3, respectively. It is clearly evident that the change in the elemental composition, temperature and intimate mixing of the samples did not affect the composition of the La3+ ions. The deconvolution of the slow scan of the Ca 2p spectra showed the presence of Ca2+ ions, and CaO, CaCO3 or Ca(OH)2 species in the La0.45Ca0.55MnO3 (LCMO), (LCMO)0.5(LFO)0.5 samples annealed at 600 °C & 1000 °C. The presence of CaO, CaCO3 or Ca(OH)2 can be due to the interaction of oxygen, carbon dioxide and moisture content present in the atmosphere with the chemically active Ca2+ ions, leading to the formation of the former chemisorbed species on the surface of the material.63 It is very difficult to decide the B.E. corresponding to each CaO, CaCO3 or Ca(OH)2 species, so the undesired compound chemisorbed on the samples may be a mixture of all three.
The deconvoluted peaks of the slow scan of Fe 2p in LaFeO3 (LFO), of (LCMO)0.5(LFO)0.5 annealed at 600 °C and 1000 °C samples, indicated the presence of Fe in +3 oxidation state only.64 However, in the LaFeO3 (LFO) sample, the B-site is fully occupied by Fe3+ ions. In the (LCMO)0.5(LFO)0.5 sample annealed at 600 °C and 1000 °C, Fe3+ is occupying 50% of B site. The deconvolution of the slow scan of the Mn 2p spectra in the (LCMO)0.5(LFO)0.5 samples annealed at 600 °C & 1000 °C showed the presence of mixed oxidation states of the Mn metal, i.e., Mn3+ and Mn4+ ions.65 It was clearly observed that there is a greater presence of Mn4+ ions than Mn3+ ions in the three samples (reflected in Table 2). However, the percentage of Mn3+ and Mn4+ ions occupying the B-site was calculated using the peak area done by XPS peak fit software, which is around 44.82 and 55.18, 22.48 and 27.52, 22.93 and 27.07 in the LCMO, (LCMO)0.5(LFO)0.5 annealed at 600 °C and (LCMO)0.5(LFO)0.5 annealed at 1000 °C. Moreover, the percentage of occupancy of Mn ions in (LCMO)0.5(LFO)0.5 annealed at 600 °C and 1000 °C is calculated based on the peak area, which pertains to the Mn 2p spectra only, so the total percentage will be 100. However, the B site is partially occupied by Fe3+ ions in (LCMO)0.5(LFO)0.5 annealed at 600 °C and 1000 °C. Therefore, the percentage of occupancy of Mn ions in the B site will be 50%. The resulting percentage of occupancy of Mn ions in the B site matches with the stoichiometric composition of the three samples. Similarly, the high-resolution O 1s spectra of all samples showed a broad peak and they are deconvoluted into three subpeaks, corresponding to the lattice oxygen (OL) having the lowest B.Es, M–O bond (M = Mn/Fe) having the middle B.Es, and chemisorbed oxygen (Oc) having the highest B.Es.61,66 The crucial observation from the XPS analysis is that the percentage of occupancy of La3+ ions in the A-site, Fe3+, Mn3+ and Mn4+ ions in the B-site is exactly matching with the stoichiometric composition/ratio of the samples. Moreover, the mixed occupancy of Mn and Fe in B-site is likely to influence the magnetic properties of nanocomposite perovskite materials.
Magnetic properties
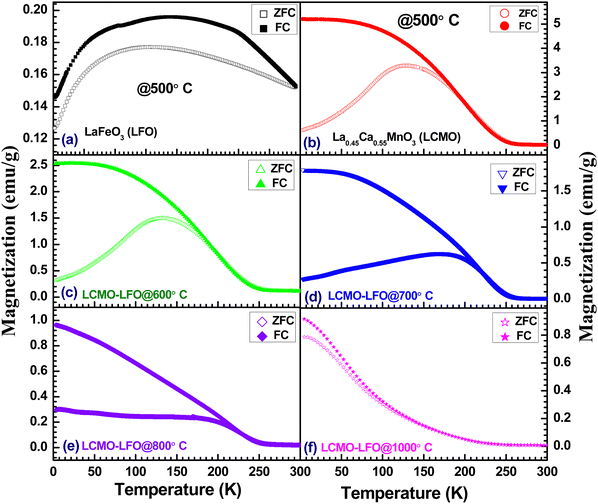
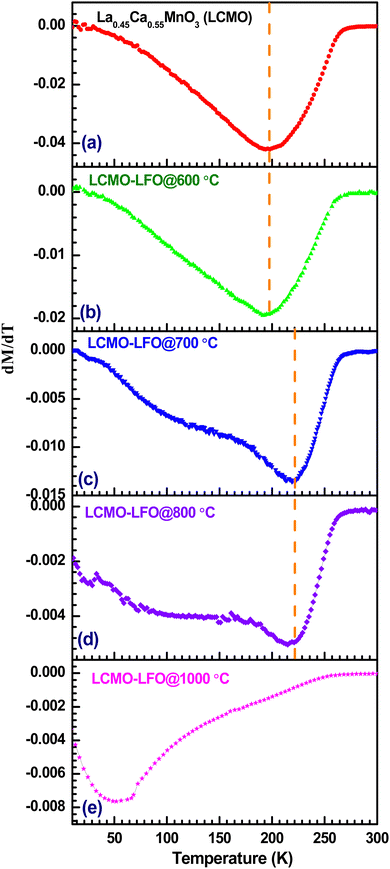
Fig. 10 shows the temperature-dependent magnetization of LFO, LCMO and their composites annealed at different temperatures under an applied magnetic field of 100 Oe. The observed magnetic property of LFO nanoparticles is shown in Fig. 10(a). This is in good agreement with the reported magnetization of LaFeO3 nanoparticles.67 There is a large thermomagnetic irreversibility between the ZFC-FC data. This could be due to the random freezing of the magnetic moment cooled under zero applied field, or there can be magnetic frustration in the system due to competing magnetic interaction. The isothermal magnetization measurements shown in Fig. 11(a) suggest the ferromagnetic feature of LFO nanoparticles. LFO is an antiferromagnetic material with a slight spin canting, which is responsible for the weak ferromagnetic behavior.68,69 In addition to the canted internal spin, another possible source of the ferromagnetic component is the uncompensated disordered surface spins arising out of the relaxed superexchange interaction.70–72 The bulk La0.45Ca0.55MnO3 is a typical charge ordered system with the charge ordering temperature (TCO) at 220 K.73,74 However, with the decrease in particle size in nanodomains for manganite, the TCO decreases and is eventually suppressed below a critical size.75 In the present work, the ZFC data of La0.45Ca0.55MnO3 show a broad hump around 130 K, whereas the FC data continue to increase below 250 K (Fig. 10(b)). The ZFC-FC data show bifurcation below 200 K, which may be related to the magnetic inhomogeneity of the system. There is a jump in magnetization near zero applied field with a slight opening of the loop, but it lacks the saturation even at 9 Tesla (Fig. 11(b)), suggesting the coexistence of ferromagnetic and antiferromagnetic phases. The LCMO–LFO composite annealed at 600 °C shows a very similar feature as the pristine LCMO phase (Fig. 10(c)). The M(H) curves for LCMO and LCMO–LFO annealed at 600 °C show similar types of behavior (Fig. 11(b)&(c)). The temperature derivative (dM/dT) plots of both the LCMO and LCMO–LFO annealed at 600 °C exhibit broad minima centered around 200 K, suggesting the onset temperature (Fig. 12(a) and (b)). These indicate the dominating magnetic behavior of La0.45Ca0.55MnO3 in the composite phase annealed at lower temperature. This also is clear from the high value of magnetization of LCMO compared to LFO. However, a significant change in magnetization is noticed for the 700 and 800 °C annealed samples (Fig. 10(d) and (e)). This is consistent with the observation of the change in the PXRD pattern in Fig. 1(d) and (e), as discussed in the preceding section. The magnetization value decreases, but the transition temperature shifted upwards by about 25 K, which is clearly observed from the dM/dT curves shown in Fig. 12(d) and (e). The M(H) curves indicate the occurrence of ferromagnetic and antiferromagnetic phases (Fig. 11(d) and (e)). These upward shifts in the ordering temperature can be attributed to the development of new phases across the interfaces of LCMO and LFO, where a possible ordering of Mn and Fe takes place, which is discussed below. On further increase in the annealing temperature to 1000 °C, no long-range ordering at high temperature is apparent (Fig. 10(f)). This is also indicated from the dM/dT plot, as shown in Fig. 12(f). This can be ascribed to the complete randomization of Mn and Fe in the interfacial product phase of La0.725Ca0.275Mn0.5Fe0.5O3. This is consistent with the homogeneous distribution of Mn and Fe observed in elemental mapping (Fig. 2(b)). This result is very much consistent with the reported results for La1−xAxFe0.5Mn0.5O3 perovskites.57,58 However, an opening in the hysteresis loop and reduction in magnetization are observed at 3 K, which suggests that there are residual ferromagnetic droplets in the system (Fig. 11(f)). These results suggest that by controlling the annealing temperature, a possible ordering of Mn and Fe in the interface reaction product of LCMO and LFO can be achieved. Such ordering of Mn and Fe was reported in a 1![[thin space (1/6-em)]](https://www.rsc.org/images/entities/char_2009.gif) :
:![[thin space (1/6-em)]](https://www.rsc.org/images/entities/char_2009.gif) 1 ratio of the LaMnO3 and LaFeO3 superlattices, but not in the bulk sample.
1 ratio of the LaMnO3 and LaFeO3 superlattices, but not in the bulk sample.
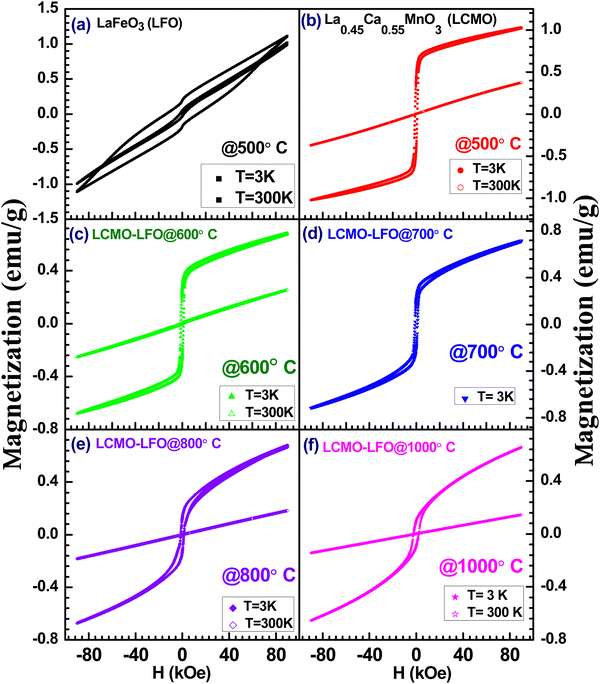 | ||
| Fig. 11 Field-dependent isothermal magnetization of (a) LaFeO3 (LFO), (b) La0.45Ca0.55MnO3 (LCMO) and LCMO–LFO composite annealed at: (c) 600 °C, (d) 700 °C, (e) 800 °C and (f) 1000 °C. | ||
Now, we will discuss the possibility of Mn and Fe ordering across the LCMO–LFO interfaces to understand the observed magnetic behaviour for the 700 and 800 °C annealed samples. The suppression of charge ordering with the evolution of the ferromagnetic phase upon the reduction in the particle size is reported for several manganite systems including (La,Ca)–Mn–O.75–78 On the other hand, the TCO increases with the increase in particle size.75 It is reported that the La0.45Ca0.55MnO3 nanoparticle shows TCO at 235 K, and bulk synthesized at 1400 °C exhibits TCO at 250 K.79 It should also be noted that the TCO steeply changed with a Ca-concentration above 0.5 in La1−xCaxMnO3.80 Thus, a slight change in stoichiometry may abruptly change the ordering temperature. The phase diagram of La1−xCaxMnO3 revealed that the TCO for the bulk La0.45Ca0.55MnO3 composition is 220 K.74,80 The observed magnetic transition in the La0.45Ca0.55MnO3–LaFeO3 composite derived from the minima in the dM/dT plots for the 700 and 800 °C annealed samples is 225 K (Fig. 12(c) and (d)). This transition point is 5 K above the TCO value for the bulk La0.45Ca0.55MnO3 sample.73,74,81 If we consider that the transition at 225 K for the 700 and 800 °C annealed samples is related to the TCO of bulk La0.45Ca0.55MnO3 (where its particle size in composite increases with the annealing temperature), then it is difficult to rationalize the observation for the 1000 °C annealed sample. Moreover, this consideration also fails to account for the similar transition temperature of the 700 and 800 °C samples. Interestingly, it is close to the reported ferromagnetic TC = 230 K of the LaMn0.5Fe0.5O3 thin film superlattice of 1/1 stacking, confirming the alternate layer ordering of Fe3+ and Mn3+.36 The B-site cation ordering for LaFe0.5Mn0.5O3 perovskites has not been reported yet in polycrystalline samples. In La1−xAxFe0.5Mn0.5O3 (A = Ca, Sr and Pb; x = 0 & 0.25), neither the A-site radius nor the hole doping show a significant role in the magnetic properties, and all of the compositions fail to exhibit long-range ordering like LaMn0.5Fe0.5O3.57 There is also no evidence of long-range ordering in La1−xBaxFe0.5Mn0.5O3 (x = 0.25, 0.33 and 0.50).58 However, the rhombohedral (R![[3 with combining macron]](https://www.rsc.org/images/entities/char_0033_0304.gif) c) Bi0.5La0.5Mn0.5Fe0.5O3 and Bi0.5Sr0.5Mn0.5Fe0.5O3 exhibit canted antiferromagnetic ordering at 220 K and 226 K, respectively, due to the ordering of Fe3+ and Mn3+/Mn4+.81 The interaction between Fe3+ and Mn4+ is weakly ferromagnetic based on the Goodenough–Kanamori rule.37 However, an antiferromagnetic ordering of Fe3+ and Mn4+ below 226 K is reported in Bi0.5Sr0.5Mn0.5Fe0.5O3.81 The magnetic property is also sensitive to the sample preparation condition.81 This contrasting behaviour of the Bi content composition has been ascribed to the stereochemically active 6s2 lone pair of Bi3+, which influences the structure, as well as the physical properties.81,82 The above discussion and consideration of our observed magnetic data lead us to conclude that the possible ordering of Fe3+(d5) and Mn3+(d4)/Mn4+(d3) takes place across the interface of La0.45Ca0.55MnO3 and LaFeO3 nanoparticles with the formation of La0.725Ca0.275Mn0.5Fe0.5O3. The possible superexchange interactions are Fe3+–O–Fe3+, Mn3+–O–Mn3+, Mn4+–O–Mn4+, Fe3+–O–Mn3+ and Fe3+–O–Mn4+. According to the Goodenough–Kanamori rules, the Fe3+–O–Mn4+ interaction is ferromagnetic, whereas other interactions are antiferromagnetic in nature.
c) Bi0.5La0.5Mn0.5Fe0.5O3 and Bi0.5Sr0.5Mn0.5Fe0.5O3 exhibit canted antiferromagnetic ordering at 220 K and 226 K, respectively, due to the ordering of Fe3+ and Mn3+/Mn4+.81 The interaction between Fe3+ and Mn4+ is weakly ferromagnetic based on the Goodenough–Kanamori rule.37 However, an antiferromagnetic ordering of Fe3+ and Mn4+ below 226 K is reported in Bi0.5Sr0.5Mn0.5Fe0.5O3.81 The magnetic property is also sensitive to the sample preparation condition.81 This contrasting behaviour of the Bi content composition has been ascribed to the stereochemically active 6s2 lone pair of Bi3+, which influences the structure, as well as the physical properties.81,82 The above discussion and consideration of our observed magnetic data lead us to conclude that the possible ordering of Fe3+(d5) and Mn3+(d4)/Mn4+(d3) takes place across the interface of La0.45Ca0.55MnO3 and LaFeO3 nanoparticles with the formation of La0.725Ca0.275Mn0.5Fe0.5O3. The possible superexchange interactions are Fe3+–O–Fe3+, Mn3+–O–Mn3+, Mn4+–O–Mn4+, Fe3+–O–Mn3+ and Fe3+–O–Mn4+. According to the Goodenough–Kanamori rules, the Fe3+–O–Mn4+ interaction is ferromagnetic, whereas other interactions are antiferromagnetic in nature.
The above claim on the temperature-controlled cation ordering in the product phase of the topotactic interface reaction is strongly substantiated by the formation of the B-site ordered double perovskite La2MnCoO6 across the interface of the LaMnO3 and LaCoO3 perovskite nanocomposite. LaMnO3 is an antiferromagnetic insulator with TN ∼ 140 K.83 The rhombohedral R![[3 with combining macron]](https://www.rsc.org/images/entities/char_0033_0304.gif) c phase of LaCoO3 exhibits a spin state transition over a wide temperature range.84,85 On the other hand, the monoclinic P21/n phase of La2MnCoO6 with an ordered stacking of the B-site Mn4+ and Co2+exhibits a ferromagnetic transition at TC = 225 K.42 However, the orthorhombic Pbnm phase with a random distribution of B-site cations has TC ∼ 150 K, along with the spin glass-type behavior at low temperature.42,49,86,87 In the present investigation, we have also prepared nanocomposites with the ratio of 1
c phase of LaCoO3 exhibits a spin state transition over a wide temperature range.84,85 On the other hand, the monoclinic P21/n phase of La2MnCoO6 with an ordered stacking of the B-site Mn4+ and Co2+exhibits a ferromagnetic transition at TC = 225 K.42 However, the orthorhombic Pbnm phase with a random distribution of B-site cations has TC ∼ 150 K, along with the spin glass-type behavior at low temperature.42,49,86,87 In the present investigation, we have also prepared nanocomposites with the ratio of 1![[thin space (1/6-em)]](https://www.rsc.org/images/entities/char_2009.gif) :
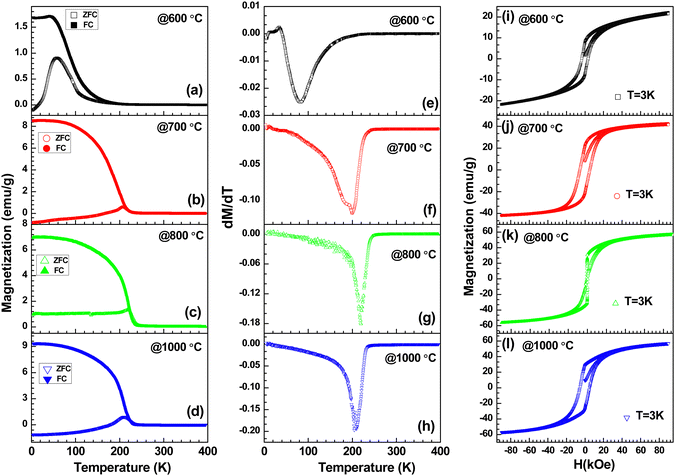
:![[thin space (1/6-em)]](https://www.rsc.org/images/entities/char_2009.gif) 1 of LaMnO3 and LaCoO3, i.e., LMO–LCO, and these were annealed at four different temperatures under a similar condition to that used for the LCMO–LFO nanocomposite discussed in the preceding sections. The XRD patterns for the LMO–LCO series of samples are shown in Fig. S9 (ESI†), confirming the purity of the phases. LaMnO3 and LaCoO3 were prepared at 500 °C by sol–gel method. Fig. 13 shows the temperature-dependent ZFC-FC magnetization, temperature derivative (dM/dT) curves and isothermal magnetization curves measured at 3 K for LMO–LCO composites annealed at 600, 700, 800 and 1000 °C. The magnetization curve of the 600 °C annealed sample in Fig. 13(a) shows the typical magnetization behaviour observed for both the LaMnO388,89 and LaCoO3 nanoparticles.90,91 The dM/dT curve shows a minimum at ∼80 K and a hysteresis loop of the typical ferromagnetic feature. This can be related to the surface ferromagnetism of the nanoparticles. This practically suggests no occurrence of a significant interface reaction across the grain boundary of LaMnO3 and LaCoO3.
1 of LaMnO3 and LaCoO3, i.e., LMO–LCO, and these were annealed at four different temperatures under a similar condition to that used for the LCMO–LFO nanocomposite discussed in the preceding sections. The XRD patterns for the LMO–LCO series of samples are shown in Fig. S9 (ESI†), confirming the purity of the phases. LaMnO3 and LaCoO3 were prepared at 500 °C by sol–gel method. Fig. 13 shows the temperature-dependent ZFC-FC magnetization, temperature derivative (dM/dT) curves and isothermal magnetization curves measured at 3 K for LMO–LCO composites annealed at 600, 700, 800 and 1000 °C. The magnetization curve of the 600 °C annealed sample in Fig. 13(a) shows the typical magnetization behaviour observed for both the LaMnO388,89 and LaCoO3 nanoparticles.90,91 The dM/dT curve shows a minimum at ∼80 K and a hysteresis loop of the typical ferromagnetic feature. This can be related to the surface ferromagnetism of the nanoparticles. This practically suggests no occurrence of a significant interface reaction across the grain boundary of LaMnO3 and LaCoO3.
The increase in annealing temperature to 700 °C and above in the ZFC-FC magnetization curves shown in Fig. 13(b)–(d) resembles the typical behaviour reported for La2MnCoO6.42,49,86,87 There is a huge increase in magnetic transition temperature from 80 K for the 600 °C annealed LMO–LCO to 200 K for the 700 °C annealed sample (Fig. 13(b)). Furthermore, the onset of ferromagnetic transitions are 220 and 210 K for the 800 and 1000 °C annealed samples, respectively (Fig. 13(c) and (d)). The transition temperatures are determined from the minima in the dM/dT curves shown in the middle panel of Fig. 13. A slight decrease in TC for the 1000 °C annealed sample may be related to the anti-site disordering effect in La2MnCoO6.42,49,86,87 The isothermal magnetization curves shown in Fig. 13(j)–(l) are in corroboration with the reported hysteresis loops for La2MnCoO6.42,49,86,87 This result can be only be rationalized to the formation of cation-ordered La2MnCoO6 through the topotactic reaction at the interface of the grain boundaries between LaMnO3 and LaCoO3. The ferromagnetic transition observed is associated with the Mn4+–O–Co2+ superexchange interaction.
Conclusions
In summary, we have investigated the temperature evolution of the topotactic reaction across the grain boundary of the perovskite nanocomposites La0.45Ca0.55MnO3–LaFeO3 (LCMO–LFO) and LaMnO3–LaCoO3 (LMO–LCO). The pristine nanostructured oxides, as well as their composites, were characterized by PXRD, FE-SEM, EDX, elemental mapping, as well as TEM, EDX, ED and HAADF-STEM, XPS and magnetization measurements. The well-known charge ordered antiferromagnetic manganite La0.45Ca0.55MnO3 in its nano-dimension exhibits surface ferromagnetism due to the relaxation of superexchange at the surface. Similarly, the nanostructured antiferromagnetic LaFeO3 (TN ∼740 K) also exhibits weak ferromagnetism due to inner spin canting, as well as surface effect. The magnetic property of the LCMO–LFO nanocomposite is dominated by the contribution of the La0.45Ca0.55MnO3 phase at 600 °C annealing. The magnetic property of the LCMO–LFO composite is sensitive to the annealing temperature. TEM (HAADF-STEM), EDX-STEM elemental mapping confirms the formation of the intergrowth phase at lower temperature with a possible ordering of the cation, which was completely randomized at higher temperature. The LCMO–LFO composite clearly demonstrates the progressive dominance of the interface reaction product phase on magnetic properties of the composite system depending on the processing temperature. It revealed the cationic ordering in the product phase formed at lower temperatures. Accordingly, for the first time, we observed the Mn and Fe ordering in the product phase for the 700 and 800 °C annealed samples, where the observed TC ∼225 K is in good agreement with the reported value of 230 K in the 1![[thin space (1/6-em)]](https://www.rsc.org/images/entities/char_2009.gif) :
:![[thin space (1/6-em)]](https://www.rsc.org/images/entities/char_2009.gif) 1 superlattice of LaMnO3/LaFeO3 with ordered Mn and Fe. The low temperature ordering of Mn and Fe is completely randomized by annealing at 1000 °C, resulting in a lack of magnetic ordering as observed in the bulk La1−xAxFe0.5Mn0.5O3 perovskites. The temperature-controlled cationic ordering in the interfacial product phase formed by topotactic reaction with tunable magnetic property is substantiated by the formation of the well-known Mn and Co ordered double perovskite La2MnCoO6. The LaMnO3–LaCoO3 nanocomposite annealed at 800 °C results in the interface product phase with ferromagnetic TC = 220 K, which is in agreement with the reported value of La2MnCoO6, confirming the cationic ordering. The high-resolution electron microscope study supports the temperature-controlled inter-growth phase formation with cation ordering, as suggested from magnetic studies. We believe that the temperature-controlled cationic ordering through topotactic reaction at the interface of the nanocomposite with tunable magnetic properties will provide a strategic route to design functional ceramic materials.
1 superlattice of LaMnO3/LaFeO3 with ordered Mn and Fe. The low temperature ordering of Mn and Fe is completely randomized by annealing at 1000 °C, resulting in a lack of magnetic ordering as observed in the bulk La1−xAxFe0.5Mn0.5O3 perovskites. The temperature-controlled cationic ordering in the interfacial product phase formed by topotactic reaction with tunable magnetic property is substantiated by the formation of the well-known Mn and Co ordered double perovskite La2MnCoO6. The LaMnO3–LaCoO3 nanocomposite annealed at 800 °C results in the interface product phase with ferromagnetic TC = 220 K, which is in agreement with the reported value of La2MnCoO6, confirming the cationic ordering. The high-resolution electron microscope study supports the temperature-controlled inter-growth phase formation with cation ordering, as suggested from magnetic studies. We believe that the temperature-controlled cationic ordering through topotactic reaction at the interface of the nanocomposite with tunable magnetic properties will provide a strategic route to design functional ceramic materials.
Conflicts of interest
There are no conflicts to declare.Acknowledgements
The authors gratefully acknowledge financial support from the Science and Engineering Research Board (SERB), Government of India, by a grant No: CRG/2021/000342 to Md. M. Seikh. M. Vasundhara would like to acknowledge the support offered by SERB grant number, CRG/2019/01574 and Department of K&IM of Indian Institute of Chemical Technology (IICT/Pubs./2024/097).References
- J. Zhang, R. J. Perez and E. J. Lavernia, J. Mat. Sci., 1993, 28, 835–846 CrossRef CAS.
- K. Lin, M. Zeng, H. Chen, X. Tao, Y. Ouyang, Y. Du and Q. Peng, Int. J. Mech. Sci., 2022, 231, 107580 CrossRef.
- W. Chen, W. Yu, C. Ma, G. Ma, L. Zhang and H. Wang, J. Magnes. Alloy., 2022, 10, 1457–1475 CrossRef CAS.
- C. Vahlas, I. W. Hall and I. Haurie, Mater. Sci. Eng., A, 1999, 259, 269–278 CrossRef.
- J. H. Perepezko, M. H. da Silva Bassani, J. S. Park, A. S. Edelstein and R. K. Everett, Mater. Sci. Eng., A, 1995, 195, 1–11 CrossRef.
- R. J. Arsenault, Composites, 1994, 25, 540–548 CrossRef CAS.
- J. S. Park, J. Cho, B. Y. Hur and J. H. Perepezko, Met. Mater. Int., 2007, 13, 1–12 CrossRef CAS.
- J. E. Garay, U. Anselmi-Tamburini and Z. A. Munir, Acta Mater., 2003, 51, 4487–4495 CrossRef CAS.
- Y. Cui, F. Liang, Z. Yang, S. Xu, X. Zhao, Y. Ding and J. Liu, ACS Appl. Mater. Interfaces, 2018, 10, 9203–9210 CrossRef CAS PubMed.
- J. S. Park and J. M. Kim, Materials, 2010, 3, 264–295 CrossRef CAS.
- S.-K. Lin, C.-L. Cho and H.-M. Chang, J. Electron. Mater., 2014, 43, 204–211 CrossRef CAS.
- A. Babaei-Dehkordi, M. Soltanieh, M. Mirjalili, M. Asherloo and A. Mostafaei, Materials, 2023, 16, 2267 CrossRef CAS PubMed.
- T. Sarkar, A. K. Raychaudhuri, A. K. Bera and S. M. Yusuf, New J. Phys., 2010, 12, 123026 CrossRef.
- T. Sarkar, M. V. Kamalakar and A. K. Raychaudhuri, New J. Phys., 2012, 14, 033026 CrossRef.
- D. Lahiri, S. Khalid, T. Sarkar, A. K. Raychaudhuri and S. M. Sharma, J. Condens. Matter Phys., 2012, 24, 336001 CrossRef PubMed.
- L. Pagliari, M. Dapiaggi, F. Maglia, T. Sarkar, A. K. Raychaudhuri, T. Chatterji and M. A. Carpenter, J. Condens. Matter Phys., 2014, 26, 435303 CrossRef CAS PubMed.
- J. Van Suchtelen, Philips Res. Rep., 1972, 27, 28–37 Search PubMed.
- C. W. Nan, M. I. Bichurin, S. Dong, D. Viehland and G. Srinivasan, J. Appl. Phys., 2008, 103, 031101 CrossRef.
- H. Zheng, J. Wang, S. E. Lofland, Z. Ma, L. Mohaddes-Ardabili, T. Zhao, S. L. Riba, S. R. Shinde, S. B. Ogale, F. Bai and D. Viehland, Science, 2004, 303, 661–663 CrossRef CAS PubMed.
- B. K. Bammannavar, L. R. Naik and B. K. Chougule, J. Appl. Phys., 2008, 104, 064123 CrossRef.
- W. J. Feng, D. Geng, J. J. Ceng, J. Z. Sheng, S. Zhang and H. Yang, Integr. Ferroelectr., 2011, 129, 215–222 CrossRef CAS.
- G. Muscas, P. A. Kumar, G. Barucca, G. Concas, G. Varvaro, R. Mathieu and D. Peddis, Nanoscale, 2016, 8, 2081–2089 RSC.
- P. K. Manna and S. M. Yusuf, Phys. Rep., 2014, 535, 61–99 CrossRef.
- T. P. Gavrilova, R. M. Eremina, I. V. Yatsyk, I. F. Gilmutdinov, A. G. Kiiamov, N. M. Lyadov and Y. V. Kabirov, J. Alloys Compd., 2017, 714, 213–224 CrossRef CAS.
- R. M. Eremina, K. R. Sharipov, I. V. Yatsyk, N. M. Lyadov, I. F. Gilmutdinov, A. G. Kiiamov, Y. V. Kabirov, V. G. Gavrilyachenko and T. I. Chupakhina, J. Exp. Theor. Phys., 2016, 123, 127–133 CrossRef CAS.
- A. Haque, D. Ghosh, U. Dutta, A. Shukla, A. Gayen, P. Mahata, A. K. Kundu and M. M. Seikh, J. Magn. Magn. Mater., 2020, 494, 165847 CrossRef CAS.
- T. Sarkar, G. Muscas, G. Barucca, F. Locardi, G. Varvaro, D. Peddis and R. Mathieu, Nanoscale, 2018, 10, 22990–23000 RSC.
- P. Maltoni, T. Sarkar, G. Barucca, G. Varvaro, D. Peddis and R. Mathieu, J. Magn. Magn. Mater., 2021, 535, 168095 CrossRef CAS.
- P. Maltoni, T. Sarkar, G. Barucca, G. Varvaro, F. Locardi, D. Peddis and R. Mathieu, J. Phys. Chem. C, 2021, 125, 5927–5936 CrossRef CAS.
- F. Afzal, M. T. Ansar, A. S. Haidyrah, M. A. Khan, G. M. Mustsfa, M. Saleemand and S. Atiq, J. Alloys Compd., 2021, 888, 161516 CrossRef CAS.
- M. Zhang, M. Jia and Y. Jin, Appl. Surf. Sci., 2012, 261, 298–305 CrossRef CAS.
- H. Tabata, H. Tanaka and T. Kawai, Appl. Phys. Lett., 1994, 65, 1970–1972 CrossRef CAS.
- G. Q. Gong, A. Gupta, G. Xiao, P. Lecoeur and T. R. McGuire, Phys. Rev. B: Condens. Matter Mater. Phys., 1996, 54, R3742 CrossRef CAS PubMed.
- M. Yoshimoto, H. Nagata, S. Gonda, J. P. Gong, H. Ohkubo and H. Koinuma, Phys. C, 1991, 190, 43–45 CrossRef CAS.
- P. C. Rout, A. Ray and U. Schwingenschlögl, Npj Comput. Mater., 2023, 9, 165 CrossRef CAS.
- K. Ueda, H. Tabata and T. Kawai, Phys. Rev. B: Condens. Matter Mater. Phys., 1999, 60, R12561 CrossRef CAS.
- J. Kanamori, J. Phys. Chem. Solids, 1959, 10, 87–98 CrossRef CAS.
- J. B. Goodenough, Phys. Rev., 1955, 100, 564 CrossRef CAS.
- J. B. Goodenough, A. Wold, R. J. Arnott and N. J. P. R. Menyuk, Phys. Rev., 1961, 124, 373 CrossRef CAS.
- G. Blasse, J. Phys. Chem. Solids, 1965, 26, 1969–1971 CrossRef CAS.
- U. Dutta, O. I. Lebedev, A. K. Kundu and M. M. Seikh, J. Phys.: Condens. Matter, 2019, 32, 085803 CrossRef PubMed.
- A. Haque, R. Das, D. Ghosh, M. Vasundhara, A. Gayen, A. K. Kundu and M. M. Seikh, J. Phys. Chem. C, 2021, 125, 3088–3101 CrossRef CAS.
- K. De, R. Ray, R. N. Panda, S. Giri, H. Nakamura and T. Kohara, J. Magn. Magn. Mater., 2005, 288, 339–346 CrossRef CAS.
- O. F. De Lima, J. A. H. Coaquira, R. L. de Almeida and S. K. Malik, J. Appl. Phys., 2010, 107, 09E107 CrossRef.
- K. De, M. Thakur, A. Manna and S. Giri, J. Appl. Phys., 2006, 99, 013908 CrossRef.
- U. Dutta, D. Ghosh, A. Haque, L. Kumar, T. K. Mandal, P. S. Walke, K. Pal, A. Gayen, A. K. Kundu and M. M. Seikh, J. Phys.: Condens. Matter, 2019, 31, 225801 CrossRef CAS PubMed.
- Y. Sun, W. Tong, X. Xu and Y. Zhang, Phys. Rev. B: Condens. Matter Mater. Phys., 2001, 63, 174438 CrossRef.
- D. V. Karpinsky, I. O. Troyanchuk and V. V. Sikolenko, J. Phys.: Condens. Matter, 2007, 19, 036220 CrossRef.
- A. Haque, R. Das, D. Ghosh, O. I. Lebedev, A. Gayen, A. K. Kundu and M. M. Seikh, J. Magn. Magn. Mater., 2020, 514, 167159 CrossRef CAS.
- R. Das, S. Bhattacharya, A. Haque, D. Ghosh, O. I. Lebedev, A. Gayen and M. M. Seikh, J. Magn. Magn. Mater., 2021, 538, 168267 CrossRef CAS.
- V. Solanki, S. Das, S. Kumar, M. M. Seikh, B. Raveau and A. K. Kundu, J. Sol-Gel Sci. Technol., 2017, 82, 536–540 CrossRef CAS.
- V. Solanki, M. M. Seikh and A. K. Kundu, J. Magn. Magn. Mater., 2019, 469, 95–99 CrossRef CAS.
- D. Ghosh, R. Das, A. Haque, K. Ghorai, A. Gayen, P. Mahata, A. K. Kundu and M. M. Seikh, J. Magn. Magn. Mater., 2021, 523, 167621 CrossRef CAS.
- X. D. Zhou, L. R. Pederson, Q. Cai, J. Yang, B. J. Scarfino, M. Kim, W. B. Yelon, W. J. James, H. U. Anderson and C. Wang, J. Appl. Phys., 2006, 99, 08M918 CrossRef.
- K. Ramesha, V. Thangadurai, D. Sutar, S. V. Subramanyam, G. N. Subbanna and J. Gopalakrishnan, Mater. Res. Bull., 2000, 35, 559–565 CrossRef CAS.
- V. Joly, S. Bhame, P. Joy and S. Date, J. Magn. Magn. Mater., 2003, 261, 433 CrossRef.
- A. Hossain, D. Ghosh, U. Dutta, P. S. Walke, N. E. Mordvinova, O. I. Lebedev, B. Sinha, K. Pal, A. Gayen, A. K. Kundu and M. M. Seikh, J. Magn. Magn. Mater., 2017, 444, 68–76 CrossRef CAS.
- U. Dutta, A. Hossain, P. S. Walke, D. Ghosh, N. E. Mordvinova, O. I. Lebedev, A. Haque, K. Pal, A. Gayen, A. K. Kundu and M. M. Seikh, J. Alloys Compd., 2019, 777, 1396–1402 CrossRef CAS.
- S. D. Bhame, V. J. Joly and P. A. Joy, Phys. Rev. B: Condens. Matter Mater. Phys., 2005, 72, 054426 CrossRef.
- Z. X. Wei, Y. Wang, J. P. Liu, C. M. Xiao and W. W. Zeng, Mater. Chem. Phys., 2012, 136, 755–761 CrossRef CAS.
- P. Hao, P. Song, Z. Yang and Q. Wang, J. Mater. Sci.: Mater. Electron., 2020, 31, 4632–4641 CrossRef CAS.
- R. H. Blackmore, M. E. Rivas, G. F. Tierney, K. M. Mohammed, D. Decarolis, S. Hayama, F. Venturini, G. Held, R. Arrigo, M. Amboage, P. Hellier, E. Lynch, M. Amri, M. Casavola, T. E. Erden, P. Collier and P. P. Wells, Phys. Chem. Chem. Phys., 2020, 22, 18774–18787 RSC.
- B. Poojitha, R. Shukla, M. Vasundhara, U. M. Rasi, R. B. Gangineni, S. C. Sahoo, R. J. Choudhary, Y. Bitla and A. K. Patra, J. Magn. Magn. Mater., 2021, 530, 167851 CrossRef.
- T. Vijayaraghavan, R. Sivasubramanian, S. Hussain and A. Ashok, Chemistry Select, 2017, 2, 5570–5577 CAS.
- B. Arun, V. R. Akshay and M. Vasundhara, Dalton Trans., 2018, 47, 15512–15522 RSC.
- A. Haque, R. Das, M. Vasundhara, D. Ghosh, A. Gayen, P. Mahata, A. K. Kundu and M. M. Seikh, J. Alloys Compd., 2021, 875, 159984 CrossRef CAS.
- A. P. B. Selvadurai, V. Pazhanivelu, C. Jagadeeshwaran, R. Murugaraj, I. P. Muthuselvam and F. C. Chou, J. Alloys Compd., 2015, 646, 924–931 CrossRef.
- M. R. Todd, L. C. Gary and M. A. James, Phys. Rev. B: Condens. Matter Mater. Phys., 1993, 48, 224–238 CrossRef PubMed.
- E. K. Abdel-Khalek, I. Ibrahim and T. M. Salama, Ferroelectrics, 2019, 550, 210–219 CrossRef CAS.
- Y. Qiu, Y. S. Luo, Z. J. Zou, Z. M. Tian, S. L. Yuan, Y. Xi and L. Z. Huang, J. Mater. Sci.: Mater. Electron., 2014, 25, 760–764 CrossRef CAS.
- S. Phokha, S. Pinitsoontorn, S. Maensiri and S. Rujirawat, J. Sol-Gel Sci. Technol., 2014, 71, 333–341 CrossRef CAS.
- A. A. Cristóbal, P. M. Botta, E. F. Aglietti, M. S. Conconi, P. G. Bercoff and J. P. López, Mater. Chem. Phys., 2011, 130, 1275–1279 CrossRef.
- Y. Tokura, Colossal magnetoresistive oxides, CRC Press, 2000 Search PubMed.
- R. Schmidt, Phys. Rev. B: Condens. Matter Mater. Phys., 2008, 77, 205101 CrossRef.
- T. Sarkar, B. Ghosh, A. K. Raychaudhuri and T. Chatterji, Phys. Rev. B: Condens. Matter Mater. Phys., 2008, 77, 235112 CrossRef.
- B. Samantaray, S. K. Srivastava and S. Ravi, J. Appl. Phys., 2012, 111, 013919 CrossRef.
- S. S. Rao, S. Tripathi, D. Pandey and S. V. Bhat, Phys. Rev. B: Condens. Matter Mater. Phys., 2006, 74, 144416 CrossRef.
- T. Zhang, T. F. Zhou, T. Qian and X. G. Li, Phys. Rev. B: Condens. Matter Mater. Phys., 2007, 76, 174415 CrossRef.
- K. Das, D. Mazumdar, P. Dasgupta, S. Kumar and I. Das, J. Magn. Magn. Mater., 2021, 528, 167804 CrossRef CAS.
- P. Schiffer, A. P. Ramirez, W. Bao and S. W. Cheong, Phys. Rev. Lett., 1995, 75, 3336 CrossRef CAS PubMed.
- P. Mandal, S. S. Bhat, Y. Sundarayya, A. Sundaresan, C. N. R. Rao, V. Caignaert, B. Raveau and E. Suard, RSC Adv., 2012, 2, 292–297 RSC.
- R. Seshadri and N. A. Hill, Chem. Mater., 2001, 13, 2892–2899 CrossRef CAS.
- T. Chatterji, P. F. Henry and B. Ouladdiaf, Phys. Rev. B: Condens. Matter Mater. Phys., 2008, 77, 212403 CrossRef.
- B. Raveau and M. M. Seikh, Cobalt oxides: from crystal chemistry to physics, John Wiley & Sons, 2012 Search PubMed.
- M. M. Seikh, L. Sudheendra, C. Narayana and C. N. R. Rao, J. Mol. Struct., 2004, 706, 121–126 CrossRef.
- R. I. Dass and J. B. Goodenough, Phys. Rev. B: Condens. Matter Mater. Phys., 2003, 67, 014401 CrossRef.
- P. A. Joy, Y. B. Khollam and S. K. Date, Phys. Rev. B: Condens. Matter Mater. Phys., 2000, 62, 8608 CrossRef CAS.
- P. Tiwari and C. Rath, J. Magn. Magn. Mater., 2017, 441, 635–641 CrossRef CAS.
- P. Tiwari and C. Rath, AIP Conf. Proc., 2017, 1832, 050099 CrossRef.
- S. Zhou, L. He, S. Zhao, Y. Guo, J. Zhao and L. Shi, J. Phys. Chem. C, 2009, 113, 13522–13526 CrossRef CAS.
- Q. Wei, T. Zhang, X. P. Wang and Q. F. Fang, Eur. Phys. J.: Appl. Phys., 2012, 57, 30401 CrossRef.
Footnote |
| † Electronic supplementary information (ESI) available. See DOI: https://doi.org/10.1039/d3ma00891f |
| This journal is © The Royal Society of Chemistry 2024 |

