 Open Access Article
Structures and electronic states of nickel-rich oxides for lithium ion batteries†
Saleem
Yousuf
 a,
Md Maruf
Mridha
a and
Rita
Magri
 *abc
*abc
aDipartimento di Scienze Fisiche, Informatiche e Matematiche, Università di Modena e Reggio Emilia, Via Campi 213/A, 41125 Modena, Italy. E-mail: rita.magri@unimore.it
bCentro S3, Istituto Nanoscienze-Consiglio Nazionale Delle Ricerche (CNR-NANO), Via Campi 213/A, 41125 Modena, Italy
cCentro Interdipartimentale di Ricerca e per I Servizi Nel Settore Della Produzione, Stoccaggio Ed Utilizzo Dell’Idrogeno H2-MO.RE., Via Università 4, 41121, Modena, Italy
First published on 15th January 2024
Abstract
A new superstructure of layered pristine LiNiO2 (LNO) was obtained by first replicating 16 times the optimized structure of the 12-atom primitive cell of the R![[3 with combining macron]](https://www.rsc.org/images/entities/char_0033_0304.gif) m space group and then relaxing both cell parameters and internal positions. The structural optimization is accompanied by a very significant lowering of the internal energy. The R
m space group and then relaxing both cell parameters and internal positions. The structural optimization is accompanied by a very significant lowering of the internal energy. The R![[3 with combining macron]](https://www.rsc.org/images/entities/char_0033_0304.gif) m space group is the space group observed experimentally by XRD. In contrast to the structure commonly proposed in the literature, this new crystal structure, which still belongs to the R
m space group is the space group observed experimentally by XRD. In contrast to the structure commonly proposed in the literature, this new crystal structure, which still belongs to the R![[3 with combining macron]](https://www.rsc.org/images/entities/char_0033_0304.gif) m space group, shows size and charge disproportionation of the NiO6 octahedra. The charge disproportionation results in a change in the Ni oxidation state from Ni3+ calculated in the 12-atom primitive unit cell, to Ni4+ and almost Ni2+. This is the first time that such charge disproportionation has been calculated for the R
m space group, shows size and charge disproportionation of the NiO6 octahedra. The charge disproportionation results in a change in the Ni oxidation state from Ni3+ calculated in the 12-atom primitive unit cell, to Ni4+ and almost Ni2+. This is the first time that such charge disproportionation has been calculated for the R![[3 with combining macron]](https://www.rsc.org/images/entities/char_0033_0304.gif) m crystal structure of LNO. The Ni–O bond length distribution of the new structure agrees well with experimental values. Our results show that the choice of the simulation unit cell is important for determining the energetics of this class of oxide material, proposed for cathodes in lithium ion batteries (LIBs). We used this new structure as a template for the study of the structural and electronic changes induced by delithiation and by Mn for Ni cation substitution, originating the solid solutions LiNiyMn(1−y)O2 (LNMO). Our results, surprisingly, agree well with existing experiments and explain observed trends better than previous studies.
m crystal structure of LNO. The Ni–O bond length distribution of the new structure agrees well with experimental values. Our results show that the choice of the simulation unit cell is important for determining the energetics of this class of oxide material, proposed for cathodes in lithium ion batteries (LIBs). We used this new structure as a template for the study of the structural and electronic changes induced by delithiation and by Mn for Ni cation substitution, originating the solid solutions LiNiyMn(1−y)O2 (LNMO). Our results, surprisingly, agree well with existing experiments and explain observed trends better than previous studies.
1. Introduction
The transition to a green economy and environmental protection needs the development of new Li-ion batteries with higher energy density, faster recharge, and greater safety. Layered oxides have been the materials of choice for cathodes in Li ion batteries. The cathodes of commercial Li ion batteries are made of LiCoO2 (LCO) and contain cobalt, a rare and toxic element. The theoretical capacity of LCO is 270 mA h g−1,1 which reduces to an actual reversible charge capacity of about 145 mA h g−1![[thin space (1/6-em)]](https://www.rsc.org/images/entities/char_2009.gif) 2 because of thermal instability issues. As a consequence, LCO needs to be substituted for large power applications. In the last few years, a renewed interest in the isostructural LiNiO2 (LNO) compound, based on the alternative nickel transition metal, has emerged.3 This layered material is attractive since it has a lower cost for the same theoretical energy density as LCO. However, despite much research effort being devoted to this material, it has not yet been commercialized because of its many drawbacks.
2 because of thermal instability issues. As a consequence, LCO needs to be substituted for large power applications. In the last few years, a renewed interest in the isostructural LiNiO2 (LNO) compound, based on the alternative nickel transition metal, has emerged.3 This layered material is attractive since it has a lower cost for the same theoretical energy density as LCO. However, despite much research effort being devoted to this material, it has not yet been commercialized because of its many drawbacks.
First, despite much care during synthesis, the material turns out to be always nonstoichiometric with Ni ions occupying Li sites, so the compound is actually Li1−xNi1+xO2 with x ranging typically between 2% and 10%.4 The off-stoichiometry is thought to be due to the similarity of the Ni2+ and Li+ ionic radii (r(Ni2+) = 0.69 Å, r(Li+) = 0.76 Å). LNO stabilizes in the rhombohedral R![[3 with combining macron]](https://www.rsc.org/images/entities/char_0033_0304.gif) m Bravais lattice5 despite a number of first-principles calculations having found monoclinic crystal structures to be the ground states for the layered crystal structures.6,7
m Bravais lattice5 despite a number of first-principles calculations having found monoclinic crystal structures to be the ground states for the layered crystal structures.6,7
Other instabilities arise during the battery charge–discharge cycles, in the form of phase transitions, in which Li–Ni cation mixing leads to the formation of a spinel (LiNi2O4) phase and/or rock-salt-type phases.8,9 Other forms of instability include surface reactivity affecting the electrode–electrolyte interface with the formation of NiO.10,11 Another critical factor governing the degradation of LNO is the multistep phase transformation process occurring on Li insertion/extraction. Four different phases have been described in the literature, namely the hexagonal H1, the monoclinic M, the hexagonal H2, and the hexagonal H3 phases,3,4,12–14 where the H2–H3 transformation at a high state of charge (4.15–4.25 V) has the strongest negative effect on the intrinsic stability of LNO, as it is accompanied by a sudden collapse of the structure along the crystallographic c-axis.12
Despite the large number of studies, the structure of LNO at full Li content is still a subject of considerable debate. The structure determined experimentally is rhombohedral, of R![[3 with combining macron]](https://www.rsc.org/images/entities/char_0033_0304.gif) m symmetry, with O3 stacking, where the oxygen atoms occupy the 6c sites, and lithium and nickel occupy the octahedral 3a and 3b sites.15 In this structure, the Ni cations are supposed to have Ni3+ oxidation states in a low-spin configuration, with a single electron in the eg orbital. This electronic configuration is subject to Jahn–Teller (JT) distortion of the NiO6 octahedra, which has been measured through EXAFS and neutron diffraction.16,17 The measurements support the JT distortion: four bond lengths are grouped as long bonds (2.04 Å and 2.06 Å with an average length of 2.05 Å) and short bonds (1.90 Å and 1.96 Å with an average length of 1.93 Å) suggestive of the 2
m symmetry, with O3 stacking, where the oxygen atoms occupy the 6c sites, and lithium and nickel occupy the octahedral 3a and 3b sites.15 In this structure, the Ni cations are supposed to have Ni3+ oxidation states in a low-spin configuration, with a single electron in the eg orbital. This electronic configuration is subject to Jahn–Teller (JT) distortion of the NiO6 octahedra, which has been measured through EXAFS and neutron diffraction.16,17 The measurements support the JT distortion: four bond lengths are grouped as long bonds (2.04 Å and 2.06 Å with an average length of 2.05 Å) and short bonds (1.90 Å and 1.96 Å with an average length of 1.93 Å) suggestive of the 2![[thin space (1/6-em)]](https://www.rsc.org/images/entities/char_2009.gif) :
:![[thin space (1/6-em)]](https://www.rsc.org/images/entities/char_2009.gif) 1 ratio of short-to-long bonds expected for JT distortion. However, the measurements did not indicate the existence of long range order. Indeed, a collective distortion has not been observed for LNO, as is the case for LiNaO2, so it has often been assumed that in LNO the JT orbitals are randomly oriented. Experiments later excluded a random arrangement, pointing, instead, to some sort of local ordering of a trimer kind with the three 3dz2−r2/3 orbitals pointing towards the shared oxygen site.16,18 First-principles calculations have confirmed that JT-distorted configurations of NiO6 octahedra in LNO are more stable than the R
1 ratio of short-to-long bonds expected for JT distortion. However, the measurements did not indicate the existence of long range order. Indeed, a collective distortion has not been observed for LNO, as is the case for LiNaO2, so it has often been assumed that in LNO the JT orbitals are randomly oriented. Experiments later excluded a random arrangement, pointing, instead, to some sort of local ordering of a trimer kind with the three 3dz2−r2/3 orbitals pointing towards the shared oxygen site.16,18 First-principles calculations have confirmed that JT-distorted configurations of NiO6 octahedra in LNO are more stable than the R![[3 with combining macron]](https://www.rsc.org/images/entities/char_0033_0304.gif) m undistorted structure. Chen et al. have compared the energies of differently oriented JT-distorted phases, finding that the structure of the P21/c space group with JT-distorted octahedra in a zig-zag arrangement is more stable than the C2/m structure with a collinear arrangement.7 A similar result was obtained by Das et al.6 and Zhang et al.19 However, the zig-zag arrangement of the octahedra has been excluded by experiments, which always finds the rhombohedral R
m undistorted structure. Chen et al. have compared the energies of differently oriented JT-distorted phases, finding that the structure of the P21/c space group with JT-distorted octahedra in a zig-zag arrangement is more stable than the C2/m structure with a collinear arrangement.7 A similar result was obtained by Das et al.6 and Zhang et al.19 However, the zig-zag arrangement of the octahedra has been excluded by experiments, which always finds the rhombohedral R![[3 with combining macron]](https://www.rsc.org/images/entities/char_0033_0304.gif) m symmetry for the complete lithiated phase. Nowadays, a non-cooperative and dynamic JT effect is generally accepted for LNO,3,20 although disproportionation based on Ni–O bond lengths has also been argued.21 From the measured Ni–O bond lengths and by comparing them with other nickelates, competition between charge ordering and orbital ordering for the ground state is expected for LNO.
m symmetry for the complete lithiated phase. Nowadays, a non-cooperative and dynamic JT effect is generally accepted for LNO,3,20 although disproportionation based on Ni–O bond lengths has also been argued.21 From the measured Ni–O bond lengths and by comparing them with other nickelates, competition between charge ordering and orbital ordering for the ground state is expected for LNO.
In this paper, we intend first to revisit the problem of the LNO structure using highly accurate first-principles calculations. All the simulations of recent years studying doping and defects in LNO invariably assume pristine LNO model structures containing only Ni3+ cations. In this paper, we show that the structural optimization of a large supercell of the R![[3 with combining macron]](https://www.rsc.org/images/entities/char_0033_0304.gif) m space group for layered LNO leads to an ordered crystal structure again belonging to the R
m space group for layered LNO leads to an ordered crystal structure again belonging to the R![[3 with combining macron]](https://www.rsc.org/images/entities/char_0033_0304.gif) m space group, but presenting structural and charge disproportionation. Structural optimization leads to a large energy gain, much larger than the energy gain obtained for the C2/m monoclinic space group in a similarly large supercell. The monoclinic crystal structure has still a lower energy than the hexagonal one, but the difference between their energies becomes much smaller. This result is obtained for pristine LNO without Ni in the Li layers. The new ordered crystalline structure presents properties in nice agreement with the experimental data and, when delithiated, can explain the driving force behind the observed H1 to M phase transition.
m space group, but presenting structural and charge disproportionation. Structural optimization leads to a large energy gain, much larger than the energy gain obtained for the C2/m monoclinic space group in a similarly large supercell. The monoclinic crystal structure has still a lower energy than the hexagonal one, but the difference between their energies becomes much smaller. This result is obtained for pristine LNO without Ni in the Li layers. The new ordered crystalline structure presents properties in nice agreement with the experimental data and, when delithiated, can explain the driving force behind the observed H1 to M phase transition.
As shown here, the issue of the choice of the unit cells for calculating the energy of different crystal structures of the LNO layered system is a delicate one since their formation energies and their relative values are usually used to calculate the phase diagrams and voltage-capacity curves through the cluster-expansion (CE) method.6,22 In this method, the energies of a large number of LixNiO2 ordered crystal structures in small unit cells are calculated and fitted to extract the cluster (pairs, triplets, and quadruplets formed by lattice points) contributions to the energy. In a given ordered crystal structure, each cluster is associated with a “correlation function” calculated by associating each lattice point with a “spin” value dependent on the actual ion occupying that lattice point. This paper shows that, at least in the case of LiNiO2, the choice of the basic cells needed to calculate the input total energies for CE may have a great influence, not only on the determination of the ground structures and phase diagrams, but also on the structural, electronic, and magnetic properties associated with the input structures.
Since LNO suffers from the above-mentioned structural instabilities and maintaining structural stability during cycling is critically important to achieve a long-term cycling performance, the new crystalline structure is used to study the properties of Mn-modified LNO. Indeed, the instability of LNO has originated research efforts aimed at stabilizing the material through the addition of other metal cations. Other layered oxides with general LMO formula have been synthesized in which M stands for other transition metals inserted in partial substitution of Ni to reduce the quantity of cobalt.23,24 Among these promising layered oxide compounds is nickel-rich NMC, where N stands for nickel, M for manganese, and C for cobalt. To eliminate cobalt, layered LixNi(1−y)MnyO2 (LNMO) solutions have been synthesized and tested. Only few papers have focused on the LNMO material system. Layered manganese-substituted LiNi(1−x)MnxO2 solid solutions can only be formed when x is less than 0.5 and they have the same α-NaFeO2 layered structure as R![[3 with combining macron]](https://www.rsc.org/images/entities/char_0033_0304.gif) m LNO in a nickel-rich regime (x ≤ 0.5). For x ≥ 0.5, a phase transition occurs to a cubic spinel symmetry. In most LNMO samples, some Li is found in the transition metal layer, LiTM, hence the solution is indicated as Li[NixLi(1−2x)/3Mn(2−x)/3]O2 (0 ≤ x ≤ 0.5). Manganese incorporated in pristine LNO, Li(Ni(1−x)Mnx)O2, has been found in the tetravalent Mn4+ oxidation state,25,26 so that more Ni2+ cations are supposed to be generated to conserve the charge, in the fully lithiated solid solutions Li(Ni2+xNi3+(1−2x)Mn4+x)O2.27 Obviously, this consideration stems from the assumption that in lithiated LNO all the Ni cations are Ni3+, an assumption which is challenged in the present paper.
m LNO in a nickel-rich regime (x ≤ 0.5). For x ≥ 0.5, a phase transition occurs to a cubic spinel symmetry. In most LNMO samples, some Li is found in the transition metal layer, LiTM, hence the solution is indicated as Li[NixLi(1−2x)/3Mn(2−x)/3]O2 (0 ≤ x ≤ 0.5). Manganese incorporated in pristine LNO, Li(Ni(1−x)Mnx)O2, has been found in the tetravalent Mn4+ oxidation state,25,26 so that more Ni2+ cations are supposed to be generated to conserve the charge, in the fully lithiated solid solutions Li(Ni2+xNi3+(1−2x)Mn4+x)O2.27 Obviously, this consideration stems from the assumption that in lithiated LNO all the Ni cations are Ni3+, an assumption which is challenged in the present paper.
The presence of Mn was also found to induce an increase in Li/Ni cation mixing. The lithium ions in the transition metal layer, LiTM, are electrochemically active, resulting in the creation of tetrahedral sites for lithium occupancy when, during cathode charging, LiTM are removed.28 First-principles calculations have shown that the Li/Ni exchange promoted by Mn tends to increase the activation energy for Li ion diffusion.29 Other authors30 have pointed out that the formation energy of an extra Ni defect in the Li layer in LiNi0.5Mn0.5O2 increases in the presence of a high-valence Mn4+ dopant. This fact, together with the observation that the presence of Mn4+ reduces Ni3+ to Ni2+, thus reducing the lattice distortion due to the Ni3+ JT effect, is thought to be at the origin of the observed stabilization of the crystal structure.
In this paper, we model pristine layered LNMO (e.g. without LiTM or other kinds of defects) using large optimized supercells of pristine LNO of R![[3 with combining macron]](https://www.rsc.org/images/entities/char_0033_0304.gif) m space group. The aim is to study the evolution of the structural and electronic properties of the solid solutions versus Mn content and to investigate the effects of Mn introduction, in substitution of Ni, on the structural and electronic properties of the delithiated structures. Our study confirms that Mn ions are predominantly in the Mn4+ state and thus, do not participate in the redox reactions occurring during delithiation. They have, however, a role in determining the oxidation states of the Ni ions, and thus, of the Ni2+/Ni3+ and Ni3+/Ni4+ redox couples which determine the battery charge and discharge potentials, and the intercalation voltage curves.
m space group. The aim is to study the evolution of the structural and electronic properties of the solid solutions versus Mn content and to investigate the effects of Mn introduction, in substitution of Ni, on the structural and electronic properties of the delithiated structures. Our study confirms that Mn ions are predominantly in the Mn4+ state and thus, do not participate in the redox reactions occurring during delithiation. They have, however, a role in determining the oxidation states of the Ni ions, and thus, of the Ni2+/Ni3+ and Ni3+/Ni4+ redox couples which determine the battery charge and discharge potentials, and the intercalation voltage curves.
2. Computational method
Total energy calculations were performed within the spin-polarized density functional theory (DFT) approach using the plane-wave pseudopotential method as implemented in the Quantum Espresso Package.31 The exchange and correlation density functional was expressed through the GGA approximation of Perdew–Becke–Ernzerhof (PBE).32 We used norm-conserving (NC) pseudopotentials and all plane waves with energy less than 80 Ry were included in the basis set. The high cutoff of 80 Ry ensured good convergence of the total energies. The Hellman–Feynman forces were converged to 0.005 eV Å−1. The rotationally invariant scheme proposed by Dudarev et al.33 was used to include an energy term based on the Hubbard U model, facilitating electron localization in the transition metal d orbitals. We chose U = 3 eV since using this value, the calculations predicted structural, magnetic and electronic properties of LiNiO2 and LiMnO2 in the rhombohedral (R![[3 with combining macron]](https://www.rsc.org/images/entities/char_0033_0304.gif) m), monoclinic (C2/m), spinel (Fd
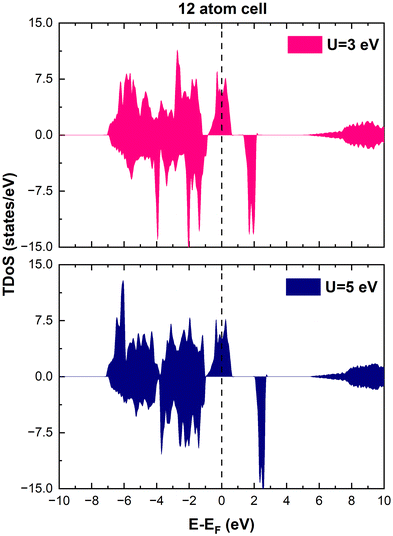
m), monoclinic (C2/m), spinel (Fd![[3 with combining macron]](https://www.rsc.org/images/entities/char_0033_0304.gif) m), and orthorhombic (Pmmn) crystal structures in reasonable agreement with the available experiments. We also checked other values of U and found that the physical interpretation of the results was not affected substantially. As shown in Fig. 1, the only relevant effect of the value of U on the total density of states (TDoS) of rhombohedral layered LiNiO2 in its primitive unit cell, is to push the energy of the empty states upward and, in this specific case, to widen the gap between the spin-down bands. However, in this paper, we are interested in ground-state properties, while experimental energy gaps are better predicted by excited-state theories. Evidence that the results of the calculations do not depend strongly on the U value is also given in the literature.34
m), and orthorhombic (Pmmn) crystal structures in reasonable agreement with the available experiments. We also checked other values of U and found that the physical interpretation of the results was not affected substantially. As shown in Fig. 1, the only relevant effect of the value of U on the total density of states (TDoS) of rhombohedral layered LiNiO2 in its primitive unit cell, is to push the energy of the empty states upward and, in this specific case, to widen the gap between the spin-down bands. However, in this paper, we are interested in ground-state properties, while experimental energy gaps are better predicted by excited-state theories. Evidence that the results of the calculations do not depend strongly on the U value is also given in the literature.34
The calculation of the mixing energy against phase separation in a completely lithiated and completely delithiated phase was used to compare the stability of structures on the same lattice with different numbers of Li vacancies. The formula used to calculate it is:
| Emixing = E(LixNiO2) − xE(LiNiO2) − (1 − x)E(NiO2) | (1) |
Analogously, the stability of LixNi1−yMnyO2 is assessed by defining the mixing energy as:
| Emixing = E(LixNi1−yMnyO2) − x(1 − y)E(LiNiO2) − xyE(LiMnO2) − (1 − x)(1 − y)E(NiO2) − (1 − x)(y)E(MnO2) | (2) |
Ferromagnetic alignment of Ni spins was adopted throughout all the calculations since it was shown that the spin-interaction energies are smaller than those between different structural phases and a ferromagnetic ordering corresponds to the ground state of LNO and Li-rich and Mn-poor LMNO.21,36
3. Fully lithiated LiNiO2
3a. Structural properties
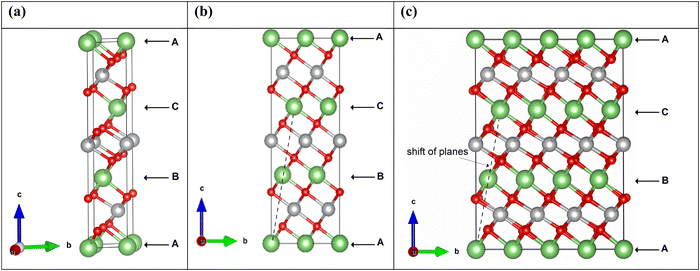
LiNiO2 can exist as a layered oxide with an arrangement of oxygen atoms forming a cubic close packed structure. In the crystalline rhombohedral R![[3 with combining macron]](https://www.rsc.org/images/entities/char_0033_0304.gif) m space group, the transition metal and lithium ions occupy octahedral sites. In the O3 stacking, as shown in Fig. 2, the primitive 12-atom cell (Fig. 2(a)) contains three formula units, shown in the figure as A, B, and C, consisting of parallel planes of lithium, oxygen, nickel, and oxygen atoms. In each plane, the atomic positions are shifted along the a- and b-axes occupying different sites. The stacking sequence along the c-axis of the planes is abcabca…, where the a, b, c, a planes constitute the formula A; b, c, a, b the formula B; and c, a, b, c the formula C. A, B, C in Fig. 2 refer also to the Li planes positions.
m space group, the transition metal and lithium ions occupy octahedral sites. In the O3 stacking, as shown in Fig. 2, the primitive 12-atom cell (Fig. 2(a)) contains three formula units, shown in the figure as A, B, and C, consisting of parallel planes of lithium, oxygen, nickel, and oxygen atoms. In each plane, the atomic positions are shifted along the a- and b-axes occupying different sites. The stacking sequence along the c-axis of the planes is abcabca…, where the a, b, c, a planes constitute the formula A; b, c, a, b the formula B; and c, a, b, c the formula C. A, B, C in Fig. 2 refer also to the Li planes positions.
The Li ions diffuse, intercalate and de-intercalate between the planes of NiO6 octahedra. Typically, the rhombohedral space group is represented in the corresponding hexagonal (H) cell with lattice parameters a, b, and c (orthogonal to a and b).
We performed calculations using simulation cells obtained by increasing the a and b in-plane lattice parameters of the hexagonal cell twice and four times, containing 48 and 192 atoms, respectively. The unit cells are shown in Fig. 2. The structural relaxation of the larger cells was performed starting from the cell parameters and atom positions of the optimized primitive 12-atom cell.
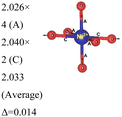
In the 12-atom (1 × 1 × 1) and 48-atom (2 × 2 × 1) cells, the NiO6 octahedra do not change appreciably, but in the 192-atom unit cell (4 × 4 × 1) the structural relaxation leads to size disproportionation of the octahedra with expanded and compressed octahedra having different Ni–O bond lengths. The octahedra show also a small JT distortion. Furthermore, the cell lattice parameters change with the cell dimensions, as shown in Table 1. The expanded and compressed octahedra are related to disproportionation of the Ni ion oxidation states, as shown in Table 2, where the bond lengths of the different kinds of octahedra in the 192-atom supercell are also reported.
| No. of atom cell | Lattice parameters (Å) | Other theories | Expt. | |||
|---|---|---|---|---|---|---|
| a | b | c | ||||
R![[3 with combining macron]](https://www.rsc.org/images/entities/char_0033_0304.gif) m m |
12 | 2.89 | 2.89 | 14.25 | (2.84, 14.29),37 (2.89,14.20),37 (2.90, 14.18),38 (2.88,14.27)39 | (2.88, 14.18),15 (2.87,14.21),14 (2.88, 14.19),40 (2.90, 14.2)41 |
| 48 | 2.86 | 2.86 | 14.05 | |||
| 192 | 2.87 | 2.87 | 14.01 | |||
| C2/m | 8 | 4.96 | 2.96 | 5.74 | (5.16, 2.79, 5.13)7 | |
| 192 | 9.83 | 11.71 | 5.74 | |||
| System | No. of atoms in cell | Metal–oxygen bond | Bond length (Å) | |
|---|---|---|---|---|
| a Here, average is the arithmetic average and Δ is the difference between highest and lowest values. | ||||
R![[3 with combining macron]](https://www.rsc.org/images/entities/char_0033_0304.gif) m m |
12 | Ni3+–O |

|
|
| 192 | Ni2+–O |

|
|
|
| Ni4+–O |

|
|||
| C2/m | 8 | Ni3+–O |

|
|
Thus, the use of the larger 192-atom unit cell has shown that the undistorted NiO6 octahedra calculated by optimizing the atomic coordinates in the smaller 12- and 48-atom unit cells are actually unstable towards disproportionation. The calculation for the 192-atom unit cell starts by replicating 16 times the optimized 12-atom unit cell, so the initial octahedra are exactly the same as those obtained by optimizing the 12-atom unit cell. The relaxation occurs spontaneously and is accompanied by a relevant diminishing of the total energy. Thus, the structures calculated using the 12- and 48-atom unit cells, the ones always considered so far in the literature for the R![[3 with combining macron]](https://www.rsc.org/images/entities/char_0033_0304.gif) m space group of LiNiO2, are shown to be unstable when represented using a larger unit cell.
m space group of LiNiO2, are shown to be unstable when represented using a larger unit cell.
A phase consisting of a mixture of expanded, compressed, and JT-distorted octahedra corresponding to Ni2+, Ni4+ and Ni3+, respectively, was assumed from experimental neutron-pair distributions, which could agree with most of the existing experimental data. The authors claimed that such a disordered metastable “charge-glass” phase could be stabilized by entropic effects.21
Here, we have found a structure consisting of expanded and compressed octahedra with Ni charge disproportionation by optimizing the R![[3 with combining macron]](https://www.rsc.org/images/entities/char_0033_0304.gif) m O3 structure in the 4 × 4 × 1 supercell, while the monoclinic structures, of which the C2/m is one representative, have JT-distorted octahedra with four short and two long Ni–O bonds and Ni3+ cations at their center (see Table 2). Indeed, there are two modes of JT distortion occurring in layered LNO, Q2 and Q3, discussed in detail in the literature.42 In the C2/m structure, only the Q3 mode occurs, leading to collinear JT distortion, where all the long bonds are similarly oriented. We define a JT distortion parameter Δ, which is the average difference between the longest Ni–O and shortest Ni–O ones. The values obtained for the hexagonal and monoclinic structures are given in Table 2.
m O3 structure in the 4 × 4 × 1 supercell, while the monoclinic structures, of which the C2/m is one representative, have JT-distorted octahedra with four short and two long Ni–O bonds and Ni3+ cations at their center (see Table 2). Indeed, there are two modes of JT distortion occurring in layered LNO, Q2 and Q3, discussed in detail in the literature.42 In the C2/m structure, only the Q3 mode occurs, leading to collinear JT distortion, where all the long bonds are similarly oriented. We define a JT distortion parameter Δ, which is the average difference between the longest Ni–O and shortest Ni–O ones. The values obtained for the hexagonal and monoclinic structures are given in Table 2.
This result is the first to report charge disproportionation and relative NiO6 octahedra size disproportionation in the fully lithiated O3 layered hexagonal crystal structure.
Our results are in qualitative agreement with the neutron diffraction data16 where the peak broadening was found to be more consistent with a continuous distribution of Ni–O bond lengths, due to nonuniform distortion than with the two different fixed Ni–O bond lengths expected in the case of a monoclinic lattice. Our calculated average long and short Ni–O bond lengths are 2.03 and 1.90 Å which nicely compare with the experimental values of 2.05 and 1.93 Å16 and with the X-ray absorption data finding Ni–O bonds of 2.08 and 1.91 Å, respectively.43
3b. Electronic and magnetic properties
The electronic structure is discussed by inspecting the Total Density of Satets (TDoS) and Partial Density of States (PDoS) of the considered structures. In Fig. 3(a), we can see that, using the 12-atom cell for the R![[3 with combining macron]](https://www.rsc.org/images/entities/char_0033_0304.gif) m crystal structure, the spin-up TDoS has a half-occupied band at the Fermi level, while the spin-down TDoS has an electronic gap. In this case, the Ni atoms are at the center of similarly perfect NiO6 octahedra (see Table 2). Since the crystal field splits the five d states into a three-fold degenerate t2g state and a two-fold degenerate eg state, the Ni states should be all in a Ni3+ oxidation state which adopts the low-spin configuration t62g(|↑↓|↑↓|↑↓|) e1g(|↑|
m crystal structure, the spin-up TDoS has a half-occupied band at the Fermi level, while the spin-down TDoS has an electronic gap. In this case, the Ni atoms are at the center of similarly perfect NiO6 octahedra (see Table 2). Since the crystal field splits the five d states into a three-fold degenerate t2g state and a two-fold degenerate eg state, the Ni states should be all in a Ni3+ oxidation state which adopts the low-spin configuration t62g(|↑↓|↑↓|↑↓|) e1g(|↑|![[thin space (1/6-em)]](https://www.rsc.org/images/entities/char_2009.gif) |), where the t2g states are occupied leaving one electron in the doubly degenerate eg state at higher energy. In the crystal, the Ni d states are hybridized with the oxygen p states, thus the half-occupied feature at the Fermi level corresponds to the antibonding
|), where the t2g states are occupied leaving one electron in the doubly degenerate eg state at higher energy. In the crystal, the Ni d states are hybridized with the oxygen p states, thus the half-occupied feature at the Fermi level corresponds to the antibonding  band. The unpaired eg Ni electrons occupy half of the
  spin-up band, while the
  spin-down band remains empty. This behavior is reflected in the A peak, which corresponds to the
  spin-up orbitals and is half occupied, as shown in Fig. 3(b). The B peak corresponds to the spin-down
  states.
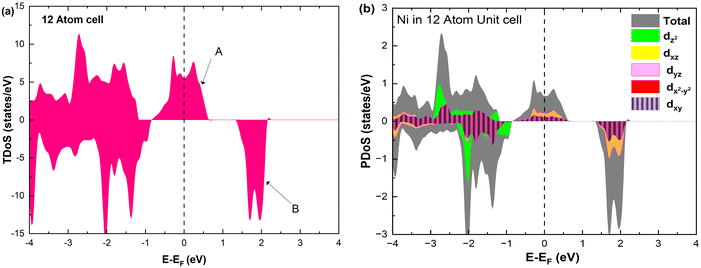 | ||
| Fig. 3 (a) Total density of states, and (b) atom-centered partial density of states in 12-atom fully lithiated LiNiO2. | ||
The Ni3+ cations have an estimated magnetic moment of 1 μB (based on the calculated difference of a Löwdin partition of the up and down spin charge on atoms) and the preferred phase is ferromagnetic. The estimated local magnetic moments on the transition metal cations are reported in Table S1 in the ESI,† under the heading 12 atom.
These results compare well with the calculations reported in the literature, which invariably use the 12-atom cell to describe the fully lithiated R![[3 with combining macron]](https://www.rsc.org/images/entities/char_0033_0304.gif) m LNO.37,39,44
m LNO.37,39,44
The Ni3+ cation with only one electron in the  orbitals is JT unstable. However, the distortions cannot take place in the small 12- and 48-atom cells, thus the octahedra have equal Ni–O bond lengths (see Table 2).
As seen above, a structural distortion takes place instead in the 192-atom supercell, and, as a consequence, the A peak feature at the Fermi level in the TDoS is significantly changed, as shown in Fig. 4(a). The spin-up A band splits into a mostly occupied A1 peak and an empty A2 peak, hinting at the formation of a band gap, and similarly the spin-down B peak splits into B1 and B2. The states just below the Fermi energy show predominant oxygen and, to a lesser extent, nickel character, as shown in Fig. S1 (ESI†). These hybridized (O p-Ni d) energy states are of particular interest, as these are the states from which electrons are removed during the delithiation process.
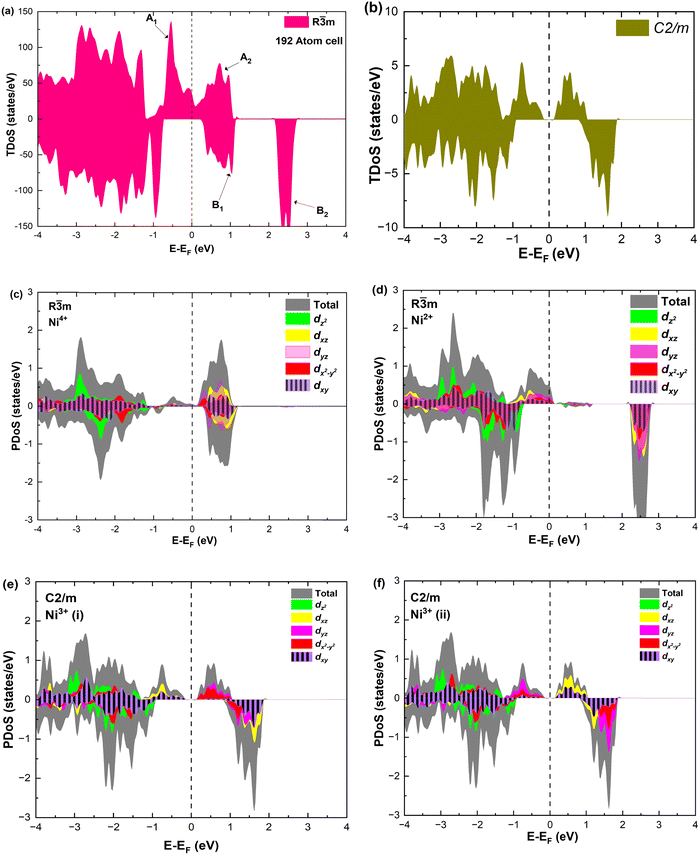 | ||
Fig. 4 TDoS in (a) R![[3 with combining macron]](https://www.rsc.org/images/entities/char_0033_0304.gif) m and (b) C2/m; nickel-atom-centered partial density of states in R m and (b) C2/m; nickel-atom-centered partial density of states in R![[3 with combining macron]](https://www.rsc.org/images/entities/char_0033_0304.gif) m (c) and (d) and in C2/m (e) and (f) in fully lithiated LiNiO2. m (c) and (d) and in C2/m (e) and (f) in fully lithiated LiNiO2. | ||
Analyzing the partial density of states, we find that there are two kinds of Ni ions, as shown in Fig. 4(c) and (d). The  spin-up state of the first kind is almost fully occupied, while that of the second kind is mainly unoccupied. This situation is reflected in their different magnetic moments, as reported in Table S1 (ESI†). From the values reported in the table under the heading “192 Atom cell” and x = 1, we can see that the magnetic moments acquire different values: magnetic moments close to 0 indicate Ni4+ cations, while those around 1.4 are characteristic of Ni2+ (or close to Ni2+) cations.
Thus, Ni ions have two oxidation states: Ni4+ with the  spin-up level completely empty and magnetic moment zero and Ni ions close to the Ni2+ oxidation state with an almost full
  spin-up band and an estimated magnetic moment of about 1.4 μB, much larger than the 1 μB associated with Ni3+. We name these second Ni ions simply as Ni2+. The features of the PDoS can be assigned neatly to these two different Ni cations: the A1 peak is the occupied part of the 3d-eg orbital of Ni2+ (Fig. 4(c)), as well as the empty peak B2, while the empty peaks A2 and B1 belong to Ni4+ (see Fig. 4(b)). The existence of Ni4+ ions in LNO has been calculated previously only when some Li vacancies are present45 and never for the fully lithiated ideal structure. This was due to the use of the smaller unit cells to describe LNO in the layered R
![[3 with combining macron]](https://www.rsc.org/images/entities/char_0033_0304.gif) m space group. Such charge disproportionation into Ni2+ and Ni4+ was calculated before only for the monoclinic P2/c structure34 and in monoclinic C2/m LNO only after one additional Ni ion was inserted into the Li plane.30
m space group. Such charge disproportionation into Ni2+ and Ni4+ was calculated before only for the monoclinic P2/c structure34 and in monoclinic C2/m LNO only after one additional Ni ion was inserted into the Li plane.30
The distorted NiO6 octahedra of the 192-atom supercell lead to the breaking of the eg and t2g orbital degeneracies. The Ni4+ cations (Fig. 4(c)), where the spin-up and spin-down  bands are empty, are at the center of the compressed octahedra with short Ni–O bond lengths (see Table 2). In this case, the (Ni d–O p) hybridization increases and the antibonding
  bands are shifted to higher energies, remaining empty. The Ni2+ cations, instead, are at the center of the expanded octahedra having longer Ni–O bond lengths (Fig. 4(d)). The hybridization in this case decreases and the
  spin-up bands shift down in energy, becoming mostly occupied. The presence of Ni2+ cations in an ideally layered LNO would explain why it is so difficult to obtain samples without Ni in the Li layer, given the very low energy barrier for Ni2+ to replace Li+.
The assignment of the oxidation states of the Ni ions is also validated by calculating the Bader charges of the Ni ions in the 12-atom cell, where Ni are all equivalent and surely Ni3+, obtaining a charge of 16.74 e, and of the Ni ions in the 192-unit cell where we have found two values: a larger charge of 16.80 e and a lower charge of 16.64 e, for the ions we attributed to Ni2+ (or almost Ni2+) and Ni4+.
The TDoS of the C2/m structure shown in Fig. 4(b), depicts band gaps in both spin channels, as found by other authors.7 The PDoS of the two Ni atoms in the primitive cell, shown in Fig. 4(e, f), have the same 0.25 eV band gap which is due to the splitting of the  bands for the JT effect. There is no charge disproportionation in this case, so the Ni oxidation states are Ni3+. For both Ni3+ ions, only the spin-up electron goes in the lowest energy JT-split
  band below the Fermi energy, while the other spin-up band and both the spin-down bands, closer in energy, are empty.
To provide a clear understanding of the difference in the electronic configurations associated with the  spin-up bands in the hexagonal 192-atom supercell and in C2/m, starting from the undistorted octahedra case of the R
![[3 with combining macron]](https://www.rsc.org/images/entities/char_0033_0304.gif) m structure in the primitive 12-atom cell, we show in Fig. 5 a scheme of the different splittings and occupations of the spin-up eg states on the Ni atoms. The eg spin-down orbitals are higher in energy and unoccupied.
m structure in the primitive 12-atom cell, we show in Fig. 5 a scheme of the different splittings and occupations of the spin-up eg states on the Ni atoms. The eg spin-down orbitals are higher in energy and unoccupied.
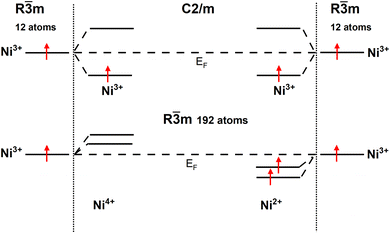 | ||
| Fig. 5 Schematic diagram of Ni d eg spin-up states in the hexagonal 192-atom structure and C2/m structure. | ||
The arrangements of the Ni4+ and Ni2+ ions form in-plane ordered patterns with 9 Ni2+ and 7 Ni4+, as shown in Fig. 6. If the Ni ions are all in the Ni3+ oxidation state, then there will be 16 electrons in the  bands per plane, one per Ni atom. If Ni4+ ions have no electrons in
  , then the 9 Ni2+ need to have a total of 1.78 electrons in
  . Assuming that no charge is transferred to other bands, their average oxidation state is actually +2.22. The Ni2+ ions form two kinds of hexagons: one regular and the other irregular with 9 ions on the perimeter. The hexagons surround three Ni4+ ions. The symmetry of the structure belongs to the hexagonal space group, with 12 symmetry operations, like the structure described with the 12-atom unit cell, but the structural, electronic and magnetic properties are quite different.
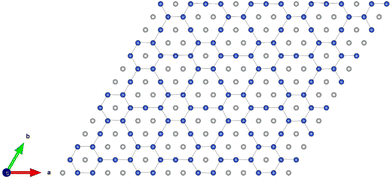 | ||
| Fig. 6 Pattern formed by the Ni4+ (grey) and Ni2+ (blue) cations in the transition metal layers of the 192-atom supercell. | ||
Our calculations have shown the strong dependence of the physical properties of the hexagonal fully lithiated LNO on the choice of unit cell. Since the octahedra have common edges, they cannot distort independently; thus, it is quite possible that the use of even larger unit cells could allow more freedom for octahedral distortion, which could lower the energy even further and lead, possibly, to the opening of a gap between the spin-up states as in the case of the C2/m monoclinic point group, in accordance with the experimental observation of a 0.5 eV gap for the almost stoichiometric LNO in the hexagonal phase.46 However, gaps exhibit excited-state properties and cannot always be correctly predicted by DFT methods. The total energy per atom of LNO in a hexagonal 192-atom cell and C2/m in its primitive 8-atom unit cell are almost the same, within the accuracy error of the calculations.
4. Partially lithiated LNO
4a. Li vacancy mixing energies and structural properties
The structural models of the delithiated LixNiO2 structures are obtained starting from the relaxed hexagonal supercell with 192 atoms used as a template. We know from the literature that during the charge and discharge cycles the delithiated systems undergo various phase transitions (H1, M, H2, and H3, where M stays for Monoclinic and H for Hexagonal) at certain values of Li concentration x, but maintain the layered structure.3,4,12–14To obtain structural models for delithiated LixNiO2, we considered the three layers A, B, and C shown in Fig. 2 and removed the Li atoms from a different number of layers.
Li cations were removed from only one of the three Li planes characterizing the O3 stacking, say the A layer, and named these delithiated configurations as single-layer structures.
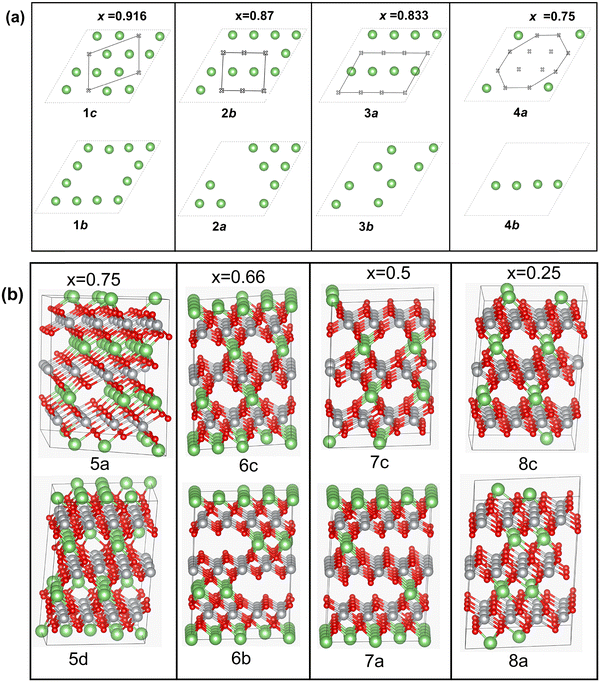
For these single-layer structures, eight different Li vacancy configurations were calculated realizing four concentrations: x = 0.75, 0.625, 0.5, and 0.25. These configurations, named 1c and 1b (x = 0.75), 2a and 2b (x = 0.625), 3a and 3b (x = 0.5), and 4a and 4b (x = 0.25) are shown in Fig. 7(a).
Other delithiated configurations were obtained by removing Li from more than one layer and are named multilayer structures. In the case of the multilayer structures, there are numerous ways in which the Li ions can be removed from each layer. Here, we have considered only some of the possible combinations, since our aim is to obtain a general overview of the trends in the properties of the delithiated structures as a function of Li content x. Some of the structures are shown in Fig. 7(b) while a complete list of the multilayer structures is reported in Table S2 (ESI†), where the positions of the removed Li cations in each layer are given.
For the multilayer structures, we generated a Li vacancy configuration in each Li layer (named a sequence), then we stacked the sequences in different ways on the A, B, and C planes, sometime just repeating the same sequence in all planes, at other times using different sequences in the three planes. We generated 22 different multilayer configurations covering Li concentrations x = 0.916, 0.833, 0.75, 0.667, 0.58, 0.5, 0.41, 0.33, 0.25, 0.167, and 0.083. For each Li content, we compared the energies of two configurations. The two configurations were chosen to have the Li vacancies close to one another or far apart. Li vacancy configurations have been used by other authors5,47,48 using smaller monoclinic unit cells, in which only two oxidized Ni states (Ni3+ and Ni4+) were found as a consequence of delithiation.
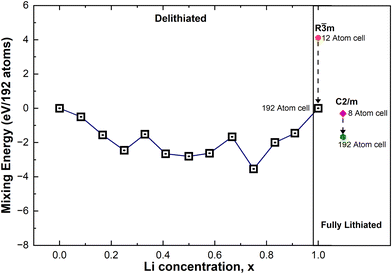
The mixing energies of these partially lithiated LixNiO2 were calculated using eqn (1), and only those whose energy was found to be the lowest are plotted in Fig. 8 (henceforth, we will refer to these structures as “most stable”, but since we have not considered all the possible vacancy configurations over the 48 Li sites in the 192-atom supercell, the structures are just the most stable among those calculated). Nevertheless, even with this limitation, interesting trends can be found. For the same Li content, the multilayer structures generally have lower energy than the single-layer ones, showing that delithiation occurs preferably by removing Li simultaneously from all the layers.
At high values of x, the more stable configurations are characterized by an ordering of the Li vacancies that tends to maximize their mutual distance. This result suggests the existence of a repulsive interaction between the Li-vacancies, which decays with distance. At lower x, when the vacancies need to be closer, the most stable configurations present rows of vacant and occupied Li sites. These chain-like arrangements of Li atoms and Li vacancies seem to characterize favorable Li vacancy arrangements. This could be due to the strong interaction between Li cations of different planes along the direction of the Li–O–Ni–O–Li chains5 that in the presence of Li vacancies will induce JT distortion of the NiO6 octahedra. Indeed, the presence of Li ions and vacancies in ordered interlayer chains favors the collinear formation of JT distortion with smaller lattice strain since channels are formed, as shown in Fig. 7.
The optimized lattice parameters of the delithiated structures are reported in Table S3 (ESI†).
In Fig. 8 we show, together with the mixing energies of the lowest energy delithiated configurations, the energies of the fully lithiated hexagonal and C2/m LNO structures, both calculated using the primitive unit cells (12 atoms for R![[3 with combining macron]](https://www.rsc.org/images/entities/char_0033_0304.gif) m and 8 atoms for C2/m) and 192-atom supercells. The energies are all relative to the energy of the hexagonal 192-atom supercell. We can see that the energy of the hexagonal structure decreases with atomic position optimization, passing from the primitive cell to the supercell, much more than the energy of the monoclinic structure, thus showing a more efficient structural relaxation. The relaxed structures in the 192-atom supercell are much closer in energy: 8.75 meV per atom.
m and 8 atoms for C2/m) and 192-atom supercells. The energies are all relative to the energy of the hexagonal 192-atom supercell. We can see that the energy of the hexagonal structure decreases with atomic position optimization, passing from the primitive cell to the supercell, much more than the energy of the monoclinic structure, thus showing a more efficient structural relaxation. The relaxed structures in the 192-atom supercell are much closer in energy: 8.75 meV per atom.
In Fig. 9, we report the variation of the lattice parameters a = b and c versus Li concentration x. The lattice parameters of the lowest energy structures are reported for each x. The decreasing trend in a is due to the progressive increase in the number of Ni4+ ions, which have a smaller ionic radius (0.46 Å) than Ni2+ (0.69 Å) and Ni3+ (0.56 Å) and are associated with the compressed octahedra. This trend is consistent with the experimental results.16,43 Sharp contraction in the c vertical lattice parameter within the range of 1 < x < 0.80 is due to the emergence of JT-active Ni3+ cations out of the Ni2+ cations. The number of Ni3+ cations and the corresponding JT distortion parameter Δ increase, as shown in Table 3, and they are largest in the Li concentration region 0.50 < x < 0.75 where the layered structure undergoes the observed structural phase transition from the hexagonal H1 to the monoclinic M phase and remains in the monoclinic structure (M) (see Fig. 9). The other dip in the c-axis for x < 0.4 is due to the dominance of Ni4+ ions and low Li content, hence the octahedra become compressed, JT distortion reduces, and interaction of the Ni ions with the O ions increases. The Li interlayer distance reduces as less Li is present and the oxygen atoms do not repel any more as the oxygen electronic −2e charge is now more localized inside the octahedra. The reduction of the JT distortion leads to a new phase transition back to a hexagonal phase. At high delithiation levels, the H3 phase was found to be unstable, probably due to oxygen loss with electrochemically inactive NiO formation. This trend in the c-axis with Li content, similar to that calculated for LixCoO2, was obtained by other authors only after using the SCAN and SCAN + D3 functionals in place of the PBE+U functional used in this work. In that work, PBE+U produced only an ever-decreasing c lattice parameter.49 In our case, the expected trend has been obtained using PBE+U with the larger supercell.
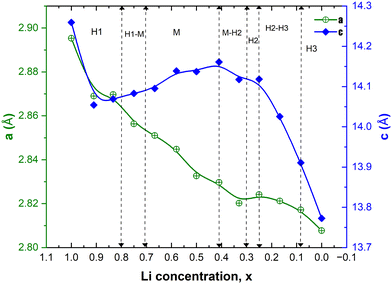 | ||
| Fig. 9 Variation of the crystal lattice parameters, a and c, as a function of Li concentration x. The vertical dashed lines correspond to the Li content at which phase coexistence and phase transition between the hexagonal H and monoclinic M phases have been evidenced by XRD during the charging of the LNO cathode.14 | ||
| Li concentration | No. of Ni cations | Jahn–Teller distortion parameter Δ in LixNiO2 | ||||
|---|---|---|---|---|---|---|
| x | Ni2+ | Ni3+ | Ni4+ | Ni2+ | Ni3+ | Ni4+ |
| 1 | 27 | 0 | 21 | 0.06 | — | 0.04 |
| 0.75 (chain) | 12 | 12 | 24 | 0.11 | 0.20 | 0.03 |
| 0.75 (square) | 12 | 12 | 24 | 0.03 | 0.21 | 0.04 |
| 0.5 | 4 | 18 | 26 | 0.12 | 0.18 | 0.03 |
| 0.25 | 2 | 9 | 37 | 0.11 | 0.16 | 0.02 |
| 0 | 0 | 0 | 48 | 0 | 0 | 0 |
4b. Electronic and magnetic properties
Table 3 reports the number of Ni2+, Ni3+, and Ni4+ ions present in the delithiated LixNiO2 structures for x = 0, 0.25, 0.5, 0.75, and 1.The numbers of different Ni cations were derived by inspection of the PDoS of the single Ni ions (see below) and from the calculated atomic magnetic moments reported in Table S1 (ESI†) under the headings x = 0.25, x = 0.5, and x = 0.75, respectively. From Table S1 (ESI†), we can see that the magnetic moments close to 0 again indicate Ni4+ cations, while those around 0.8 are characteristic of the emerging Ni3+ cations. Finally, the magnetic moments around 1.4 again indicate Ni2+ (or close to Ni2+) cations.
We can see from the table that the number of Ni2+ ions decreases with x, while the number of Ni4+ increases. The number of Ni3+ ions increases until x = 0.5, then decreases. The active electrons are those in the  orbitals and we can see that the numbers of these electrons are approximately 48 (54), 36, 24 (26), 12 (13), and 0, (considering the nominal values of 2 and 1 for Ni2+ and Ni3+, respectively), where in the parentheses are given the actual numbers compared with the nominal ones. These numbers indicate that roughly all the electrons lost by the cell in delithiation are lost by the Ni cations.
The second part of Table 3 reports the Δ parameters relative to the octahedra of the different Ni ions. These parameters are calculated as the difference between the length of the longest and shortest Ni–O bonds in the NiO6 octahedra, as explained in the text and at the bottom of Table 2, and they are an indication of the Jahn–Teller distortion of the octahedron. We can see that the JT distortion is largest for the Ni3+ ions.
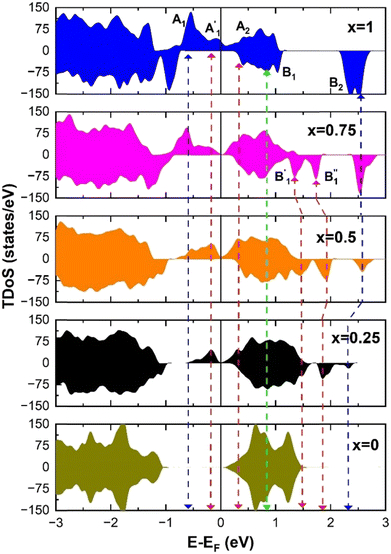
The different Ni oxidation states in the delithiated LixNiO2 structures contribute to the electronic TDoS shown in Fig. 10, for x = 0, 0.25, 0.50, 0.75, and 1. The peaks and features within the energy range from −1 eV to 3 eV correspond, as for the fully lithiated case, to  orbitals. To compare the evolution and shifts of the features, we have chosen for all the partially delithiated structures similar configurations for the arrangement of Li vacancies, specifically a chain-like pattern, with one chain for x = 0.75, two chains for x = 0.50 (see, for example, Fig. 7 case 3a), and three chains for x = 0.25.
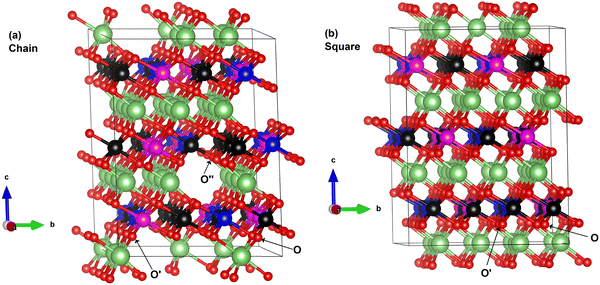
In the case of x = 0.75, the chain arrangement of Li vacancies is not the most stable. Thus, we compare in Fig. 11 the TDoS of the chain arrangement (Fig. 11(a)) with the TDoS of the more stable square arrangement (Fig. 11(b)). The two TDoS are qualitatively similar, since the spin-up and spin-down states fall within the same ranges of energy. The main difference stems from the different heights of the peaks. Peaks are more pronounced for the chain arrangement. Thus, in the case of the chain arrangement the energies of the Ni–O  orbitals fall preferably in narrower intervals, while for the square arrangement their energies are more smoothly distributed over their energy range. Both delithiated configurations have the same number of Ni2+, Ni3+, and Ni4+ cations (see Table 3). However, the chain arrangement has three kinds of oxygen ions: 24 O′′ ions, first neighbors to two Li vacancies, 24 O′ ions, first neighbors to one Li vacancy and 48 O ions bonded to three Li ions. These different kinds of oxygen ions are also arranged in similar chains. The less charged O′′ tend to bond strongly to Ni ions that become Ni4+. This structure has more groups of similar Ni–O bonds than the “square” pattern that has 24 O ions with no first-neighbor vacancies and 72 O′ ions with only one first-neighbor Li vacancy. The O ions are also arranged in a square pattern. In this case, the different kinds and lengths of Ni–O bonds are more uniformly distributed over the structure. This situation is shown in Fig. 12, where in the case of the chain arrangement the groups of chain-aligned O′′–Ni4+ bonds are clearly visible.
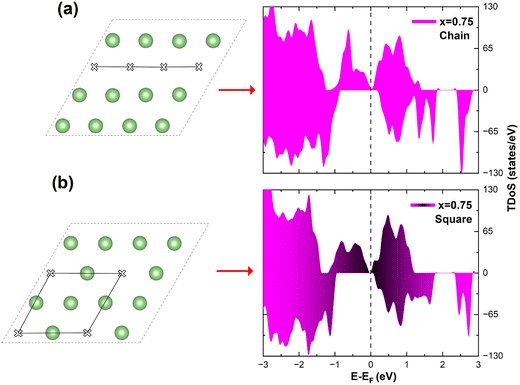 | ||
| Fig. 11 Comparison of TDoS of two delithiated patterns at x = 0.75. (a) Chain delithiation model; (b) square delithiation model. | ||
The main features in the TDoS of Fig. 10 are named A1,  , A2, B1,
  ,
,  , and B2. The A peaks are constituted of spin-up orbitals and the B peaks of spin-down orbitals. A1 and
  are occupied and A2 is empty. We can see that the occupied part of
  progressively reduces with an increase in the number of Li vacancies due to the reduction of available electrons, and the A1 peak height reduces until it disappears at x = 0.25.
To further investigate the relation between the features of the TDoS of LixNiO2 and the oxidation states of the Ni cations, it is instructive to look at the Ni PDoS.
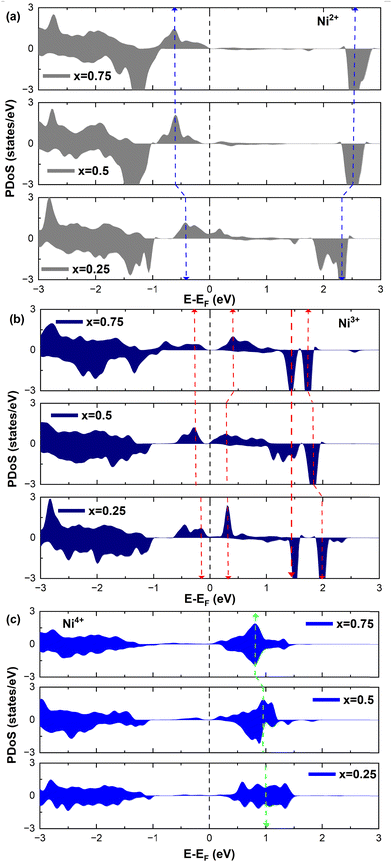
We can clearly distinguish the contributions of the differently oxidized Ni cations by looking at the Ni PDoS shown in Fig. 13. In the fully lithiated LNO, only Ni2+ and Ni4+ are present. The peaks A1 and, to a much lesser extent,  in the occupied part and B2 in the unoccupied part are due to Ni2+ (see Fig. 4(d)), while Ni4+ (Fig. 4(c)) is characterized by only two wide empty features A2 (spin up) and B1 (spin down) in roughly the same energy range (0.3–1.2) eV. As Li vacancies are created, the number of Ni2+ cations decreases and that of Ni3+ increases. We can see from Fig. 13(b) that the Ni3+ cations contribute to the
  spin-up occupied peak near the Fermi level and to the wide empty spin-up feature A2 at about 0.5 eV. Also the empty spin-down split peaks
  and
and  in the energy range from 1 eV to 2 eV are attributed to Ni3+. These features can be compared with the Ni PDoS of the C2/m structure (Fig. 4(e) and (f)), where only Ni3+ cations are present. The
  and
and  peaks widen and slightly shift with delithiation, but are recognizable up to x = 0.25, after which they start to disappear towards the full delithiation limit where only fully oxidized Ni4+ cations are present. With progressive delithiation we see that the occupied spin-up
  features change: the A1 peak (Ni2+) decreases, while
  (Ni3+) increases. At Li concentration lower than x = 0.50, the
  peak decreases and disappears. The PDoS of Ni4+ (Fig. 12(c)) shows wide empty spin-up and spin-down features extending from 0 to 1.5 eV, similar to the TDoS of NiO2 (Fig. 10 at x = 0). The peaks and features of Ni PDoS change with increasing delithiation; in particular, the Ni2+ and Ni3+ PDoS at x = 0.25 undergo considerable modification. One main reason is the shrinking of the cell volume (see Fig. 9), leading to shortening of the Ni–O bonds and related increase in Ni–O interaction. For the antibonding occupied
  orbitals this means a shift towards higher energies. Furthermore, the presence of residual JT-distorted orbitals in the shrunken volume leads to enlarged splitting of the bands. Indeed, the presence of Li vacancies introduces further differences in the strengths of the Ni–O bonds, which also depend on the different charges on the oxygen ions, with the less charged oxygens being those bonded to fewer Li ions.
5. Mn for Ni substitution in LixNiO2
5a. Substitutional Mn mixing energies and structural properties
We substituted 6, 12, and 18 Ni ions over the 48 transition metal sites in the template cell with Mn, realizing Mn concentrations y = 0.125, 0.25, and 0.374 of LixNi(1−y)MnyO2, all within the concentration range for which LNMO compounds have been synthesized in the α-NaFeO2 layered structure.50–52The different Mn in-plane arrangements are reported in Fig. 14. Mn ions are arranged in the same way in all the transition metal layers of O3 stacking.
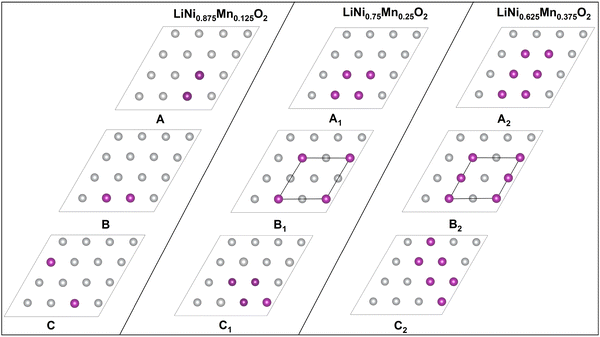 | ||
| Fig. 14 Configurations of Mn ions in the transition metal planes. The purple dots show the positions of the Mn ions. | ||
A, B, and C correspond to 12.5% concentration of Mn atoms, A1, B1, and C1 to 25%, and A2, B2, and C2 to 37.5%. The lowest energy configurations for each Mn concentration in the fully lithiated case were found to be A, B1 and B2, and we used them to optimize the 192-atom supercell for different concentrations of Li vacancies to obtain the optimized lattice parameters.
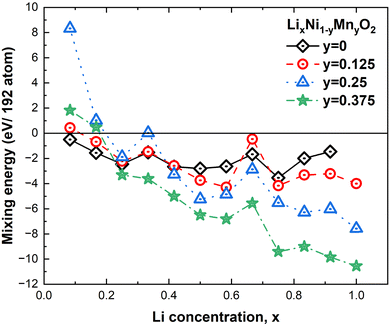
For comparison with the results of the previous section, we considered the same delithiated patterns. In Fig. 15, we report the same trend of the calculated mixing energies as for eqn (2). It is clear that Mn substitution is particularly favorable at low concentrations of Li vacancies, while below x = 0.25 (75% Li vacancies) the presence of Mn becomes less advantageous and for x < 0.2 the compounds with highest Mn concentration are unstable against phase separation. These results are qualitatively in agreement with the trend of previous calculations which considered only the x = 1 and x = 0 cases.53 This result was interpreted in terms of an attractive interaction between the Ni and Mn ions at full lithiation becoming a repulsive one at full delithiation. This result also seems to be contrary to experimental findings where the presence of Mn seems to have a beneficial effect only at high cathode charge voltages. The discrepancy is apparent since in the literature the stabilization effect of Mn is attributed to the pillar effect, that is, to the fact that Mn at low concentrations would induce more Ni2+ defects in the Li layer than in pristine LNO and would favor Li+/Ni2+ mixing. It was shown54 that the number of these Ni2+ defects in the Li layer remains unchanged during charge and discharge cycles, and their presence would avoid the collapse of the Li intercalation layers at high delithiation levels. Our calculations do not consider the presence of such defects, thus, the trend shown in Fig. 15 refers to the case of ideal cathodes without Ni/Li defects.
The changes in the lattice parameters of the supercell as a function of Li and Mn concentrations x and y, respectively are shown in Fig. 16. The a and c parameters follow the same trends with x as LxNO. Both a and c become longer with increasing Mn concentration. This agrees with the experimental results for LiNi0.8−xCo0.1Mn0.1+xO2, with 0.0 ≤ x ≤ 0.08, where the lattice parameters, especially the c lattice parameter, increase with increasing Mn content. The increase was said to be due to the substitution of Ni3+ cations by Mn4+ ions, which have a higher ionic radius, and the consequent reduction in the corresponding number of Ni3+ ions into larger Ni2+ (0.69 Å) to maintain charge neutrality.55,56
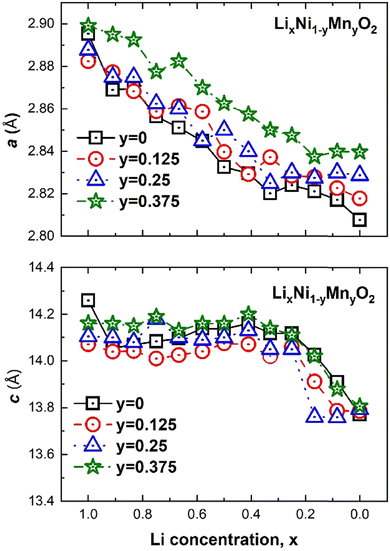 | ||
| Fig. 16 Crystal lattice parameters versus Li concentration x of LixNi(1−y)MnyO2 for the three Mn concentrations: y 12.5%, 25% and 37.5%, respectively. | ||
This interpretation again stems from the assumption that in pristine LNO all Ni is in the Ni3+ oxidation state. Ni2+ or almost Ni2+ are already present in pristine LNO in our case; thus, the larger parameters are attributed to, as we will see below, to the partial substitution of Ni4+ by the larger Mn4+ ions and the increase in the total number of electrochemically active (Ni2+ + Ni3+) cations that are associated with larger octahedra (see Table 4). Apart from the very first value (x = 1.0), the a parameter of LNO (y = 0) follows this trend with the shortest a values, while the behavior of c does not. Indeed, only for y = 0.375 is the c lattice parameter of LixNi(1−y)MnyO2 longer than that in the system without Mn (y = 0). This non-linear trend in the c parameter with y is most likely due to the fact that the A, B1, and B2 Mn arrangements are inserted in lattices with different delithiation patterns for each x. As we will see later, the delithiation pattern and Mn distribution pattern strongly affect each other in determining the electronic configuration of the system. In this paper, we have not searched for the lowest energy structures where the total energy is minimized for both x and y simultaneously, thus, we do not expect a very precise trend in the calculated parameters.
| LixNi1−yMnyO2 | No. of oxidized Ni at Mn substitution | Jahn–Teller distortion parameter Δ in LixNi1−yMnyO2 | ||||||
|---|---|---|---|---|---|---|---|---|
| y | x | Ni2+ | Ni3+ | Ni4+ | Ni2+ | Ni3+ | Ni4+ | Mn4+ |
| 0 | 1 | 27 | 0 | 21 | 0.065 | — | 0.04 | — |
| 0.125 | 1 | 18 | 12 | 12 | 0.06 | 0.21 | 0.04 | 0.06 |
| 0.75 | 10 | 16 (14 up, 2 down) | 16 | 0.1 | 0.21 | 0.03 | 0.05 | |
| 0.5 | 2 | 20 | 20 | 0.03 | 0.19 | 0.06 | 0.06 | |
| 0.25 | 0 | 12 | 30 | — | 0.19 | 0.05 | 0.05 | |
| 0.25 | 1 | 12 | 24 | 0 | 0.02 | 0.22 | — | 0.01 |
| 0.75 (chain) | 2 | 32 (20 up, 12 down) | 2 | 0.07 | 0.25 | 0.06 | 0.05 | |
| 0.75 (square) | 12 | 12 | 12 | 0.04 | 0.27 | 0.06 | 0.05 | |
| 0.5 | 2 | 20 (2 up, 18 down) | 14 | 0.1 | 0.23 | 0.06 | 0.05 | |
| 0.25 | 0 | 12 (1 up, 11 down) | 24 | — | 0.17 | 0.03 | 0.05 | |
| 0.375 | 1 | 18 | 12 | 0 | 0.05 | 0.21 | — | 0.05 |
| 0.75 | 9 | 18 | 3 | 0.07 | 0.21 | — | 0.08 | |
| 0.5 | 4 | 15 | 11 | 0.1 | 0.25 | 0.03 | 0.09 | |
| 0.25 | 2 | 8 | 20 | 0.06 | 0.18 | 0.06 | 0.09 | |
5b. Electronic and magnetic properties
First, looking at the estimated magnetic moments of the transition metals (Table S4, ESI†), we have verified that, as is generally assumed in the literature, the Mn ions are in the Mn4+ inactive oxidation state, in agreement with other calculations53 and most experiments.56Table S4 (ESI†) reports the calculated magnetic moments of Ni ions for three configurations of LNMO corresponding to Mn content y = 0.125, 0.25, and 0.375 (headings LixNi0.875Mn0.125O2, LixNi0.75Mn0.25O2, LixNi0.625Mn0.375O2). For each Mn concentration, different delithiation levels were considered: x = 1 (no Li vacancies), x = 0.75 (25% Li vacancies), x = 0.5 (50% Li vacancies), and x = 0.25 (75% Li vacancies). Mn4+ has magnetic moments around 2.6 μB, while for the Ni ions we again find the usual values.
Table 4 reports the evolution of the number of differently oxidized transition metals as a function of the Li and Mn concentrations x and y, summarizing the data in Table S4 (ESI†). The table also reports the corresponding Δ parameters. Again, the NiO6 octahedra of Ni3+ show the largest value of Δ.
From Table 4, we can obtain the following information:
(i) The number of active electrons N in the  orbitals is determined by the Li concentration. Indeed, if we assign two electrons to Ni2+ and one to Ni3+, we can see that for x = 1 we have about N = 48 electrons in
  , for x = 0.75 N = 36, for x = 0.50 N = 24, and for x = 0.25 N = 12, for all y. This result means that the missing electrons due to delithiation are again taken mainly from the Ni cations.
(ii) The number of Ni4+ cations diminishes as the number of Mn4+ cations increases. Their sum remains approximately the same and increases with an increase in delithiation.
(iii) Comparing similarly delithiated structures, at x = 0.75 and 1, with and without Mn/Ni substitution, we can see an increase in electrochemically active Ni ions, particularly in Ni3+.
(iv) Unlike the results of Table 3, for y ≠ 0, the particular delithiation arrangement matters in the redistribution of electrons and the numbers of Ni2+, Ni3+, and Ni4+ cations. This is shown by the two entries corresponding to x = 0.75 and y = 0.25, where only the in-plane arrangement of Li vacancies is different, for the chain and the square patterns examined above. This means that the arrangement of Mn ions and the arrangement of Li vacancies interact. The square Li vacancy arrangement together with the square arrangement of Mn ions produces the most stable of the structures studied for the same x and y concentrations.
(v) The relationship between Mn4+ ions and Li vacancies can also be seen in a few antiferromagnetic couplings arising in the case of chain delithiation and low Mn concentration. In the case of chain delithiation and low Mn concentration, structural optimization produces a number of singly occupied spin-down  orbitals on Ni ions which were previously Ni4+ ions in the absence of Mn. The antiferromagnetic coupling between the Mn and Ni ions in this case is mediated by the less charged O′′ oxygen atoms, first neighbors to two Li vacancies, present only in the chain delithiation model. The Ni3+ cations with occupied spin-down
  orbitals are, in absence of Mn ions, Ni4+ ions arranged in the chains bonded to four O′′ ions (two below and two above) shown in Fig. 12(a). In this case, electron transfer occurs from and to the
  orbitals through the pσ orbitals of O′′.36,57 However, for Li concentrations as high as x = 0.75, the chain delithiation model is less stable than the square model, where this superexchange effect does not take place. On the other hand, at high levels of delithiation, the O′′ oxygen ions could play an important role in mediating the interaction between Ni and Mn, which is supposed to become repulsive in this limit.
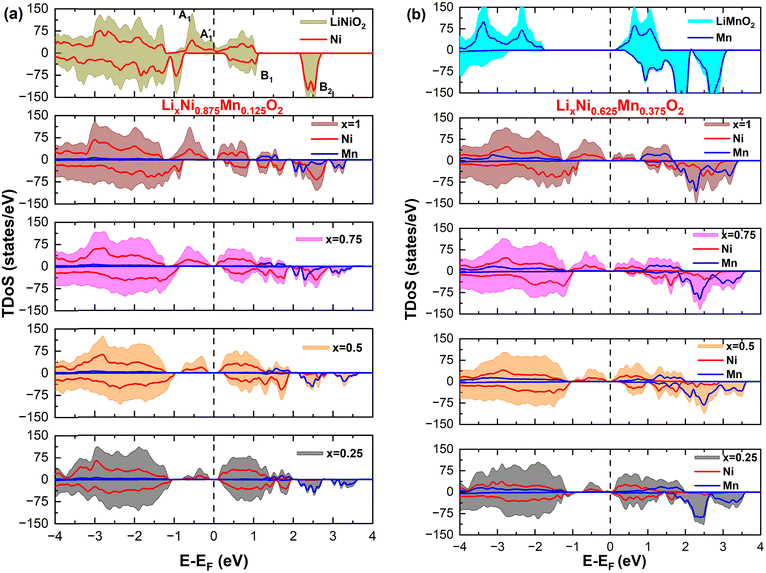
To analyze the global effect on the electronic structure of Mn doping, we calculated the TDoS and local magnetic moments. In Fig. 16, we report the modification of the TDoS with the degree of delithiation. For the occupied  orbitals near the Fermi level, we again see a progressive diminishing of the A peaks. Between the B1 and B2 empty peaks, a number of new structures emerge, some due to the emergence of Ni3+ ions as seen above and others due to the Mn4+ ions. It is shown in Fig. 17 that the Mn
  orbitals (hybridized Mn d–O p) are empty and fall above 1 eV, with a spin-up feature between 1 eV and 2 eV (in correspondence with the spin-down peaks due to N3+) and two negative features between 2 eV and 3.5 eV (the first one in correspondence with the spin-down structures of N2+). These features become larger and merge with an increase in Mn concentration. There are no occupied Mn
  orbitals, in agreement with the assignment of the Mn4+ oxidation state to the Mn ions. Around the Fermi level, the active electronic
  orbitals are still provided by the hybridized Ni d–O p orbitals, where the Ni ions are Ni2+ and Ni3+. Inspection of the Ni ion PDoS around the Fermi level shows similar features to those already reported in Fig. 13. These results confirm that Mn in LixNi(1−y)MnyO2 is electrochemically inactive and its only role is to stabilize the structure. Indeed, it was found that the disordered Ni/Li tends to decrease during cycling and not to increase, which is one reason for the greater stability provided by Mn ions where the fixed number of Ni2+ in the Li layer sustains the structure from collapse at high charge levels.54,58,59
It is generally thought that Mn4+ are responsible for the generation in LNO of Ni2+ cations since, for charge neutrality, in layered LiNiO2 and LiMnO2 the transition metal cations have to be in the Ni3+ and Mn3+ states, respectively. Thus, the presence of Mn4+ ions should be balanced with the simultaneous reduction of Ni3+ to Ni2+ to compensate for the change of Mn3+ to Mn4+. This observation has aroused questions about how to explain the fact that the discharge potentials measured in layered LiNiO2 and LiNi05Mn0.5O2 in the hexagonal phase are practically identical60,61 given that different redox reactions are expected in LiNiO2, where only Ni3+/Ni4+ is supposed to be active, and in LiNi0.5Mn0.5O2, where both Ni2+/Ni3+ and Ni3+/Ni4+ should occur.53 The implication of only Ni3+ ions being present in LNO is due to the fact that the calculations were performed using small supercells for rhombohedral and monoclinic symmetries and these calculations invariably produce only Ni3+ ions, as we have seen above. Moreover, the presence of a few percent of Ni2+ defects in the Li layer of LNO cannot explain the discrepancy, but the charge disproportionation we have found using the supercell can, since the numbers of Ni2+ are similar in LNO and in LiNi05Mn0.5O2 and the charging will create similar numbers of Ni3+ and Ni4+ ions in both systems.
6. Summary and conclusions
In summary, this paper deals with the layered oxide LNO and LMNO materials proposed for Ni-rich cathodes. We first replicated 16 times the primitive cell of the R![[3 with combining macron]](https://www.rsc.org/images/entities/char_0033_0304.gif) m space group, the space group of LNO observed experimentally by XRD, and relaxed both cell parameters and internal positions. The supercell relaxation leads to a large decrease in the total energy accompanied by charge and size disproportionation of the NiO6 octahedra. The charge disproportionation has a large effect on the Ni oxidation states, since there are only Ni2+ and Ni4+ ions, whereas in the smaller primitive unit cells, considered in previous computational studies, all Ni ions are Ni3+. The Ni2+ and Ni4+ ion arrangement forms an ordered superstructure in the ab layers and the superstructure still belongs to the observed hexagonal symmetry. The Ni–O bond lengths form a distribution, as found experimentally, around two average bond lengths whose values are also in agreement with experiment and contrary to the behavior expected for a monoclinic crystal structure. The gain in energy obtained in the atomic relaxation of the supercell compared to that of the primitive cell is much larger than that obtained with an analogous supercell of monoclinic symmetry, although the monoclinic structure still remains more stable. We conclude that the choice of unit cell is important for this class of material and an even larger supercell, or perhaps the inclusion of Ni defects in the Li layer (always present in real samples) may favor the observed hexagonal phase over the monoclinic one at full lithiation. We have found that optimizing larger unit cells leads to the emergence of new structural and electronic behaviors, which remain hidden if using primitive or smaller cells.
m space group, the space group of LNO observed experimentally by XRD, and relaxed both cell parameters and internal positions. The supercell relaxation leads to a large decrease in the total energy accompanied by charge and size disproportionation of the NiO6 octahedra. The charge disproportionation has a large effect on the Ni oxidation states, since there are only Ni2+ and Ni4+ ions, whereas in the smaller primitive unit cells, considered in previous computational studies, all Ni ions are Ni3+. The Ni2+ and Ni4+ ion arrangement forms an ordered superstructure in the ab layers and the superstructure still belongs to the observed hexagonal symmetry. The Ni–O bond lengths form a distribution, as found experimentally, around two average bond lengths whose values are also in agreement with experiment and contrary to the behavior expected for a monoclinic crystal structure. The gain in energy obtained in the atomic relaxation of the supercell compared to that of the primitive cell is much larger than that obtained with an analogous supercell of monoclinic symmetry, although the monoclinic structure still remains more stable. We conclude that the choice of unit cell is important for this class of material and an even larger supercell, or perhaps the inclusion of Ni defects in the Li layer (always present in real samples) may favor the observed hexagonal phase over the monoclinic one at full lithiation. We have found that optimizing larger unit cells leads to the emergence of new structural and electronic behaviors, which remain hidden if using primitive or smaller cells.
Further, we used the calculated superstructure as a template for a study of delithiation in the hexagonal LNO structure. We calculated the energies of a number of structures for different concentrations of Li and studied the evolution of the structural parameters and the electronic structure with the number of Li vacancies. The changes in the a and c lattice parameters are in agreement with previous calculations, and with experiment, at least for the Li concentration for which LNO is in the hexagonal structure. We have found that delithiation leads to changes in the number of Ni ions; in particular, Ni2+ become Ni3+ and Ni4+, the dominant Ni ion at high battery charging levels. Ni3+ and its related JT octahedral distortions become the dominant ions at Li concentrations of LNO in the monoclinic phase.
Finally, we analyzed the changes in the properties of the delithiated structures when 12.5%, 25% and 37.5% of Ni ions are substituted with Mn ions. We found that the way Mn affects the lattice parameters and electronic structure depends on the arrangement of the Mn ions in the transition metal layers and Li vacancies in the Li layers. However, in all cases, the Mn ions are always in the Mn4+ oxidation state and do not participate actively in the redox reactions determining the battery charge and discharge potentials, since the important electronic states around the Fermi level involved in the reactions belong only to the Ni2+ and Ni3+ ions. The presence of a large number of Ni2+ ions in pristine LNO can explain the similarity between the LNO and LiNi05Mn0.5O2 discharge potentials found experimentally, since both Ni2+/Ni3+ and Ni3+/Ni4+ redox pairs can be present in the initial stages of charging in both systems.
Author's contributions
Saleem Yousuf performed calculations. Contribution in writing the paper. Made figures and tables. Interpretation of simulation results. Md Maruf Mridha performed calculations. Rita Magri Conceptualization. Validation of calculations. Interpretation of simulation results. Writing of paper. Supervision. Acquisition of funding.Data availability
The raw data required to reproduce these findings are available upon request.Conflicts of interest
There are no conflicts to declare.Acknowledgements
This research was developed under the framework of the BAT4EVER project that has received funding from the European Union's Horizon 2020 research and innovation program under Grant Agreement No. 957225. The authors would also like to acknowledge the CINECA HPC facility for the approved ISCRA B (IscrB_CATCH22 and IscrB_LION-CAT). R. M. acknowledges the PNRR MUR project ECS_00000033_ECOSISTER. R. M. acknowledges the PIANO NAZIONALE DI RIPRESA E RESILIENZA (PNRR) – MISSIONE 4 COMPONENTE 2, “Dalla ricerca all’impresa” INVESTIMENTO 1.4, Potenziamento strutture di ricerca e creazione di “campioni nazionali di R&S” su alcune Key Enabling Technologies, finanziato dall’Unione europea – NextGenerationEU – Progetto identificato con codice CN00000023. Titolo “Sustainable Mobility Center (Centro Nazionale per la Mobilità Sostenibile – CNMS)” – Spoke 12 – Avviso MUR 3138/2021 modificato con DD 3175/2021. This manuscript reflects only the authors’ views and opinions, neither the European Union nor the European Commission can be considered responsible for them.References
- F. Xiong, H. J. Yan, Y. Chen, B. Xu, J. X. Le and C. Y. Ouyang, The Atomic and Electronic Structure Changes Upon Delithiation of LiCoO2: From First Principles Calculations, Int. J. Electrochem. Sci., 2012, 7, 9390–9400 CrossRef CAS
.
- F. Kong,
et al., Kinetic Stability of Bulk LiNiO2 and Surface Degradation by Oxygen Evolution in LiNiO2-Based Cathode Materials, Adv. Energy Mater., 2019, 9, 1802586, DOI:10.1002/aenm.201802586
.
- M. Bianchini, M. Roca-Ayats, P. Hartmann, T. Brezesinski and J. Janek, There and Back Again—The Journey of LiNiO2 as a Cathode Active Material, Angew. Chem., Int. Ed., 2019, 58(31), 10434–10458, DOI:10.1002/anie.201812472
.
- W. Liu,
et al., Nickel-Rich Layered Lithium Transitional-Metal Oxide for High-Energy Lithium-Ion Batteries, Angew. Chem., Int. Ed., 2015, 54(15), 4440–4458, DOI:10.1002/ange.201409262
.
- M. E. Arroyo y de Dompablo, C. Marianetti, A. Van der Ven and G. Ceder, Jahn-Teller Mediated Ordering in Layered LixMO2 Compounds, Phys. Rev. B: Condens. Matter Mater. Phys., 2001, 63(14), 144107, DOI:10.1103/PhysRevB.63.144107
.
- H. Das, A. Urban, W. Huang and G. Ceder, First-Principles Simulation of the (Li-Ni-Vacancy)O Phase Diagram and Its Relevance for the Surface Phases in Ni-Rich Li-Ion Cathode Materials, Chem. Mater., 2017, 29(18), 7840–7851, DOI:10.1021/acs.chemmater.7b02546
.
- Z. Chen, H. Zou, X. Zhu, J. Zou and J. Cao, First-principle investigation of Jahn-Teller distortion and topological analysis of chemical bonds in LiNiO2, J. Solid State Chem., 2011, 184(7), 1784–1790, DOI:10.1016/j.jssc.2011.05.024
.
- H. Arai, S. Okada, Y. Sakurai and J.-I. Yamaki, Thermal behavior of Li1−yNiO2 and the decomposition mechanism, Solid State Ionics, 1998, 109, 295–302 CrossRef CAS
.
- H. Arai, M. Tsuda, K. Saito, M. Hayashi, K. Takei and Y. Sakurai, Structural and thermal characteristics of nickel dioxide derived from LiNiO2, J. Solid State Chem., 2002, 163(1), 340–349, DOI:10.1006/jssc.2001.9428
.
- L. Giordano,
et al., Chemical Reactivity Descriptor for the Oxide-Electrolyte Interface in Li-Ion Batteries, J. Phys. Chem. Lett., 2017, 8(16), 3881–3887, DOI:10.1021/acs.jpclett.7b01655
.
- M. Gauthier,
et al., Electrode-Electrolyte Interface in Li-Ion Batteries: Current Understanding and New Insights, J. Phys. Chem. Lett., 2015, 6(22), 4653–4672, DOI:10.1021/acs.jpclett.5b01727
.
- L. de Biasi,
et al., Phase Transformation Behavior and Stability of LiNiO2 Cathode Material for Li-Ion Batteries Obtained from In Situ Gas Analysis and Operando X-Ray Diffraction, ChemSusChem, 2019, 12(10), 2240–2250, DOI:10.1002/cssc.201900032
.
- M. Mock, M. Bianchini, F. Fauth, K. Albe and S. Sicolo, Atomistic understanding of the LiNiO2-NiO2phase diagram from experimentally guided lattice models, J. Mater. Chem. A, 2021, 9(26), 14928–14940, 10.1039/d1ta00563d
.
- H. Li, N. Zhang, J. Li and J. R. Dahn, Updating the Structure and Electrochemistry of LixNiO2 for 0 ≤ x ≤ 1, J. Electrochem. Soc., 2018, 165(13), A2985–A2993, DOI:10.1149/2.0381813jes
.
- T. Ohzuku, A. Ueda and M. Nagayama, Electrochemistry and Structural Chemistry of LiNiO2 (R-3m) for 4 Volt Secondary Lithium Cells, J. Electrochem. Soc., 1993, 140(7), 1862–1870 CrossRef CAS
.
- J. H. Chung,
et al., Local structure of LiNiO2 studied by neutron diffraction, Phys. Rev. B: Condens. Matter Mater. Phys., 2005, 71(6), 1–11, DOI:10.1103/PhysRevB.71.064410
.
- A. Rougier, C. Delmas and A. V. Chadwick, Non-cooperative Jahn-Teller effect in LiNiO2: An EXAFS study, Solid State Commun., 1995, 94(2), 123–127 CrossRef CAS
.
- J. Cao, H. Zou, C. Guo, Z. Chen and S. Pu, Local trimer orbital ordering in LiNiO2 studied by quantitative convergent beam electron diffraction technique, Solid State Ionics, 2009, 180(20–22), 1209–1214, DOI:10.1016/j.ssi.2009.06.009
.
- H. Zhang, Y. Zhong, C. Ouyang, X. Gong and H. Xiang, Theoretical study on the magnetic properties of cathode materials in the lithium–ion battery, J. Chem. Phys., 2023, 158(12), 124702 CrossRef CAS PubMed
.
- S. Sicolo, M. Mock, M. Bianchini and K. Albe, And Yet It Moves: LiNiO2, a Dynamic Jahn-Teller System, Chem. Mater., 2020, 32(23), 10096–10103, DOI:10.1021/acs.chemmater.0c03442
.
- K. Foyevtsova, I. Elfimov, J. Rottler and G. A. Sawatzky, LiNiO2 as a high-entropy charge- and bond-disproportionated glass, Phys. Rev. B, 2019, 100(16), 1–7, DOI:10.1103/PhysRevB.100.165104
.
- J. M. Sanchez, F. Ducastelle and D. Gratias, Generalized Cluster Description of Multicomponent Systems, Phys. A, 1984, 128(1–2), 334–350 CrossRef
.
- K. Mizushima, P. C. Jones, P. J. Wiseman and J. B. Goodenough, LixCoO2 (0 < x < 1): A New Cathode Material For Batteries Of High Energy Density, Mater. Res. Bull., 1980, 15, 783–789 CrossRef CAS
.
- A. R. Armstrong and P. G. Bruce, Synthesis of Layered LiMnO2 as an electrode for rechargeable lithium batteries, Nature, 1996, 381, 499–500 CrossRef CAS
.
- W.-S. Yoon, M. Balasubramanian, X.-Q. Yang, Z. Fu, D. A. Fischer and J. McBreen, Soft X-Ray Absorption Spectroscopic Study of a LiNi0.5Mn0.5O2 Cathode during Charge, J. Electrochem. Soc., 2004, 151(2), A246, DOI:10.1149/1.1637896
.
- W. S. Yoon, Y. Paik, X. Q. Yang, M. Balasubramanian, J. McBreen and C. P. Grey, Investigation of the local structure of the LiNi0.5Mn0.5O2 cathode material during electrochemical cycling by X-ray absorption and NMR spectroscopy, Electrochem. Solid-State Lett., 2002, 5(11), A263–A266, DOI:10.1149/1.1513001
.
- H. Li, M. Cormier, N. Zhang, J. Inglis, J. Li and J. R. Dahn, Is Cobalt Needed in Ni-Rich Positive Electrode Materials for Lithium Ion Batteries?, J. Electrochem. Soc., 2019, 166(4), A429–A439, DOI:10.1149/2.1381902jes
.
- A. Van Der Ven and G. Ceder, Ordering in Lix(Ni0.5Mn0.5)O2 and its relation to charge capacity and electrochemical behavior in rechargeable lithium batteries, Electrochem. Commun., 2004, 6(10), 1045–1050, DOI:10.1016/j.elecom.2004.07.018
.
- K. Kang, Y. S. Meng, J. Breger, C. P. Grey and G. Ceder, Electrodes with High Power and High Capacity for Rechargeable Lithium Batteries, Science, 2006, 311(5763), 977–980, DOI:10.1126/science.1122882
.
- F. Kong, C. Liang, R. C. Longo, Y. Zheng and K. Cho, Atomic-scale understanding of non-stoichiometry effects on the electrochemical performance of Ni-rich cathode materials, J. Power Sources, 2018, 378, 750–758, DOI:10.1016/j.jpowsour.2018.01.008
.
- P. Giannozzi,
et al., QUANTUM ESPRESSO: A modular and open-source software project for quantum simulations of materials, J. Phys.: Condens. Matter, 2009, 21(39), 1–19, DOI:10.1088/0953-8984/21/39/395502
.
- J. P. Perdew, K. Burke and M. Ernzerhof, Generalized Gradient Approximation Made Simple, Phys. Rev. Lett., 1996, 77(18), 3865–3868 CrossRef CAS PubMed
.
- S. L. Dudarev, G. A. Botton, S. Y. Savrasov, C. J. Humphreys and A. P. Sutton, Electron-energy-loss spectra and the structural stability of nickel oxide: An LSDA+U study, Phys. Rev. B, 1998, 57(3), 1505–1509 CrossRef CAS
.
- H. Chen, C. L. Freeman and J. H. Harding, Charge Disproportionation and Jahn-Teller distortion in LiNiO2 and NaNiO2: A Density Functional Theory Study, Phys. Rev. B: Condens. Matter Mater. Phys., 2011, 84(8), 1–7, DOI:10.1103/PhysRevB.84.085108
.
- G. Houchins and V. Viswanathan, Towards Ultra Low Cobalt Cathodes: A High Fidelity Computational Phase Search of Layered Li-Ni-Mn-Co Oxides, J. Electrochem. Soc., 2020, 167(7), 070506, DOI:10.1149/2.0062007jes
.
- M. V. Mostovoy and D. I. Khomskii, Orbital Ordering in Frustrated Jahn-Teller Systems with 90° Exchange, Phys. Rev. Lett., 2002, 89(22), 1–4, DOI:10.1103/PhysRevLett.89.227203
.
- A. Chakraborty, M. Dixit, D. Aurbach and D. T. Major, Predicting accurate cathode properties of layered oxide materials using the SCAN meta-GGA density functional, npj Comput. Mater., 2018, 4(60), 1–9, DOI:10.1038/s41524-018-0117-4
.
- S. Laubach,
et al., Changes in the crystal and electronic structure of LiCoO2 and LiNiO2 upon Li intercalation and de-intercalation, Phys. Chem. Chem. Phys., 2009, 11(17), 3278–3289, 10.1039/b905911n
.
- M. Tuccillo, O. Palumbo, M. Pavone, A. B. Muñoz-García, A. Paolone and S. Brutti, Analysis of the phase stability of LiMO2 layered oxides (M = Co, Mn, Ni), Crystals, 2020, 10(6), 1–14, DOI:10.3390/cryst10060526
.
- W. Li, J. N. Reimers and J. R. Dahn, In situ X-ray diffraction and electrochemical studies of Li1−xNiO2, Solid State Ionics, 1993, 67(1–2), 123–130 CrossRef CAS
.
- P. Kalyani and N. Kalaiselvi, Various aspects of LiNiO2 chemistry: A review, Sci. Technol. Adv. Mater., 2005, 6(6), 689–703, DOI:10.1016/j.stam.2005.06.001
.
- C. A. Marianetti, G. Ceder and D. Morgan, First-principles investigation of the cooperative Jahn-Teller effect for octahedrally coordinated transition-metal ions, Phys. Rev. B: Condens. Matter Mater. Phys., 2001, 63(22), 224304, DOI:10.1103/PhysRevB.63.224304
.
- A. Rougier, A. V. Chadwick and C. Delmas, XAS study of lithium nickel oxide, Nucl. Instrum. Methods Phys. Res., B, 1995, 97(1–4), 75–77 CrossRef CAS
.
- S. Laubach,
et al., Changes in the crystal and electronic structure of LiCoO2 and LiNiO2 upon Li intercalation and de-intercalation, Phys. Chem. Chem. Phys., 2009, 11(17), 3278–3289, 10.1039/b905911n
.
- Y. Jia,
et al., Breaking the energy density limit of LiNiO2: Li2NiO3 or Li2NiO2?, Sci. China Mater., 2022, 65(4), 913–919, DOI:10.1007/s40843-021-1827-x
.
- P. Kuiper, G. Kruizinga, J. Ghijsen, G. A. Sawatzky and H. Verweij, Character of Holes in LixNi1−xO and Their Magnetic Behavior, Phys. Rev. Lett., 1989, 62(2), 221–224 CrossRef CAS PubMed
.
- H. Li,
et al., New Insights into Lithium Hopping and Ordering in LiNiO2 Cathodes during Li (De)intercalation, Chem. Mater., 2021, 33(24), 9546–9559, DOI:10.1021/acs.chemmater.1c02680
.
- M. E. Arroyo y de Dompablo and G. Ceder, First-principles calculations on LixNiO2: Phase stability and monoclinic distortion, J. Power Sources, 2003, 119–121, 654–657, DOI:10.1016/S0378-7753(03)00199-X
.
- A. Chakraborty,
et al., Layered Cathode Materials for Lithium-Ion Batteries: Review of Computational Studies on LiNi1−x−yCoxMnyO2 and LiNi1−x−yCoxAlyO2, Chem. Mater., 2020, 32(3), 915–952, DOI:10.1021/acs.chemmater.9b04066
.
- E. Rossen, C. D. W. Jones and J. R. Dahn, Structure and electrochemistry of LixMnyNi1−yO2, Solid State Ionics, 1992, 57, 311–318 CrossRef CAS
.
- R. Ma,
et al., Tuning Cobalt-Free Nickel-Rich Layered LiNi0.9Mn0.1O2 Cathode Material for Lithium-Ion Batteries, ChemElectroChem, 2020, 7(12), 2637–2642, DOI:10.1002/celc.202000443
.
- T. Xu, F. Du, L. Wu, Z. Fan, L. Shen and J. Zheng, Boosting the electrochemical performance of LiNiO2 by extra low content of Mn-doping and its mechanism, Electrochim. Acta, 2022, 417, 1–10, DOI:10.1016/j.electacta.2022.140345
.
- J. Reed and G. Ceder, Charge, potential, and phase stability of layered Li(Ni0.5Mn0.5)O2, Electrochem. Solid-State Lett., 2002, 5(7), A145–A148, DOI:10.1149/1.1480135
.
- S. Aryal, J. L. Durham, A. L. Lipson, K. Z. Pupek and O. Kahvecioglu, Roles of Mn and Co in Ni-rich layered oxide cathodes synthesized utilizing a Taylor Vortex Reactor, Electrochim. Acta, 2021, 391, 1–9, DOI:10.1016/j.electacta.2021.138929
.
- J. Zheng, W. H. Kan and A. Manthiram, Role of Mn content on the electrochemical properties of Nickel-Rich layered LiNi0.8−xCo0.1Mn0.1 + xO2 (0.0 ≤ x ≤ 0.08) cathodes for lithium-ion batteries, ACS Appl. Mater. Interfaces, 2015, 7(12), 6926–6934, DOI:10.1021/acsami.5b00788
.
- Y. K. Sun, D. J. Lee, Y. J. Lee, Z. Chen and S. T. Myung, Cobalt-free nickel rich layered oxide cathodes for lithium-ion batteries, ACS Appl. Mater. Interfaces, 2013, 5(21), 11434–11440, DOI:10.1021/am403684z
.
- J. Kanamori, Superexchange Interaction And Symmetry Properties Of Electron Orbitals, J. Phys. Chem. Solids, 1959, 10, 87–98 CrossRef CAS
.
- H. Yu,
et al., Study of the lithium/nickel ions exchange in the layered LiNi0.42Mn0.42Co0.16O2 cathode material for lithium ion batteries: Experimental and first-principles calculations, Energy Environ. Sci., 2014, 7(3), 1068–1078, 10.1039/c3ee42398k
.
- J. C. Knight and A. Manthiram, Effect of nickel oxidation state on the structural and electrochemical characteristics of lithium-rich layered oxide cathodes, J. Mater. Chem. A, 2015, 3(44), 22199–22207, 10.1039/c5ta05703e
.
- Z. Lu, D. D. MacNeil and J. R. Dahn, Layered cathode materials Li[NixLi(1/3−2x/3)Mn(2/3−x/3)]O2 for lithium-ion batteries, Electrochem. Solid-State Lett., 2001, 4(11), A191–A194, DOI:10.1149/1.1407994
.
- C. Delmas,
et al., On the behavior of the LixNiO2 system: an electrochemical and structural overview, J. Power Sources, 1997, 68(1), 120–125 CrossRef CAS
.
Footnote |
| † Electronic supplementary information (ESI) available. See DOI: https://doi.org/10.1039/d3ma00906h |
| This journal is © The Royal Society of Chemistry 2024 |

