 Open Access Article
Arresting Tollens’ reagent's reaction on a glass surface as the easiest method to fabricate Ag nanocluster-based SERS substrates for glucose sensing†
Venkataramanaiah
Ingilala
a,
Chandrahas
Bansal
a,
Vadali Venkata Satya Siva
Srikanth
 *b and
Rajanikanth
Ammanabrolu
*a
aSchool of Physics, University of Hyderabad, Hyderabad 500046, India. E-mail: ammanabrolu@uohyd.ac.in
bSchool of Engineering Sciences and Technology, University of Hyderabad, Hyderabad 500046, India. E-mail: vvsssse@uohyd.ac.in
First published on 21st December 2023
Abstract
Fabrication of Ag nanocluster-based SERS substrates is cumbersome and needs high-end processing equipment. On the contrary, we report a fabrication method that is the easiest fabrication method reported to date. We fabricated Ag nanocluster-based SERS substrates by arresting Tollens’ reagent's reaction on the surface of a typical glass substrate.
Sensing low-concentration analytes based on surface enhanced Raman scattering (SERS) entails active substrates that can be easily fabricated and offer significant signal enhancement factors. In this context, silver (Ag) nanocluster-based SERS substrates have attracted great attention owing to their both scientific and practical advantages.1 When a visible LASER light is shone on Ag nanocluster-based SERS substrates, they exhibit visible to near-infrared range local surface plasmonic resonance frequencies, leading to Raman scattering events with extraordinary signal enhancement factors.2 The best Ag nanoclusters showing SERS activity are deposited on glass substrates, commonly using electrodeposition2 or a nanocluster deposition system based on the plasma inert gas phase condensation technique.3 However, these techniques are cumbersome and expensive. Here, we experimentally elucidate the easiest method reported to date to fabricate Ag nanocluster-based SERS substrates. This method involves arresting the reaction of the Tollens’ reagent on the surface of a typical glass substrate, resulting in the deposition of SERS active Ag nanoclusters on the glass surface. We also experimentally elucidate the potential of the fabricated SERS substrates in detecting D-glucose in the range of 0.5 mmol L−1 to 20 μmol L−1 (in aqueous solutions), the glucose level range in typical human body fluids such as urine and saliva.
In the well-known Tollens’ test, the Tollens’ reagent (Ag(NH3)2OH) undergoes reduction, forming a continuous metallic Ag film on a glass slide.4 However, it is possible to form Ag nanoclusters on a glass slide instead of a continuous Ag thin film by strictly controlling two reduction parameters, namely the reduction time (2–3 min) and temperature (25 °C), and washing the Ag nanocluster-deposited glass surface with laminar flow of DI water. The time optimized to abruptly stop the Tollens’ reagent reaction facilitated the arrest of the typical film growth in 3D, including the one along the plane of the glass surface. The details of the fabrication are as follows: firstly, 0.3 mol L−1 Tollens’ reagent was freshly prepared by uniformly dissolving an appropriate amount of silver nitrate (AgNO3) in water. Then, 1.25 mol L−1 sodium hydroxide (NaOH) was added to AgNO3 solution, which resulted in a brown precipitate of Ag2O. Furthermore, ammonium hydroxide (NH4OH) solution was added drop by drop to this solution until the precipitated Ag2O was dissolved entirely to get a clear solution. This ammoniacal solution containing Ag(NH3)2OH (silver diamine hydroxide, the silver complex), when reacted with a formyl group-containing compound such as D-glucose on a suitable surface (here, a glass surface), reduces to Ag on the surface.4 Typical microscopic glass slides (Corning) with dimensions 75 × 29 × 1 mm3 are considered for Ag nanocluster deposition. The microscopic slides were cleaned with soap water and concentrated nitric acid and then rinsed thoroughly with milli Q water in subsequential steps. The cleaned microscopic slide was placed in a Petri dish. The dish was then filled with the freshly prepared Tollens’ reagent and 1 mol L−1 glucose solution, reducing the Ag complex to Ag on the glass slide. However, the reduction reaction was interrupted by removing the glass slide after 2–3 min and immediately cleaning with DI water to remove any unreacted chemicals on the surface.
The surface of the glass slide was characterized using a scanning electron microscope operated at 5 kV by recording the morphology of Ag (Fig. 1) formed on the surface. It is clear from Fig. 1(a) that Ag nanoclusters (Fig. S1, ESI†) have formed instead of a continuous Ag film because the Tollens’ reagent reaction was not allowed to continue. However, the Ag nanoclusters must have plasmonic excitation near the LASER wavelength used in the Raman spectroscopy measurements to show enhanced Raman signal intensity. An indirect way of ascertaining this is studying the optical absorption of the Ag nanoclusters and achieving enhanced optical absorption close to the wavelength of the Raman LASER (here it is 532 nm).5
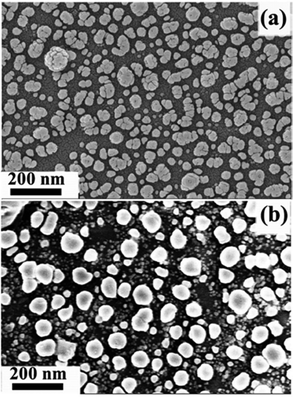 | ||
| Fig. 1 Scanning electron micrographs of Ag nanoclusters. (a) Microstructure of the as-deposited Ag nanoclusters. (b) Microstructure of the Ag nanoclusters after heat treatment. The corresponding cluster size distributions are shown in Fig. S1, ESI.† | ||
Even though the as-prepared Ag nanoclusters showed optical absorption in the visible region (Fig. 2), to achieve a better absorption at a higher wavelength (i.e., closer to 532 nm), the size of the clusters was equilibrated (due to agglomeration of much smaller nearby clusters) by annealing the as-prepared substrate at 300 °C under an Ar atmosphere for 2 h. Annealing is expected to gradually increase the breakage of the surface Ag–O bonds, thereby increasing the metallic Ag on the surface. At the end of the annealing process, the metallic Ag becomes predominant on the surface. However, retaining the initial quasi-globular shape of the clusters is essential for achieving SERS activity. By comparing Fig. 1(a) and (b), it is clear that there is a cluster-size equilibration with a negligible change in the shape of the clusters after annealing. Consequently, the annealed Ag nanoclusters showed optical absorption at a higher wavelength in the visible region (Fig. 2). It should be noted that the cluster size equilibration is well-known and has also been observed in the case of Ag clusters deposited by the vapor condensation technique.3
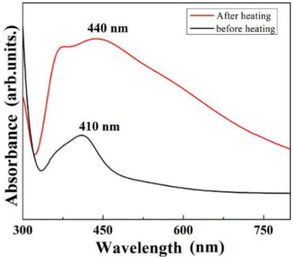 | ||
| Fig. 2 Optical absorption spectra of the Ag nanocluster-deposited glass slide under as-prepared (before heating) and post-heat-treated conditions. | ||
The annealed Ag nanoclusters are considered for further surface functionalization with 2-thienyl boronic acid (2TBA) using a procedure similar to that reported in the literature.3 The heat-treated Ag nanoclusters are surface functionalized with 10 μL of 1 mmol L−1 2TBA solution. This step is essential because D-glucose molecules (to be detected) have a low affinity for Ag; therefore, they do not attach directly to the Ag surfaces.6 2TBA acts as a linker molecule to D-glucose. 2TBA attaches to the Ag surface through its thienyl radicals and D-glucose through boronic acid.7 The D-glucose solution (one concentration in each experiment) was drop cast on the 2TBA functionalized heat-treated Ag nanoclusters using a micro-pipette after confirming the attachment of 2TBA to the heat-treated Ag nanoclusters. The D-glucose solution was allowed to dry naturally (i.e., under ambient conditions) in each experiment before obtaining the SERS data. SERS data were collected in all cases using a 532 nm green LASER with a spectral resolution of 1 cm−1. In each SERS experiment, the data were recorded at ten representative spots on the surface with D-glucose. Then, the data‡ were averaged, analyzed, and presented.
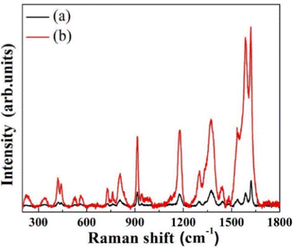
As a preliminary assessment, the Raman enhancement on the heat-treated Ag nanoclusters was recorded using 0.01 mol L−1 crystal violet (CV) as the analyte. The Raman spectra of CV on the heat-treated Ag nanoclusters and a glass slide without the Ag nanoclusters are compared, as shown in Fig. 3.‡
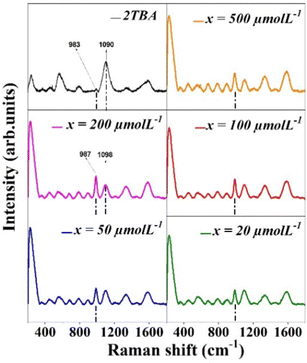
It is clear from Fig. 3(a) that the chemical Raman signal enhancement is insignificant in the case of CV on the glass substrate. Therefore, the plasmonic enhancement effect is attributed to the significant enhancement of the Raman signal in the case of annealed Ag nanoclusters (Fig. 3b). It has been observed that the intensity of all the prominent Raman bands at 1620, 1588, 1546, 1372, 1306, 1177, 915, and 809 cm−1 (corresponding to typical vibrational modes in CV) has increased manyfold.8 Inferences from the analysis of the Raman spectra of CV (Fig. 3): any analyte (such as CV,3,9 Rhodamine6G,10etc.) constituting N atoms is attached to Ag through the Ag–N bond, which is reflected in a signature Ag–N stretching vibrational Raman band at 230 cm−1, as observed in the case of the Ag–CV complex.11 This leads to an exciting result: the plasmonic enhancement for the Raman modes of the analyte molecules will be the largest for the bonds that lie closest to the Ag surfaces since the plasmonic electric field will be very close to the Ag surfaces. That this is indeed true can be inferred from the fact that the observed enhancement is the largest (the measured enhancement factor is ∼26) for the 1546 cm−1 band, which arises from the bond between the N atom and the C atom of the phenyl radical and which lies close to the Ag surfaces since the attachment of CV to Ag takes place at the N atom of CV. Furthermore, the measured SERS enhancement factors differed for each Raman band, the largest being ∼26 for the 1546 cm−1 band. The plasmonic enhancement factor for the bonds far from the Ag surfaces is about 6 for the Raman bands in the range 809–1370 cm−1 as these arise from the modes of C–Ccent–C atoms. Ccent refers to the central carbon atom in the CV molecule to which the three phenyl radicals of the molecule are attached. The enhancement factors for the Raman bands at 1620 cm−1 and 1588 cm−1 (which arise from the C–C bonds of the phenyl radical) are 11 and 18, respectively, as these lie at an intermediate distance from the Ag surfaces. The preliminary assessment showed that the prepared annealed Ag nanoclusters exhibit excellent, unambiguous, and scientifically explainable SERS activity (Fig. S2, ESI†). Consequently, the annealed Ag nanoclusters are used to detect D-glucose through SERS. Fig. 4 shows the SERS data of various D-glucose concentrations (0–500 μmol L−1) on the annealed Ag nanoclusters.
In Fig. 4, the Raman signal collected without D-glucose on the 2TBA functionalized annealed Ag nanoclusters confirms the attachment of 2TBA to the Ag nanoclusters. The Raman band assignments to the bonds in 2TBA are as follows: the bands at 983 cm−1 and 1090 cm−1, respectively, are assigned to the B–O and C–C stretching mode/C–H bending mode, respectively.3,12 The band at 255 cm−1 is attributed to the Ag–S bond, and it confirms that 2TBA attaches to the Ag surfaces through its S atom. The appearance and increase in intensity of the 255 cm−1 band can be considered a consequence of resonant excitation of one charge transfer state.3,13 However, as a well-known fact (also in the present case), the electromagnetic enhancement mechanism dominates total SERS enhancement.13 The band at 987 cm−1 (originally at 983 cm−1 in the case of only 2TBA) is attributed to the bonding of D-glucose to 2TBA through B–O.3 For quantifying the SERS-based signals presented in Fig. 4, the intensity variation of 987 cm−1 (attributed to the 2TBA-D-glucose bond) and 1098 cm−1 (blue-shifted from 1090 cm−1 owing to the bonding between 2TBA and D-glucose) bands with concentration is shown in Fig. 5. In the case of the 987 cm−1 band, a linear increase in the intensity is observed with increasing D-glucose concentration (Fig. 5(a)), while an opposite linear trend is observed in the 1098 cm−1 band's case (Fig. 5(b)). The observed linear intensity variations with an increase in the D-glucose concentration are owing to more atoms attaching to the substrate at the B(OH)2 site of the boronic acid molecule, which decreases the number of molecules with BO stretching mode.
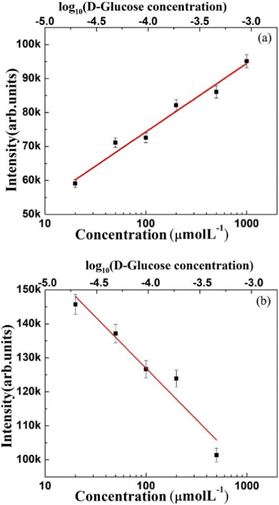 | ||
| Fig. 5 The linear intensity variation of Raman bands as a function of the D-glucose concentration: (a) 987 cm−1 band and (b) 1098 cm−1 band. | ||
We have discovered a novel and the easiest method to form Ag nanoclusters on a typical glass substrate. Ag nanoclusters could be formed by controlling the reduction parameters of Tollens’ reagent on a typical glass surface. When functionalized with 2-TBA, the Ag nanoclusters exhibited an excellent SERS activity useful in quantitatively detecting D-glucose at as low as 20 μmol L−1 concentration. These substrates should also be useful in sensing other analytes. However, the detection sensitivity can be further improved by improving the Ag nanoclusters' size- and shape-uniformity. The higher the uniformity in the size and shape and the distance between the Ag nanoclusters, the better the optical absorption in the visible region and the SERS enhancement factor.1,2,13,14 It is also vital that the SERS substrates can sense different analytes in different scenarios.15 Work in this direction is needed, and this is possible by considering different functionalization steps on the prepared SERS substrates. In this work, the reuse of substrates is not a significant issue because the procedure to prepare substrates is extremely easy, unlike in other SERS preparation methods.1,2
Author contributions
V. Ingilala: investigation, formal analysis, writing – original draft, data curation, and visualization; C. Bansal: conceptualization, writing – review and editing, and supervision; V. V. S. S. Srikanth: conceptualization, funding acquisition, writing – review and editing, and supervision; and R. Ammanabrolu: conceptualization, funding acquisition, data curation, writing – review and editing, and supervision.Conflicts of interest
There are no conflicts to declare.Acknowledgements
The authors acknowledge the DST-SERB for funding this work (Grant Number: EMR/2016/006509). IVR acknowledges DST-SERB and UGC-NFSC, India for providing fellowship to pursue PhD.Notes and references
- (a) C.-C. Li, Y.-M. Huang, X.-Y. Li, Y. R. Zhan, Q.-L. Chen, Z.-W. Ye, Z. Alqarni and S. E. J. Bell, J. Mater. Chem. C, 2021, 9, 11517–11552 RSC; (b) X. X. Han, R. S. Rodriguez, C. L. Haynes, Y. Ozaki and B. Zhao, Nat. Rev. Methods Primers, 2021, 1, 87 CrossRef CAS.
- L. Škantárová, A. Oriňák, R. Oriňáková and F. Lofaj, Nano-Micro Lett., 2012, 4, 184–188 CrossRef.
- R. Botta, A. Rajanikanth and C. Bansal, Sens. Bio-Sens. Res., 2016, 6, 13–16 CrossRef.
- G. I. Svehla and A. I. Vogel,Vogel's Qualitative Inorganic Analysis, Dorling Kindersley, New Delhi, 7th edn, (7th impression), 2009, pp. 85–86 Search PubMed.
- E. C. Le Ru, C. Galloway and P. G. Etchegoin, Phys. Chem. Chem. Phys., 2006, 8, 3083–3087 RSC.
- O. Lyandres, J. M. Yuen, N. C. Shah, R. P. Van Duyne, J. T. Walsh Jr. and M. R. Glucksberg, Diabetes Technol. Ther., 2008, 10, 257–265 CrossRef CAS PubMed.
- W. Gan, B. Xu and H. Dai, Angew. Chem., Int. Ed., 2011, 50, 6622–6625 CrossRef CAS PubMed.
- M. V. Cañamares, C. Chenal, R. L. Birke and J. R. Lombardi, J. Phys. Chem. C, 2008, 112, 20295–20300 CrossRef.
- R. Botta, G. Upender, R. Satyawathi, D. Narayana Rao and C. Bansal, Mater. Chem. Phys., 2013, 137, 699–703 CrossRef CAS.
- G. Upender, R. Satyavathi, B. Raju, K. Shadak Alee, D. Narayana Rao and C. Bansal, Chem. Phys. Lett., 2011, 511, 309–314 CrossRef CAS.
- P. Hildebrandt and M. Stockburger, J. Phys. Chem., 1984, 88, 5935–5944 CrossRef CAS.
- A. K. Sachan, S. K. Pathak, L. Sinha, O. Prasad, M. Karabacak and A. M. Asiri, J. Mol. Struct., 2014, 1076, 639–650 CrossRef CAS.
- X.-C. Sun, Anal. Chim. Acta, 2022, 1206, 339226 CrossRef CAS PubMed.
- M. K. Kuntumalla, V. V. S. S. Srikanth, S. Ravulapalli, U. Gangadharini, H. Ojha, N. R. Desai and C. Bansal, Phys. Chem. Chem. Phys., 2015, 17, 21331 RSC.
- (a) Y. Zhao, L. Sun, M. Xi, Q. Feng, C. Jiang and H. Fong, ACS Appl. Mater. Interfaces, 2014, 6, 5759–5767 CrossRef CAS PubMed; (b) Y. Yang, Z. Zhang, Y. He, Z. Wang, Y. Zhao and L. Sun, Sens. Actuators, B, 2018, 273, 600–609 CrossRef CAS; (c) M. Wan, H. Zhao, Z. Wang, X. Zou, Y. Zhao and L. Sun, Colloids Interface Sci. Commun., 2021, 42, 100428 CrossRef CAS.
Footnotes |
| † Electronic supplementary information (ESI) available: See DOI: https://doi.org/10.1039/d3ma00959a |
| ‡ All Raman spectra are base-line corrected and no other modification was done. |
| This journal is © The Royal Society of Chemistry 2024 |

