 Open Access Article
N-doped branched metal–organic framework derivatives to boost multiband microwave absorption with ultrathin thickness†
Zhe
Zhang
 a,
Jiewu
Cui
 *a,
Dongbo
Yu
 *a,
Jiaqin
Liu
 b,
Pengjie
Zhang
 c,
Yong
Zhang
 a,
Song
Ma
 d,
Linjie
Wang
 e,
Guangsheng
Deng
 e and
Yucheng
Wu
 *a
*a
aSchool of Materials Science and Engineering, Key Laboratory of Advanced Functional Materials and Devices of Anhui Province, Hefei University of Technology, Hefei 230009, China. E-mail: jwcui@hfut.edu.cn; dongboy@hfut.edu.cn; ycwu@hfut.edu.cn
bInstitute of Industry & Equipment Technology, Engineering Research Center of Advanced Composite Materials Design & Application of Anhui Province, Hefei University of Technology, Hefei 230009, China
cBGRIMM Technology Group Co, Ltd, Beijing 102600, China
dShenyang National Laboratory for Materials Science, Institute of Metal Research, Chinese Academy of Sciences, Shenyang 110016, China
eAcademy of Opto-electric Technology, Hefei University of Technology, Hefei 230009, China
First published on 3rd February 2024
Abstract
Although multiband compatible electromagnetic wave absorption (EMWA) materials are in demand, easy fabrication of lightweight and thin EMWA materials is challenging. Herein, rod-like CoNi-MOF-74 precursors were prepared, and then a melamine-assisted chemical vapor deposition pyrolysis technique was employed to fabricate magnetic CoNi nanoalloys@N-doped porous carbon/N-doped carbon nanotubes (CoNi@NPC/NCNTs) composites. Benefiting from the nitrogen and carbon sources supplied by melamine during the pyrolysis, N-doped carbon matrices with rich assembly of branching structures were obtained, and the magnetic nanoalloys homogeneously dispersed in the carbon matrix. Because of these features, CoNi@NPC/NCNTs exhibited superior dual-band EMWA properties with increased polarization relaxation losses, an excellent dielectric/magnetic synergistic effect, and good impedance matching. In the 2–18 GHz band, the minimum reflection loss (RLmin) value of CoNi@NPC/NCNTs is −54.8 dB at 1.6 mm thickness, and the maximum effective absorption bandwidth (EABmax) is 4.7 GHz at 1.5 mm thickness. In the 26.5–40 GHz band, the RLmin value of the sample is −49.5 dB and EABmax is 9.7 GHz at a thickness of only 0.7 mm. The superb microwave attenuation capability with dual frequency bands is verified by radar cross-section simulations. This work provides valuable guidance for fabricating ultrathin, and lightweight multiband absorbing materials.
Introduction
With the rapid evolution of information technology and electronic devices, exploration of multifrequency band-compatible electromagnetic wave absorbers, especially for the 2–18 and 26.5–40 GHz bands that are widely applied in the fields of 5G communications, multifrequency satellite radar, and the Internet of Things, has become necessary.1–5 Such a strategy and materials are required to deal with the increasingly serious and complex electromagnetic pollution problem.6 Currently, multiband absorption is normally achieved using multilayer stacks or metamaterials. However, the overall large thickness of the materials and machining difficulties hinder the practical applicability of such absorbers.7–9 Therefore, the synthesis of broadband or even multiband compatible absorbers still faces bottlenecks and huge challenges under the premise of ensuring light weight, thinness, and easy fabrication.Impedance matching is essential for achieving broadband electromagnetic wave absorption (EMWA).10,11 It requires both composition and microstructure design of materials to ensure the achievement of good impedance matching.12,13 As a crystalline porous material consisting of organic ligands and metal ions/clusters linked through strong coordination bonds, metal–organic frameworks (MOFs) have the advantages of tailorable compositions, designable microstructures, and large specific surface areas.3,14 To enable coexistence of the dielectric and magnetic components of the system, the magnetic metal must be elaborated as the metal node of the MOF. After pyrolysis, the porous framework composed of organic ligands will be converted into porous carbon materials, while magnetic metal ions/clusters will be reduced to magnetic metals by a thermal reduction process.15,16 However, generally the carbon materials obtained after pyrolysis of the MOF mainly exhibit dielectric losses dominated by a singular conductive loss, with a relatively single attenuation pathway. Composites with other dielectric materials (e.g., graphene17,18 and carbon nanotubes (CNTs)19) and heteroatom doping can enrich the polarization relaxation in dielectric loss,20,21 which is an effective way to address the above issues. Among the magnetic metal ions assembled into MOFs, there will be autocatalytic growth of CNTs during pyrolysis to form a branched structure.22 Due to its high specific surface area and high anisotropy ratio, the branched structure has been widely used in EMWA with unique advantages in optimizing impedance matching and enhancing the polarization relaxation loss.23,24 Unfortunately, the autocatalytic generation of CNTs via a pure MOF suffers from the disadvantages of short length, little quantity, and inhomogeneous distribution, which hinder the formation of ideal branched structures.24,25
Heteroatom doping (e.g., N, S, and B) can endow carbon materials with unique electronic properties and abundant functional groups,26 increasing the degree of defects in carbon materials and thus enriching dielectric loss modes. N-atom doping has received much attention due to its convenient realization and excellent properties.27 Chemical vapor deposition (CVD) is simpler than incorporating N during the synthesis of MOFs.28,29 Carbon–nitrogen compounds are commonly used as external nitrogen sources. Carbon–nitrogen compounds also supply an additional carbon source to the system, which contributes to maintaining the stability of the microstructure during pyrolysis. Melamine, as an ideal carbon and nitrogen source, produces reducing gases in the presence of highly catalyzed metal particles during pyrolysis.29,30 These reducing gases not only assist in achieving N doping, but also act as initiators and carbon supplements to aid in the uniform growth of CNTs.31 Xu et al.32 prepared Fe-containing polyacrylonitrile fibers (PAN fibers) and fabricated Fe3C@NCF/Fe@NCNT composites by subsequent melamine-assisted CVD. Owing to its unique layered structure and polarization loss, the composite has effective absorption bandwidth (EAB) of up to 4.0 GHz and the minimum reflection loss (RLmin) of −49.56 dB when the matching thickness is 1.5 mm. However, due to the aggregation of magnetic metals in the fiber, the dielectric/magnetic synergy is weakened, limiting the expansion of the EAB. Furthermore, the reported response of carbon-based absorbers to electromagnetic waves (EMWs) has mainly focused on 2–18 GHz,33,34 while relatively few studies have been conducted on EMWA materials in the 26.5–40 GHz band. This restricts the potential of wave-absorbing materials for a wide range of applications in practical environments.
In this study, magnetic Co/Ni nanoparticles (NPs)@N-doped carbon/N-doped CNT composites were successfully fabricated by melamine-assisted CVD during pyrolysis using specific Co/Ni-MOF-74 nanorods as precursors. Due to the combined advantages of N doping, branched structure, and magnetic/dielectric synergy, the optimized CoNi@NPC/NCNTs exhibited excellent EMWA properties in dual frequency bands and outperformed other carbon-based materials prepared from the Co/Ni-MOF-74 precursors. In the 2–18 GHz band, the RLmin was −54.8 dB at a thickness of 1.6 mm, and the maximum effective absorption bandwidth (EABmax) was 4.7 GHz; in the 26.5–40 GHz band, the RLmin was −49.5 dB, and the EABmax was 9.7 GHz, when the thickness was only 0.7 mm. The RCS simulation results also verified the practicality of this composite in actual scenarios under dual-band EMWs.
Results and discussion
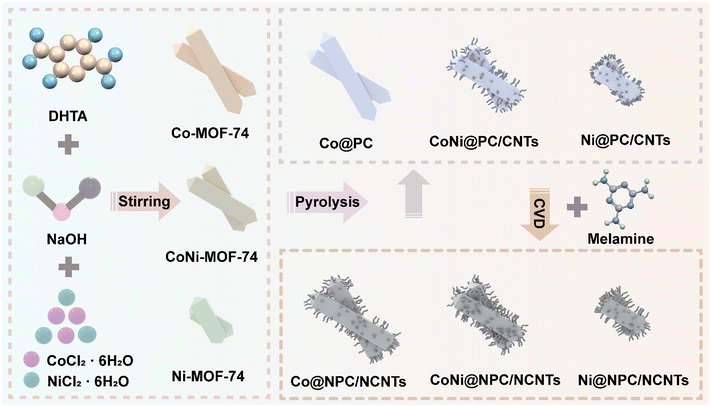
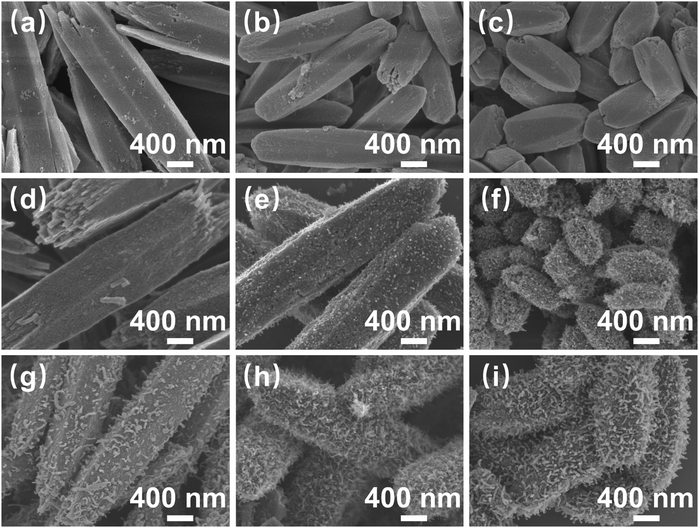
The sample preparation process is illustrated in Fig. 1. First, metal ions (Co2+, Ni2+) were self-assembled with organic ligands (DHTA) to synthesize Co/Ni-MOF-74 nanorods. Next, Co/Ni-MOF-74 nanorods as precursors were directly pyrolyzed and pyrolyzed employing melamine-assisted CVD at 700 °C under an argon atmosphere, respectively. The scanning electron microscopy (SEM) images shown in Fig. 2(a–c), reveal that the length and diameter of the synthesized three Co/Ni-MOF-74 nanorods change with the increasing Ni2+ content. The Co-MOF-74 nanorods (length: 3 μm, diameter: 0.8 μm), CoNi-MOF-74 nanorods (length: ∼ 2.5 μm, diameter: ∼ 0.6 μm), and Ni-MOF-74 nanorods (length: ∼ 1.4 μm, diameter: ∼ 0.5 μm) exhibit different morphologies and length-to-diameter ratios.As shown in Fig. 2(d–i), all the derivatives obtained from CoNi-MOF-74 perfectly inherited the morphology of the precursor, owing to the high stability of the MOF skeleton. In the derivatives obtained from direct pyrolysis (Fig. 1(d–f)), the CNTs grew on the surfaces of the CoNi@PC/CNTs and Ni@PC/CNTs nanorods, and the amount of CNTs increased with the increasing Ni2+ content. By contrast, no growth of CNTs was observed on the Co@PC surface. This result can be attributed to the energy released during the MOF pyrolysis to reduce the Co2+/Ni2+ ions/clusters into highly active nanocatalysts, which capture carbon atoms and catalyze the growth of CNTs on the surface of the carbon substrate. Compared with Co nanocatalysts, the Ni nanocatalysts strongly adsorb and dissociate the carbon atoms at high temperatures, thus facilitating the growth of CNTs. As shown in Fig. 2(g–i), the melamine-assisted pyrolysis generated reducing gases and supplied carbon sources, and in conjunction with the Co/Ni nanocatalysts, a large number of branched CNTs uniformly grew on all surfaces of the MOF nanorods. The transmission electron microscopy (TEM) images presented in Fig. S1 (ESI†) further confirm that the NPs were diffusely distributed inside all the pyrolyzed samples. Based on the tip-growth mechanism,35 in the samples equipped with CNTs, the NPs are raised and thus encapsulated inside the tips of the CNTs during the outward growth of the CNTs on the surface of the carbon matrix.
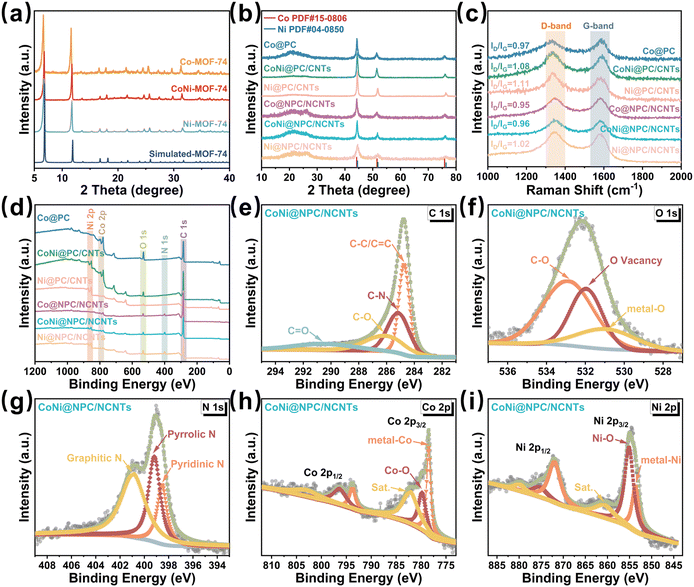
The crystal structure and phase composition of all the samples were validated via X-ray diffraction (XRD) measurements. The XRD patterns shown in Fig. 3a confirm that all the three prepared Co/Ni-MOF-74 precursors exhibit high crystallinity; in addition, these measured patterns perfectly match the corresponding simulated standard spectra. In the XRD spectra of the six derivatives obtained using the two pyrolysis procedures (Fig. 3b), the diffraction peak at 23.4° belongs to amorphous carbon, whereas in the spectra of the samples containing CNTs, all the diffraction peaks at 26.2° belong to the corresponding (002) crystal-faced graphitic carbon (JCPDS 41-1487).36
Notably, the intensity of the diffraction peak located at 26.2° in the spectra of Co@NPC/NCNTs, CoNi@NPC/NCNTs, and Ni@NPC/NCNTs changed after the melamine-assisted pyrolysis, indicating an increase in the proportion of graphitic carbon in the matrices. For the Co@PC and Co@NPC/NCNT samples, the diffraction peaks located at 44.2°, 51.5°, and 75.9° correspond to the (111), (200), and (220) crystal planes of Co (JCPDS No. 15-0806).37 The diffraction peaks of Ni@PC/CNTs and Ni@NPC/NCNTs located at 44.5°, 51.7°,and 76.4° are assigned to (111), (200), and (220) of Ni (JCPDS No. 04-0850).38 Furthermore, the two distinct diffraction peaks observed at 44.4°, 51.6°,and 76.2° in the spectra of CoNi@PC/CNTs and CoNi@NPC/NCNTs located in-between those of Co and Ni confirm the successful synthesis of the single-phase CoNi alloys.24,36
The ID/IG values determined from the Raman spectra can be employed to further verify the degree of graphitization and the amount of defects in the carbon matrix. The ID/IG values of CoNi@NPC/NCNTs and Ni@NPC/NCNTs increase with the increasing content of Ni because the Ni-catalyzed CNTs consume a portion of carbon in the matrix during the pyrolysis, and consequently, the defect density increases. The absence of partial carbon sources supplied by melamine for the formation of CNTs results in a slight increase in the ID/IG values of the CoNi@PC/CNTs and Ni@PC/CNTs samples synthesized via direct pyrolysis.28 The TEM images shown in Fig. S1 (ESI†) further confirm that the Ni-catalyzed CNTs consume more carbon from the matrix during pyrolysis, resulting in the formation of a wrinkled and uneven matrix surface. Moreover, the reducing gases released from melamine decomposition further increase the proportion of graphitized carbon in the matrix, and this result is consistent with the XRD results.
The elemental composition present in the surface of all the pyrolyzed samples was evaluated by X-ray photoelectron spectroscopy (XPS). Elemental N was detected in the XPS spectra of Co@NPC/NCNTs, CoNi@NPC/NCNTs, and Ni@NPC/NCNTs (Fig. 3d), whereas no N signals were present in the profiles of the directly pyrolyzed samples. This result suggests the successful doping of N with the aid of melamine-assisted pyrolysis. The simultaneous presence of Co and Ni in CoNi@PC/CNTs and CoNi@NPC/NCNTs (Fig. 3d) demonstrates the satisfactory incorporation of the bimetallic CoNi component. For instance, in the case of CoNi@NPC/NCNTs, the peaks at 284.7, 285.1, 286.2, and 290.4 eV in the C1s spectra can be attributed to C–C/C![[double bond, length as m-dash]](https://www.rsc.org/images/entities/char_e001.gif) C, C–N, C–O, and C
C, C–N, C–O, and C![[double bond, length as m-dash]](https://www.rsc.org/images/entities/char_e001.gif) O, respectively.39 In the O 1s spectra (Fig. 3f), the peaks at 530.9, 531.9, and 532.8 eV are derived from metal–O via slight surface oxidation in air, O-vacancy, and C–O.40 The high-resolution N 1s spectrum (Fig. 3g) can be decomposed into three peaks attributed to pyridine-N (398.5 eV), pyrrole-N (399.2 eV) and graphite-N (401.1 eV).41,42 Multiple types of N doping increase the charge density around the carbon atoms and offer a variety of defects and activation centers. The spectrum of Co 2p (Fig. 3h) shows several typical peaks. The peaks at 778.5 and 793.8 eV belong to metallic Co; the peaks at 779.8 and 796.3 eV correspond to Co2+ formed by air oxidation and that at 782.1 and 803.2 eV are satellite peaks.39 The Ni 2p spectrum (Fig. 3i) shows two peaks at 854.9 and 872.8 eV, which correspond to Ni 2p3/2 and Ni 2p1/2, respectively. The Ni 2p3/2 peak can be further decomposed into 853.7, 855.1, and 860.7 eV attributed to metal–Ni, Ni–O, and satellite peak, respectively.43
O, respectively.39 In the O 1s spectra (Fig. 3f), the peaks at 530.9, 531.9, and 532.8 eV are derived from metal–O via slight surface oxidation in air, O-vacancy, and C–O.40 The high-resolution N 1s spectrum (Fig. 3g) can be decomposed into three peaks attributed to pyridine-N (398.5 eV), pyrrole-N (399.2 eV) and graphite-N (401.1 eV).41,42 Multiple types of N doping increase the charge density around the carbon atoms and offer a variety of defects and activation centers. The spectrum of Co 2p (Fig. 3h) shows several typical peaks. The peaks at 778.5 and 793.8 eV belong to metallic Co; the peaks at 779.8 and 796.3 eV correspond to Co2+ formed by air oxidation and that at 782.1 and 803.2 eV are satellite peaks.39 The Ni 2p spectrum (Fig. 3i) shows two peaks at 854.9 and 872.8 eV, which correspond to Ni 2p3/2 and Ni 2p1/2, respectively. The Ni 2p3/2 peak can be further decomposed into 853.7, 855.1, and 860.7 eV attributed to metal–Ni, Ni–O, and satellite peak, respectively.43
Next, the microstructures of the CoNi@NPC/NCNTs composites were characterized by TEM and High-resolution TEM (HRTEM). As shown in Fig. 4(a and b), the CoNi@NPC/NCNTs matrix exhibits an overall rod-like morphology. In addition, the surface is surrounded by branched CNTs, and NPs are uniformly dispersed in the matrix as well as at the tips of the CNTs. The average diameter of the CNTs in the range of 15–20 nm, and the diameter distribution in the inset of Fig. 4b shows that the diameter of the NPs is about 9.4–15 nm. The brightness and lining contrasts in the high-angle annular dark-field (HAADF) image shown in Fig. S2a (ESI†) and differential phase-contrast scanning transmission electron microscopy (DF-S) image presented in Fig. S2b (ESI†) (obtained in different imaging modes of TEM) further validate the above statement. Lattice fringes of 0.203 and 0.177 nm can be measured in the HRTEM images shown in Fig. 4(c and d), corresponding to the (111) and (022) planes of CoNi. This result further confirms the formation of a single-phase CoNi alloy.24,44 Multilayered graphitic carbon layers with a lattice spacing of 0.34 nm are wrapped around the edges of the CoNi nanoalloys.16 Heterogeneous interfaces consisting of discontinuous graphitized carbon regions and amorphous carbon regions with CoNi nanoalloys are also observed in the HRTEM image in Fig. 4d. Moreover, holes and a large number of point defects are visible in the matrix, and they create adequate conditions for interfacial polarization and charge aggregation to generate dipole polarization. The energy dispersive X-ray spectroscopy (EDX) mapping images shown in Fig. 4(e–j) and EDX mapping spectra presented in Fig. S2c (ESI†) evidence the presence of C, O, N, Co, and Ni. In addition, NPs consisting of Co and Ni are evenly dispersed throughout the branched CNT-modified nanorods. A comparison between the elemental mapping images of C and N in Fig. 4(f and h) further confirms the effective doping of N in the carbon matrix and CNTs, with an N-atom atomic fraction of 2.51% (Fig. S2c, ESI†). These results are consistent with those obtained by XRD and XPS analyses, suggesting that pyrolysis of CoNi-MOF-74 via melamine-assisted CVD can effectively achieve N-doped CoNi@NPC/NCNTs composites.
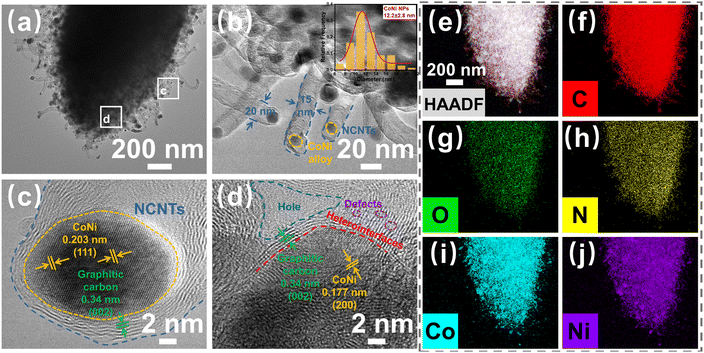 | ||
| Fig. 4 (a) and (b) TEM images (inset shows the diameter distribution of CoNi NPs), (c) and (d) HRTEM images, and (e) and (j) EDX elemental mapping images of CoNi@NPC/NCNTs. | ||
Generally, the values of reflection loss (RL) and EAB can be effectively used to evaluate the EMWA performance of absorbers. The RL value can be calculated using formula (S1) and (S2) (ESI†). If the RL value is less than −10 dB, then 90% of the incident electromagnetic energy is effectively attenuated, and the EAB of the absorbers can be evaluated.10,45
Fig. S3 (ESI†) displays the RL values and EAB of Co@PC, CoNi@PC/CNTs, and Ni@PC/CNTs in the ranges of 2–18 and 26.5–40 GHz, respectively. In Fig. S3(a–c) (ESI†), due to the absence of CNTs, the matching thicknesses of Co@PC corresponding to RLmin and EABmax are large, i.e., 5.7, and 9.7 mm, respectively. With the introduction of CNTs and the CoNi nanoalloys, the RLmin value (−55.4 dB) and EABmax (5.4 GHz) of CoNi@PC/CNTs improved, and the corresponding thicknesses slightly reduced to 3.2 and 1.9 mm, respectively. Comparison with the EAB properties of Ni@PC/CNTs reveals that the coexistence of CoNi nanoalloys and CNTs in a system can enhance the attenuation properties. As shown in Fig. S3(d–f) (ESI†), the attenuation properties of Co@PC, CoNi@PC/CNTs, and Ni@PC/CNTs in the 26.5–40 GHz band are similar to those measured in the 2–18 GHz band. Remarkably, although the best attenuation properties of the material in the 26.5–40 GHz band correspond to a relatively small thickness, the RLmin value is only −15.1 dB, which is far from the requirements of a high-performance absorber and is mainly due to its weak polarization loss and poor impedance matching.
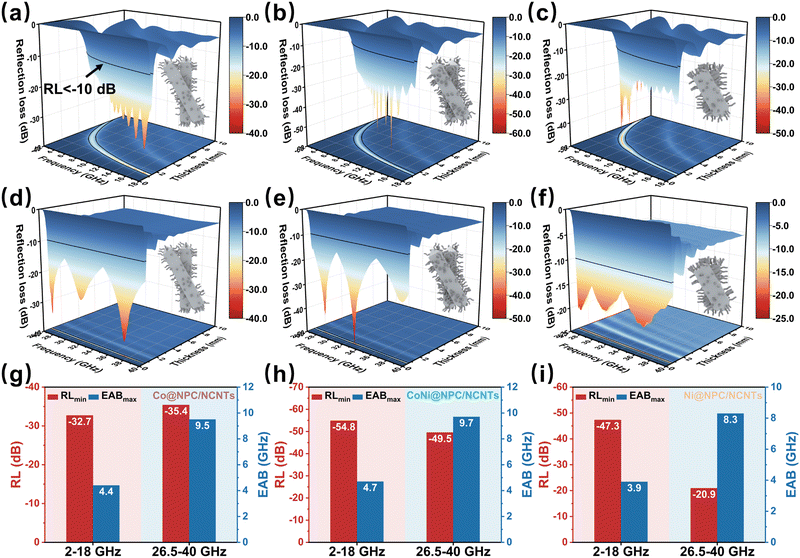
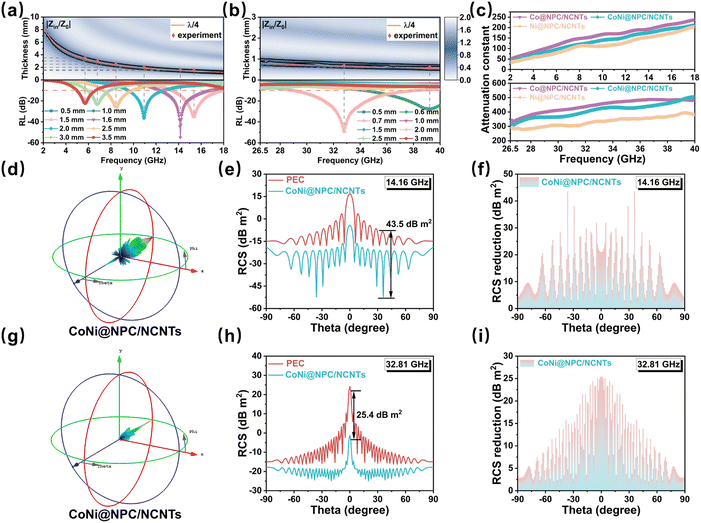
The changes in the RL values and EAB of Co@NPC/NCNTs, CoNi@NPC/NCNTs and Ni@NPC/NCTs after N doping are shown in Fig. 5. In the 2–18 GHz band (Fig. 5(a–c)), the RLmin values of the three samples are −32.7 (1.3 mm), −54.8 (1.6 mm), and −47.3 dB (3.6 mm). Compared with the absorber obtained by direct pyrolysis, the matching thickness is obviously thinner, indicating that N doping and rich branched structure are conducive to enhancing attenuation. Compared to CoNi@PC/CNTs, the thickness corresponding to the RLmin value and EABmax of CoNi@NPC/NCNTs is further reduced. However, the EABmax is slightly reduced (13.3–18 GHz) possibly because of an increase in the starting impedance matching frequency from 12.6 to 13.3 GHz in the 2–18 GHz band.
In the 26.5–40 GHz band, the RLmin values of Co@NPC/NCNTs, CoNi@NPC/NCNTs, and Ni@NPC/NCNTs and the corresponding thicknesses (as shown in Fig. 5(d–i)) are −36.4 (0.6 mm), −49.5 (0.7 mm), and −20.9 dB (0.9 mm), respectively. Thus, CoNi@NPC/NCNTs exhibit the best attenuation performance at ultrathin thicknesses. Notably, CoNi@NPC/NCNTs feature an ultrawide EAB of 9.7 GHz (28.8–38.5 GHz, 0.7 mm) in the 26.5–40 GHz frequency range, with a high frequency range coverage of 71.9%. Overall, CoNi@NPC/NCNTs display excellent combined attenuation properties in the dual bands of 2–18 and 26.5–40 GHz. Moreover, different wave-absorbing material strategies derived from the same precursor can be implemented in multiscenario applications. Comparing the EMWA performance with those of other related absorber samples (as shown in Fig. S4, ESI†), the CoNi@NPC/NCNTs composite exhibits an overwhelming advantage in terms of the combined loss performance, which confirms its potential application in thin dual-band wave absorption.
The EMWA properties of the absorbers are intimately related to their electromagnetic parameters (εr = ε′ − jε′′ and μr = μ′ − jμ′′). To further define the dielectric properties of samples, the complex permittivity (εr = ε′ − jε′′) of all the samples are tested in dual frequency bands (2–18 and 26.5–40 GHz), where the real part (ε′) stands for the storage of the electrical energy, and the imaginary part (ε′′) determines the loss of the electrical energy. The ε′ and ε′′ values at 2–18 and 26.5–40 GHz for Co@PC, CoNi@PC/CNTs, and Ni@PC/CNTs obtained by direct pyrolysis are exhibited in Fig. S5(a and b) (ESI†). The ε′ values of samples display a decreasing trend with increasing frequency, which is primarily attributed to the dispersion effect that the dipole lags behind the change in electric field as frequency increases.46,47
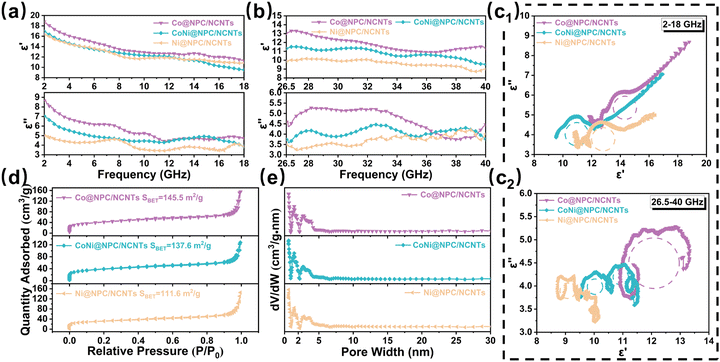
The ε′ and ε′′ values of Co@NPC/NCNTs, CoNi@NPC/NCNTs, and Ni@NPC/NCNTs are depicted in Fig. 6(a and b). The corresponding ε′ values decrease from 18.8 to 11.3, 16.95 to 9.52, and 16.42 to 10.80 (2–18 GHz), and from 13.34 to 10.89, 11.53 to 9.54, and 10.18 to 8.72 (26.5–40 GHz). The ε′′ values of the samples exhibit significant resonance peaks in dual-frequency bands, indicating significant polarization relaxation in the attenuation process.48 Furthermore, Co@NPC/NCNTs, CoNi@NPC/NCNTs, and Ni@NPC/NCNTs have higher εr compared to samples obtained via direct pyrolysis, especially Co@NPC/NCNTs, which is primarily due to the rich branched CNTs, the relatively long-diameter rod-like structure, and N-doping.49 This allows continuous conducting networks to be constructed more efficiently, facilitating the migration and hopping of electrons.
To thoroughly analyze the dielectric loss mechanism, it is well-known that in the GHz range, the dielectric loss is mainly conduction loss and polarization relaxation loss (interfacial polarization and dipole polarization).48 Based on Debye theory, the polarization relaxation loss can be described using the Cole–Cole curve. According to eqn (S3) (ESI†), if the Cole–Cole curve is a typical semicircle, it indicates that the polarization relaxation process exists inside the material.36 In Fig. 6c1, the Cole–Cole circles of Co@NPC/NCNTs, CoNi@NPC/NCNTs, and Ni@NPC/NCNTs in the 2–18 GHz band consist of long straight lines and several semicircles, suggesting that the dielectric loss is jointly contributed by the conductive loss and polarization loss. The Cole–Cole circles corresponding to the samples in the 26.5–40 GHz band (Fig. 6c2) display multiple irregular semicircles, indicating that the dielectric loss at high frequencies can be primarily attributed to the polarization loss. By contrast, the irregular semicircles of the curves suggest that other internal loss mechanisms operate as well, such as Maxwell–Wagner relaxation.46 The Cole–Cole circles for the samples obtained by direct pyrolysis are shown in Fig. S5(c and d) (ESI†), wherein the smooth straight lines account for a larger proportion of the curve compared to those in Fig. 6(c1 and c2), with a larger contribution of conductive loss in dielectric loss with dual-frequency bands. In Co@NPC/NCNTs, CoNi@NPC/NCNTs, and Ni@NPC/NCNTs, abundant dendritic N-doped CNTs were introduced, and the coexistence of diffusely distributed magnetic NPs and amorphous carbon/graphitic carbon in the system considerably enlarges the area of heterogeneous interfaces. Concurrently, the doping of N atoms in the porous carbon matrix and in CNTs, as well as the large number of defects and oxygen vacancies generated during pyrolysis, contributes to the formation of inhomogeneous charge distributions and abundant active sites around C atoms, which lead to the formation of permanent dipoles and the emergence of dipole polarization. N2 adsorption–desorption isotherms of Co@NPC/NCNTs, CoNi@NPC/NCNTs, Ni@NPC/NCNTs are shown in Fig. 6d. Clearly, at higher relative pressures (P/P0) of 0.8 to 1.0, the samples all exhibit type IV isotherms due to the presence of micro- and mesopores. The pore diameters in the samples are mainly micropores distributed around 1.4 nm and mesopores around 3.0 nm (Fig. 6e). The specific surface areas of samples were calculated by the BET method and were 145.5, 137.6, and 111.6 m2 g−1 for Co@NPC/NCNTs, CoNi@NPC/NCNTs and Ni@NPC/NCNTs, respectively. The specific surface area of the samples decreases with the increasing Ni content, primarily because of the high catalytic activity of Ni, which consumes more carbon matrix while catalyzing the CNTs, leading to the collapse of the partial pore structure. Overall, the ideal specific surface area and enriched pore structure of samples not only further improve impedance matching and increase multiple reflection of incident waves, but also provide more active sites, leading to more interfacial polarization and dipole polarization, enhancing dielectric loss.15
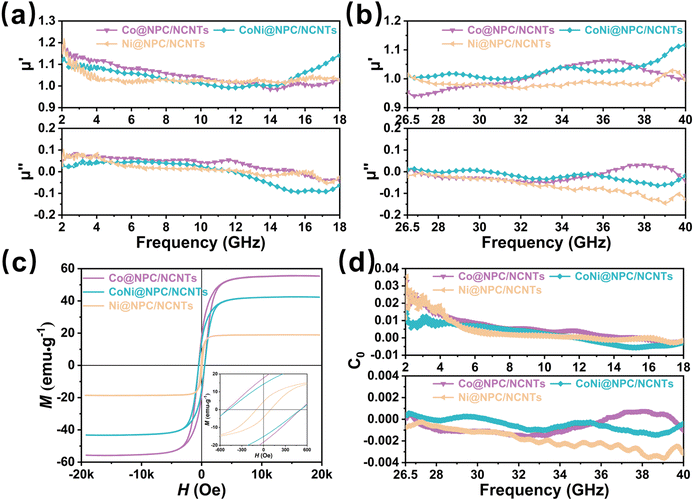
Besides dielectric loss, the magnetic loss evaluated by complex permeability (μr = μ′ − jμ′′) is also a crucial parameter for attenuation properties of materials.22 The μr (μr = μ′ − jμ′′) values of Co@NPC/NCNTs, CoNi@NPC/NCNTs, and Ni@NPC/NCNTs in the 2–18 and 26.5–40 GHz bands are illustrated in Fig. 7(a and b), where the real part (μ′) stands for the ability to store magnetic energy, and the imaginary part (μ′′) represents the ability to dissipate magnetic energy. Evidently, as the frequency increases, the μ′ value of the samples decreases and then increases, and resonance peaks appear. This indicates that magnetic nanometals, especially magnetic CoNi nanoalloys, can effectively enhance the overall magnetic properties at high frequencies, and multiple resonance loss occur during the decaying process.50 The μ′′ values of samples reduce with frequency and fluctuate only within a certain range, indicating that the samples exhibit stable magnetic loss with dual-frequency bands. As the frequency is increased further, inherent magnetic losses are unable to counteract the magnetic energy radiated at higher frequency, causing the μ′′ values of samples to be negative, which is inextricably linked to the higher dielectric constant. Comparison of the aforementioned samples with the μr values of Co@PC, CoNi@PC/CNTs, and Ni@PC/CNTs obtained by direct pyrolysis (Fig. S6(a and b), ESI†) has confirmed that the μr of samples gained by melamine-assisted pyrolysis did not cause a significant decrease due to an increase in the dielectric constant, and the same high magnetic loss is maintained.
The hysteresis loops of Co@NPC/NCNTs, CoNi@NPC/NCNTs and Ni@NPC/NCNTs measured at room temperature are shown in Fig. 7c. All the samples display typical ferromagnetism with saturation magnetization (Ms) values of 55.8, 43.3, and 18.9 emu g−1, respectively. Due to the large spin-magnetic moment ratio of Co,51 Co@NPC/NCNTs exhibit a large Ms. Notably, Ms of CoNi@NPC/NCNTs is slightly lower than that of Co@NPC/NCNTs, which might be attributed to the complexity of the magnetic domain structure and the formation and movement of magnetic domain walls in CoNi nanoalloys compared to pure Co NPs with relatively single magnetic domains.44,52 The CoNi@NPC/NCNTs composite has a smaller coercivity (Hc), which is 469.7 Oe. According to eqn (S4) and (S5) (ESI†), intrinsic magnetic permeability (μr, μ′′) is closely related to magnetic properties.53 High Ms and low Hc are conducive to improving the permeability and magnetic loss capability.54
In general, the main sources of magnetic loss in the GHz frequency range are natural resonance, eddy current loss, and exchange resonance.55 From eqn (S6) (ESI†), it can be inferred that eddy current loss occurs if C0 remains stable with the increasing frequency. As shown in Fig. 7d and Fig. S7 (ESI†), the C0 values of all the samples exhibit significant variations in the 2–18 GHz frequency range, suggesting that the natural and exchange resonances induced by the ferromagnetic NPs play a dominant role. However, the C0 value varies over a small range with minor fluctuations in the 26.5–40 GHz band, indicating that eddy current losses and exchange resonance are the main causes of magnetic loss at high frequencies.18 The rich branched structure and the carbon layer wrapped around the outside of CoNi nanoalloys suppress the eddy current effect at high frequencies to a certain level and improve the magnetic stability performance.
To gain insights into the evolution of the EMWA properties of the samples in the dual frequency bands, the relationship between their impedance matching and quarter-wavelength model and RL values were investigated.56 The impedance matching of materials is normally evaluated using the Z (Z = |Zin/Z0|) value. Theoretically, when the value of Z is close to 1, incident EMW could be maximized into the absorber, thus good impedance matching could be achieved. In the 2D impedance matching plots shown in Fig. S8 and S9 (ESI†), as the εr of the samples increases after the melamine-assisted pyrolysis, the areas corresponding to Z (0.8 < Z < 1.2) values become smaller, indicating that a higher permittivity partially sacrifices the impedance matching. The reduced impedance matching region narrows its EAB. In Co@NPC/NCNTs, CoNi@NPC/NCNTs and Ni@NPC/NCNTs samples, the impedance matching region of CoNi@NPC/NCNTs is more complete across the entire frequency range compared to other two samples, which is conducive to obtaining a wider EAB. The rich branched structures of CoNi@NPC/NCNTs, carbon layer encapsulated magnetic NPs and magnetic/dielectric synergies contribute to suppressing eddy current effects and enhancing overall impedance matching. The quarter-wavelength model is based on interferometric phase cancellation theory, which is complementary to impedance matching and has universal applicability in EMWA.57
When the thickness of the absorber satisfies the quarter-wavelength model (eqn (S7), ESI†), the reflected wave will cancel with the incident wave at the absorber interface with a phase difference of 180° from each other.58 For instance, Fig. 8(a and b) show that the experimentally matched thicknesses (red dots) of the CoNi@NPC/NCNTs samples, corresponding to the RL values of the samples, match well with the simulated thicknesses (orange lines) derived using the quarter-wavelength models. This result indicates that the quarter-wavelength model has a significant effect on RL in the dual-band.2 The simulated thickness lines corresponding to the quarter-wavelength are located exactly in the region where the CoNi@NPC/NCNTs composite achieves optimum impedance matching. Therefore, the excellent dual-band EMWA performance of CoNi@NPC/NCNTs is the outcome of multiple loss mechanisms.
Generally, attenuation constant (α) (eqn (S8), ESI†) is an important indicator of the integrated attenuation capability of a material. The attenuation constants of all the samples are illustrated in Fig. S10 and Fig. 8c (ESI†). Evidently, Co@PC, CoNi@PC/CNTs, and Ni@PC/CNTs exhibit low values of α, which suggests that although low permittivity improves the impedance matching, an undesirable α values are also obtained. With the introduction of N into the carbon matrix and abundant branched CNTs, the overall dielectric loss of materials increases, resulting in a significantly high α for Co@NPC/NCNTs, CoNi@NPC/NCNTs, Ni@NPC/NCNTs compared to Co@PC, CoNi@PC/CNTs, and Ni@PC/CNTs. This result indicates the enhanced EMWA of these materials in the dual-band. The α of CoNi@NPC/NCNTs is slightly lower than that of Co@NPC/NCNTs, due to the high dielectric constant of Co@NPC/NCNTs. Nevertheless, the CoNi@NPC/NCNTs composite benefits from its better impedance matching performance, and as a result, it exhibits the optimal dual-band EMWA characteristics.
To assess the applicability of the sample for EMWA in real environments, the RCS of CoNi@NPC/NCNTs was simulated for real far-field conditions. The two simulation models are depicted in Fig. S11(a and b) (ESI†), which correspond to the solved frequencies of 14.16 and 32.18 GHz. Fig. 8(d and g) illustrate the 3D RCS images obtained at these two frequencies. Comparison with the 3D RCS images of a pure perfect electrical conductor (PEC) at these two frequencies (Fig. S12(a and b), ESI†) shows that the intensity of the scattering signals from CoNi@NPC/NCNTs is significantly reduced. Fig. 8(e and h) display the 2D RCS curves of CoNi@NPC/NCNTs and pure PEC at 14.16 and 32.18 GHz at angles of −90° < θ < 90°. Combined with the results shown in Fig. 8f, at 14.16 GHz, the RCS value of CoNi@NPC/NCNTs is reduced by 43.5 dB m2 as compared to pure PEC. Additionally, at a frequency of 32.18 GHz, the RCS value of CoNi@NPC/NCNTs reduces by up to 25.4 dB m2 (Fig. 8i). The simulation results indicate that CoNi@NPC/NCNTs can effectively suppress radar scattering signals, and further confirm the excellent attenuation properties in a real dual-band environment.
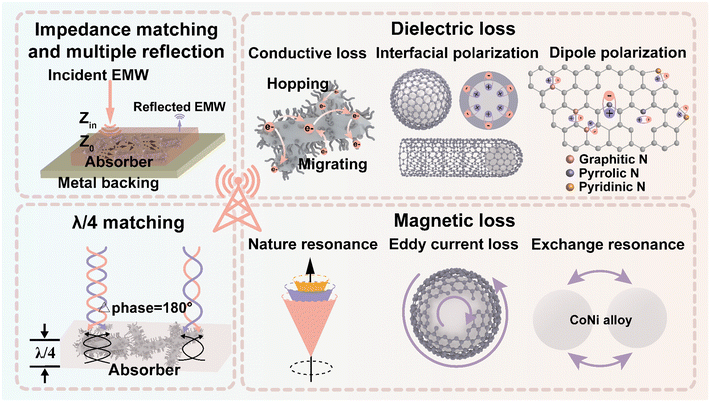
The potential EMWA mechanisms of CoNi@NPC/NCNTs are illustrated in Fig. 9. First, the unique branched structure and synergistic effects of the dielectric–magnetic components endow the material with excellent impedance matching. Consequently, more EMWs enter the absorber without undergoing reflection, resulting in good attenuation conditions. Moreover, combined with the rich porous structure inside porous carbon, the transmission length of the waves increases and multiple reflections occur. In the presence of an external electromagnetic field, the electrons jump and migrate between the overlapping rod-like porous carbon skeletons and branched N-doped CNTs, resulting in an increased conduction loss. A large number of multiple interfaces (CoNi–NPC, CoNi–NCNTs and amorphous–graphitized carbon) exist in CoNi@NPC/NCNTs, and capacitor-like structures are formed between different interfaces, which lead to intense interfacial polarization losses. The pyrolysis results in the doping of heteroatomic N, and simultaneously, numerous defects are created in the matrix. Combined with the large specific surface area of the sample, which can act as a polarization center resulting in charge accumulation, dipole polarization occurs in the presence of an alternating electromagnetic field. Moreover, magnetic CoNi nanoalloys with high Ms and low Hc are uniformly dispersed on the tips of the N-doped carbon skeleton and N-doped CNTs. These nanoalloys can optimize the magnetic coupled network and cause multiple magnetic losses (natural resonance, exchange resonance, and eddy current loss). According to the generalized quarter-wavelength model, the absorption of EMWs drastically increases in discrete multibands. Finally, because of the coexistence synergistic effects of the aforementioned multiple loss mechanisms, CoNi@NPC/NCNTs exhibit excellent superior dual-band microwave absorption performances.
Conclusions
In summary, Co/Ni@NPC/NCNTs with abundant branched structures, doped-N and carbon-coated magnetic metal NPs, were successfully prepared by subsequent melamine-assisted CVD of Co/Ni-MOF-74 nanorods as precursors. The rich branched CNTs on the rod matrix facilitated abundant interfacial polarization and multiple reflections, as well as exhibited effectively optimized impedance matching. Simultaneously, controllable N doping in carbon enhanced the dipole polarization. Due to the synergistic effects of the dielectric/magnetic components and unique branched structure, Co/Ni@NPC/NCNTs exhibited excellent dual-band EMWA properties, which were verified by RCS simulations. In the 2–18 and 26.5–40 GHz bands, the RLmin increased to −54.8 and −49.5 dB, while the EABmax increased to 4.7 and 9.7 GHz at thin thicknesses, respectively. The proposed strategy provides a potential reference for further investigations into designing MOF-derived absorbers with multiband, ultrathin EMWA properties.Author contributions
Zhe Zhang: conceptualization, investigation, validation, formal analysis, and writing – original draft. Jiewu Cui: methodology, resources, writing – review & editing, supervision, and funding acquisition. Dongbo Yu: conceptualization and methodology. Jiaqin Liu: methodology and investigation. Pengjie Zhang: project administration. Yong Zhang: project administration, supervision and funding acquisition. Linjie Wang: methodology and investigation. Guangsheng Deng: methodology, writing – review & editing. Song Ma: methodology and writing – review & editing. Yucheng Wu: project administration, supervision, resources, and funding acquisition.Conflicts of interest
There are no conflicts to declare.Acknowledgements
This work was supported by the National Key R&D Projects of China (2022YFB3504804), the Science and Technology Major Project of Anhui Province (202003a05020007), and Tianchang-HFUT Industrial Innovation Projects (JZ2020YDZJ0004).Notes and references
- H. A. H. Alobaidy, M. Jit Singh, M. Behjati, R. Nordin and N. F. Abdullah, IEEE Access, 2022, 10, 24095–24131 Search PubMed.
- J. Cheng, H. Zhang, M. Ning, H. Raza, D. Zhang, G. Zheng, Q. Zheng and R. Che, Adv. Funct. Mater., 2022, 32, 2200123 CrossRef CAS.
- Y. Ren, X. Wang, J. Ma, Q. Zheng, L. Wang and W. Jiang, J. Mater. Sci. Technol., 2023, 132, 223–251 CrossRef CAS.
- R. Kinugawa, K. Imoto, Y. Futakawa, S. Shimizu, R. Fujiwara, M. Yoshikiyo, A. Namai and S.-I. Ohkoshi, Adv. Eng. Mater., 2021, 23, 2001473 CrossRef CAS.
- H. Lv, Z. Yang, B. Liu, G. Wu, Z. Lou, B. Fei and R. Wu, Nat. Commun., 2021, 12, 834 CrossRef CAS PubMed.
- Y. Wu, S. Tan, Y. Zhao, L. Liang, M. Zhou and G. Ji, Prog. Mater. Sci., 2023, 135, 101088 CrossRef.
- A. Choudhary, S. Pal and G. Sarkhel, Int. J. Microw. Wirel. Technol., 2022, 15, 347–363 CrossRef.
- M. Plata-Jimenez, S. Khotiaintsev and J. I. Martinez-Lopez, 2022 IEEE 41st International Conference on Electronics and Nanotechnology (ELNANO), Kyiv, Ukraine, 10, 2022.
- Z. Gao, D. Lan, L. Zhang and H. Wu, Adv. Funct. Mater., 2021, 31, 2106677 CrossRef CAS.
- X. Xu, D. Li, L. Li, Z. Yang, Z. Lei and Y. Xu, Small Struct., 2022, 4, 2200219 CrossRef.
- L. Wu, K. Zhang, J. Shi, F. Wu, X. Zhu, W. Dong and A. Xie, Composites, Part B, 2022, 228, 109424 CrossRef CAS.
- M. Huang, L. Wang, W. You and R. Che, Small, 2021, 17, 2101416 CrossRef CAS PubMed.
- P. Yin, L. Zhang, J. Wang, X. Feng, Y. Zhang, J. Dai and J. Liu, Ceram. Int., 2022, 48, 12979–12987 CrossRef CAS.
- Z. Gao, A. Iqbal, T. Hassan, L. Zhang, H. Wu and C. M. Koo, Adv. Sci., 2022, 9, 2204151 CrossRef CAS PubMed.
- Z. Wu, C. Jin, Z. Yang and R. Che, Carbon, 2022, 189, 530–538 CrossRef CAS.
- J. Cheng, W. Yuan, A. Zhang, H. Zhao and Y. Wang, J. Mater. Chem. C, 2020, 8, 13712–13722 RSC.
- Q. Huang, Y. Zhao, Y. Wu, M. Zhou, S. Tan, S. Tang and G. Ji, Chem. Eng. J., 2022, 446, 137279 CrossRef CAS.
- H. Zhao, Q. Wang, H. Ma, Y. Zhao, L. Li, P. Li, J. Yan, J. Yun, W. Zhao, H. Zhang, Z. Zhang and C. Liu, Carbon, 2023, 201, 347–361 CrossRef CAS.
- C. Zhang, K. Luo, J. Liu, H. Zhang, C. Xu, R. Zhang, Y. Cheng, J. Zhang, L. Wu and R. Che, J. Mater. Sci. Technol., 2024, 175, 1–9 CrossRef.
- W. Hou, K. Peng, S. Li, F. Huang, B. Wang, X. Yu, H. Yang and H. Zhang, J. Colloid Interface Sci., 2023, 646, 265–274 CrossRef CAS PubMed.
- M. Qin, L. Zhang and H. Wu, Adv. Sci., 2022, 9, 2105553 CrossRef CAS PubMed.
- C. Xu, L. Wang, X. Li, X. Qian, Z. Wu, W. You, K. Pei, G. Qin, Q. Zeng, Z. Yang, C. Jin and R. Che, Nano-Micro Lett., 2021, 13, 47 CrossRef PubMed.
- Z. Zhao, X. Zhou, K. Kou and H. Wu, Carbon, 2021, 173, 80–90 CrossRef CAS.
- L. Wang, B. Wen, X. Bai, C. Liu and H. Yang, ACS Appl. Nano Mater., 2019, 2, 7827–7838 CrossRef CAS.
- J. Pan, H. Yang, Q. Hong, H. Wen, J. Q. Xiao and J. Hu, J. Mater. Chem. C, 2021, 9, 7302–7309 RSC.
- Y. Cao, J. Huang, Y. Li, S. Qiu, J. Liu, A. Khasanov, M. A. Khan, D. P. Young, F. Peng, D. Cao, X. Peng, K. Hong and Z. Guo, Carbon, 2016, 109, 640–649 CrossRef CAS.
- X. Shao, T. Wang, Z. Gan, R. Hu, Y. Gong, X. Li, X. Zhang and X. Tian, Carbon, 2021, 177, 171–180 CrossRef CAS.
- W. Liu, P. Duan, C. Mei, K. Wan, B. Zhang, H. Su, X. Zhang, J. Wang and Z. Zou, Dalton Trans., 2021, 50, 6222–6231 RSC.
- Y. Qiu, H. Yang, L. Ma, Y. Lin, H. Zong, B. Wen, X. Bai and M. Wang, J. Colloid Interface Sci., 2021, 581, 783–793 CrossRef CAS PubMed.
- Q. Huang, K. Wei and H. Xia, J. Therm. Anal. Calorim., 2019, 138, 3897–3903 CrossRef CAS.
- X. Zhu, H. Qiu, P. Chen, G. Chen and W. Min, Carbon, 2021, 173, 1–10 CrossRef CAS.
- H. Xu, B. Li, X. Jiang, Y. Shi, X. Zhang, C. Zhu, X. Zhang and Y. Chen, Carbon, 2023, 201, 234–243 CrossRef CAS.
- S. Feng, F. Zhai, H. Su, D. Sridhar, H. Algadi, B. B. Xu, R. A. Pashameah, E. Alzahrani, H. M. Abo-Dief, Y. Ma, T. Li and Z. Guo, Mater. Today Phys., 2023, 30, 100950 CrossRef.
- S. Ren, H. Yu, L. Wang, Z. Huang, T. Lin, Y. Huang, J. Yang, Y. Hong and J. Liu, Nano-Micro Lett., 2022, 14, 68 CrossRef CAS PubMed.
- J. Meng, C. Niu, L. Xu, J. Li, X. Liu, X. Wang, Y. Wu, X. Xu, W. Chen, Q. Li, Z. Zhu, D. Zhao and L. Mai, J. Am. Chem. Soc., 2017, 139, 8212–8221 CrossRef CAS PubMed.
- J. Li, H. Xue, N. Xu, X. Zhang, Y. Wang, R. He, H. Huang and J. Qiao, Mater. Rep.: Energy, 2022, 2, 100090 CAS.
- H. Wu, Y. Cheng, B. Wang, Y. Wang, M. Wu, W. Li, B. Liu and S. Lu, J. Energy Chem., 2021, 57, 198–205 CrossRef CAS.
- S. Geng, Y. Ji, J. Su, Z. Hu, M. Fang, D. Wang, S. Liu, L. Li, Y. Li, J. M. Chen, J. F. Lee, X. Huang and Q. Shao, Adv. Sci., 2023, 10, 2206063 CrossRef CAS PubMed.
- M. Huang, L. Wang, K. Pei, W. You, X. Yu, Z. Wu and R. Che, Small, 2020, 16, 2000158 CrossRef CAS PubMed.
- J. Tao, L. Xu, H. Jin, Y. Gu, J. Zhou, Z. Yao, X. Tao, P. Chen, W. Dinghui, Z. Li and H. Wu, Adv. Powder Mater., 2023, 2, 100091 CrossRef.
- M. Inagaki, M. Toyoda, Y. Soneda and T. Morishita, Carbon, 2018, 132, 104–140 CrossRef CAS.
- X. Li, L. Wang, W. You, X. Li, L. Yang, J. Zhang, M. Wang and R. Che, Nanoscale, 2019, 11, 22539–22549 RSC.
- X. Zuo, H. Zhang, C. Zhou, Y. Zhao, H. Huang, N. Wen, C. Sun, Z. Fan and L. Pan, Small, 2023, 19, 2301992 CrossRef CAS PubMed.
- S. Gao, S. Yang, H. Wang, G. Wang, P. Yin and X. Zhang, Composites, Part B, 2021, 215, 108781 CrossRef CAS.
- M. Green, L. Tian, P. Xiang, J. Murowchick, X. Tan and X. Chen, Mater. Chem. Front., 2018, 2, 1119–1125 RSC.
- B. Quan, X. Liang, G. Ji, Y. Cheng, W. Liu, J. Ma, Y. Zhang, D. Li and G. Xu, J. Alloys Comp., 2017, 728, 1065–1075 CrossRef CAS.
- M. Green, A. T. Tran and X. Chen, Adv. Mater. Interfaces, 2020, 7, 2000658 CrossRef CAS.
- H. Zhao, F. Wang, L. Cui, X. Xu, X. Han and Y. Du, Nano-Micro Lett., 2021, 13, 208 CrossRef CAS PubMed.
- M. Green and X. Chen, J. Materiomics, 2019, 5, 503–541 CrossRef.
- R. C. Che, L. M. Peng, X. F. Duan, Q. Chen and X. L. Liang, Adv. Mater., 2004, 16, 401–405 CrossRef CAS.
- Z. Ma, Q. Liu, J. Yuan, Z. Wang, C. Cao and J. Wang, Phys. Status Solidi B, 2012, 249, 575–580 CrossRef CAS.
- M. Mohanta, S. K. Parida, A. Sahoo, Z. Hussain, M. Gupta, V. R. Reddy and V. R. R. Medicherla, Physica B: Condens. Matter, 2019, 572, 105–108 CrossRef CAS.
- H. Wei, Z. Zhang, G. Hussain, L. Zhou, Q. Li and K. Ostrikov, Appl. Mater. Today, 2020, 19, 100596 CrossRef.
- Q. Liu, Q. Cao, H. Bi, C. Liang, K. Yuan, W. She, Y. Yang and R. Che, Adv. Mater., 2015, 28, 486–490 CrossRef PubMed.
- C. Jiang and B. Wen, Small, 2023, 19, 2301760 CrossRef CAS PubMed.
- T. Wang, G. Chen, J. Zhu, H. Gong, L. Zhang and H. Wu, J. Colloid Interface Sci., 2021, 595, 1–5 CrossRef CAS PubMed.
- M. Green, A. T. V. Tran and X. Chen, Comp. Sci. Technol., 2020, 199, 108332 CrossRef CAS.
- M. Green, Z. Liu, R. Smedley, H. Nawaz, X. Li, F. Huang and X. Chen, Mater. Today Phys., 2018, 5, 78–86 CrossRef.
Footnote |
| † Electronic supplementary information (ESI) available. See DOI: https://doi.org/10.1039/d3ma01035j |
| This journal is © The Royal Society of Chemistry 2024 |

