 Open Access Article
Interactions between alkali cations and cyanide-bridged network in A2Co4[Fe(CN)6]3.3 Prussian blue analogues revealed by far-infrared spectroscopy†
Maria
Dronova
ab,
Laura
Altenschmidt
ab,
Amélie
Bordage
 a,
Jean-Blaise
Brubach
b,
Marine
Verseils
b,
Gregory
Balthazar
a,
Pascale
Roy
b and
Anne
Bleuzen
a,
Jean-Blaise
Brubach
b,
Marine
Verseils
b,
Gregory
Balthazar
a,
Pascale
Roy
b and
Anne
Bleuzen
 *a
*a
aInstitut de chimie moléculaire et des matériaux d’Orsay (ICMMO), Université Paris-Saclay, CNRS, 17 avenue des Science, 91400 Orsay, France. E-mail: anne.bleuzen@universite-paris-saclay.fr
bSynchrotron SOLEIL, L’Orme des Merisiers Saint-Aubin, BP 48, 91192 Gif-sur-Yvette, France
First published on 15th March 2024
Abstract
A series of Prussian Blue Analogues (PBAs) having the chemical formula A2Co4[Fe(CN)6]3.3·nH2O (A+ = Na+, Rb+ and Cs+) was investigated by variable temperature far-infrared spectroscopy. Despite the same chemical composition of the cyanide-bridged CoFe network, the three compounds are known to exhibit different switching properties assignable to different interactions between the alkali cations and the cyanide-bridged CoFe network. Na2CoFe exhibits the thermally activated CoII(High Spin)FeIII → CoIII(Low Spin)FeII electron transfer upon cooling, whereas Rb2CoFe and Cs2CoFe are already in the CoIII(Low Spin)FeII electronic state at room temperature and remain in this electronic state upon cooling. Our variable temperature far-infrared spectroscopy study shows that the bands corresponding to the vibrations of the cyanide-bridged CoFe network and to the alkali cations exhibit different thermal behaviors upon cooling in the three compounds. These differences can be related to different interactions between the alkali cations and the cyanide-bridged CoFe network. Thus, far Infrared spectroscopy turns out to be a valuable tool to study these interactions so difficult to experimentally probe but which nevertheless play a crucial role in the properties of the compounds.
Introduction
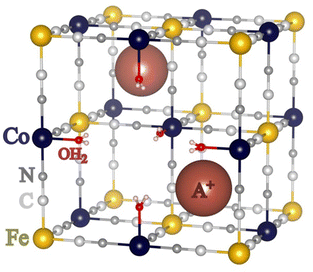
Thanks to their versatile chemistry and the disorder inherent in their crystallographic structure, Prussian Blue Analogues (PBAs) exhibit a wide range of properties (magnetism,1 electronic switching,2 cations intercalation,3 redox,4…) interesting for various applications (memory devices,2 sensors,3 batteries,4 catalysis,5…). PBAs form a class of coordination polymers of chemical formula AxMp[M′(CN)6]q□r·nOH2, where M2+/3+ and M′2+/3+ are transition metal ions, A+ is a cation belonging most often to the first group of the periodic table of elements and □ is a M′(CN)6 vacancy. Their structure is complex,6 but it can often be described in terms of the cubic structure with a face-centered lattice.7–9 The M2+/3+ and M′2+/3+ transition metal ions, bridged by CN− anions, form a bimetallic network made of strong chemical bonds; in the vicinity of the M′(CN)6 vacancies, the M2+/3+ ions complete their coordination sphere with water molecules. The A+ cations occupy various interstitial sites and some other zeolitic water molecules fill the remaining cavities. A scheme of one unit cell of the compounds of chemical formula A2Co4[Fe(CN)6]3.3□0.7·nOH2, which are investigated in the following, is displayed in Fig. 1. The structure of most PBAs exhibits a certain degree of intrinsic disorder due to the presence of a variable amount of M′(CN)6 vacancies, a variable amount of interstitial cations in ill-defined sites, and a variable amount of water molecules (either zeolitic or linked to the M2+/3+ cation), as well as possible distortion or tilting of the transition metal ion coordination spheres.10 Except for some particular compounds generally containing many interstitial cations and few vacancies,11,12 these defects do not exhibit long range order, so that their local effect on the structure and consequently on the properties of the compounds is extremely difficult to assess.Infrared spectroscopy, sensitive to the vibration of all species present in the PBAs, is a possible tool to get valuable information on these defects and their role in the properties. Nevertheless, the study of PBAs by infrared spectroscopy has been so far most often restricted to the Middle-Infra-Red (MIR) range, where the cyanide ion vibration bands give information on the bridging character of the cyanide ion and the oxidation states of the transition metal ions.13–16 In this MIR range, dynamical studies were also performed to monitor the charge transfer in the RbMn[Fe(CN)6] PBA for instance.17–19 Some studies then extended the investigation of PBA in the Far-InfraRed (FIR) range, where, in addition to the M–NC and M′–CN bonds,20,21 the vibrations of the alkali cation is accessible.22 The development of computational capacities also opened the door towards a theoretical support to assign the experimental bands in the whole (MIR and FIR) spectrum and so to push forward our microscopic knowledge of PBAs.21,22 In this work, a series of three powdered CoFe PBAs of chemical formula A2Co4[Fe(CN)6]3.3□0.7·nOH2 (A+ = Cs+, Rb+ and Na+) was investigated by variable temperature synchrotron FIR spectroscopy. They are called Na2CoFe, Rb2CoFe, and Cs2CoFe in the following. The stoichiometry of the cyanide-bridged CoFe network is exactly the same in the three compounds, only the nature of the alkali cations in the interstitial sites and the amount of zeolitic water molecules vary from one compound to another. Their thermal behaviors have already been reported.23–25Na2CoFe exhibits the thermally activated CoII(High Spin)FeIII → CoIII(Low Spin)FeII electron transfer upon cooling, whereas Rb2CoFe and Cs2CoFe show no such change and remain in the CoIII(low spin)FeII electronic state within the whole temperature range. These different behaviors arise from the different nature of the alkali cation, which differently interacts with the cyanide-bridged CoFe network in the three compounds. Nevertheless, direct and unambiguous information on these interactions is still missing. Hence, as a probe of all chemical bonds, in situ FIR spectroscopy has been used here as an original tool to investigate these interactions between the alkali cations and the cyanide-bridged bimetallic network.
Results and discussion
Attribution of the bands
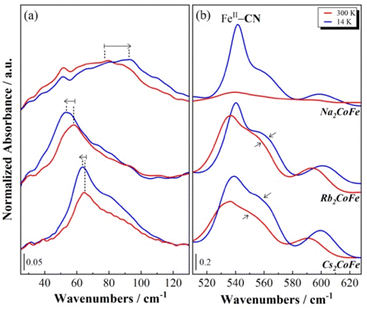
The room temperature FIR spectra for the A2CoFe series are displayed in Fig. 2, where the spectrum of Na2CoFe is also compared to the one recorded at 14 K.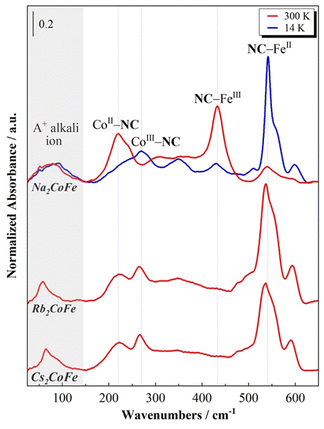 | ||
| Fig. 2 Far-Infrared spectra of the A2CoFe PBAs at 300 K and of Na2CoFe at 14 K. The spectra were normalized by the NC–Fe band maximum of their CoIIIFeII state at 14 K. | ||
First of all, one can observe from the spectra at 300 K that the series can be splitted into two groups: Rb2CoFe and Cs2CoFe on the one side, with a very similar spectral shape, and on the other side Na2CoFe, which displays a very different spectrum at room temperature.
Na2CoFe is known to display a thermally activated electronic switching previously investigated by SQUID magnetometry23 and L2,3-edge X-ray absorption spectroscopy.24 The results from these studies show that Na2CoFe is found to be in the CoII(HS)FeIII state at room temperature and in the CoIII(LS)FeII states at 14 K.23,24 The same conclusions have been reached by Lejeune and co-workers20,26 from the FIR spectra of Na2CoFe at the corresponding temperatures. Thanks to (i) the comparison of the spectra at 300 K and 14 K, and (ii) the presence of bands situated at comparable frequencies on the spectra of the [M(NH3)6]k+ and [M(CN)6]j- complexes,27,28 the bands in the 200–300 cm−1 and the 400–600 cm−1 regions were attributed to vibration modes of the cyanide-bridged CoFe network and associated, respectively, with the Co–NC and Fe–CN bonds.20 We remind here the main conclusions. At room temperature, i.e. in the CoIIFeIII state, the band at 220 cm−1 corresponds to the CoII–NC bonds and the one at 433 cm−1 to the FeIII–CN bonds. Upon cooling, the intensity of these two bands decreases, with a concomitant increase of two bands at 270 cm−1 and 542 cm−1. Since the low temperature state of Na2CoFe is known to be CoIIIFeII, they were respectively attributed to the CoIII–NC and FeII–CN bonds. Comparable bands were observed on the FIR spectrum of the MnIIFeIII PBA with comparable structure and containing four Cs+ cations per unit cell (and no Fe(CN)6 vacancy) in ref. 21; based on first-principles phonon mode calculations, they were assigned to bending modes of the Mn–NC–Fe linkages. For the sake of clarity, we will keep associating them with the Co–NC and Fe–CN bonds, which nevertheless correspond to the main oscillators involved in each vibration mode.21
The FIR spectra of Rb2CoFe and Cs2CoFe at room temperature both display very similar spectral shape. They resemble the one of Na2CoFe at low temperature, which is fully consistent with their CoIII–FeII ground state.24,25,29 The main band around 540 cm−1 is thus associated with the FeII–CN bonds and the one around 270 cm−1 with the CoIII–NC bonds. The additional band around 215 cm−1 is attributed to the CoII–NC bonds, in agreement (i) with the spectrum of Na2CoFe at room temperature and (ii) with the known presence of a small amount of Co2+ ions in Rb2CoFe and Cs2CoFe.25,29
In addition to these main bands, two additional bands can be observed around 600 cm−1 and below 100 cm−1.
The band at 600 cm−1 is not unambiguously attributed in the literature. Bands at similar frequencies have already been reported in some alkali-containing (Cs+, Na+, K+) zinc ferrocyanides.30 Here, it is observed in the CoIIIFeII state (i.e. at 300 K for Rb2CoFe and Cs2CoFe, and at 14 K for Na2CoFe), but it is nearly absent on the spectrum of Na2CoFe at room temperature. Thus, it could be attributed to either a vibration mode of or specific FeII-CN bonds. However, bands around this frequency are also observed for Co–O bonds in Co oxides, in Co oxy-hydroxides and in transition metal based MOFs.31,32 This band could therefore also be related to the presence of deprotonated CoIII–O bonds. The assignment of this band will be further discussed in the following.
Below 100 cm−1, an additional band is observed, located at different frequencies for the three PBAs, whatever the temperature and so the electronic state of the Co and Fe ions (Fig. 2). We propose to attribute this band to the vibration mode of the alkali cation (Na+, Rb+ or Cs+) in interstitial sites of the PBA, in agreement with the theoretical and experimental study by Ohkoshi and co-workers of the Cs+ vibration mode in the Cs0.9Mn[Fe(CN)6]0.93 PBA.22 One can see that the shape of this contribution varies along the series. On the spectrum of Cs2CoFe at room temperature, it is comprised of a narrow peak at 65 cm−1 and a broad shoulder around 80 cm−1. In a series of CoFe PBAs, containing a decreasing amount of Fe(CN)6 vacancies and an increasing amount of Cs+ cations (Fig. S1, ESI†), the broad contribution disappears for the compound containing the minimum Fe(CN)6 vacancies, whereas the narrow peak vanishes for the compound containing more than one Fe(CN)6 vacancy per Cs+ ion (the unit cell of Cs0.7 contains 0.7 Cs+ cation and 1.1 Fe(CN)6 vacancies). Thus, we propose to assign the narrow peak to the vibration of the Cs+ ion in the closed cubic Co4Fe4 cavity (Fig. 3a) and the broad component to its vibration in an open Co(Co(OH2))3Fe3 (Fig. 3b) (or (Co(OH2))2(Co(OH2)2)2Fe2) cavity. As the size of the Cs+ cation matches the size of the closed cavity, this ion interacts with several surrounding cyanide bridging ions and its environment is well-defined, leading to a narrow peak. In contrast, for an open cavity, a wider range of environments can accommodate the Cs+ ions that are even likely to move from one to the other, resulting in a broader band. Thus, this suggests that the width of the contribution reflects the cation-to-cavity volumic ratio and an explanation for the variable shape of this band can be proposed along the A2CoFe series. The shape of the spectra of Rb2CoFe and Cs2CoFe below 100 cm−1 is comparable because the size of the Rb+ and the Cs+ ion is close. Like for the Cs+ ion, the narrow peak is assignable to Rb+ ions in the closed cubic Co4Fe4 cavities (Fig. 3a) and the broader contribution to Rb+ ions in open Co(Co(OH2))3Fe3 (Fig. 3b) (or (Co(OH2))2(Co(OH2)2)2Fe2) cavities. In contrast, the Na+ ion is significantly smaller than the two others, so that, whatever the closed or open cavity it is located in, the cation-to-cavity volumic ratio is always low, leading to a wider range of possible environments for the Na+ cation whatever the kind of cavity. This wider range of environments can explain the broadness of the band for the same amount of Fe(CN)6 vacancies as in the two other compounds.
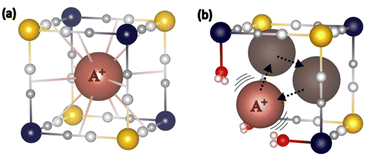 | ||
| Fig. 3 Scheme of (a) the closed and (b) the open Co(Co(OH2))3Fe3 Cavities and the proposed positioning for the bigger alkali cations (Rb+, Cs+) in each of them. | ||
At last, it is noticeable that the shape of the alkali cation vibration band, which we just related to the nature of the alkali cation and its environment, seems also to be connected to the electronic state of the compound at room temperature. Thus, the same broad band is observed on the spectra of Na2CoFe and Cs0.7CoFe (Fig. 2 and Fig. S1, ESI†), which are both stabilized in the CoIIFeIII electronic state at 300 K.20,23,25 In contrast, a peak, with a shoulder on the high frequencies side, is observed on the spectra of Cs2CoFe and Rb2CoFe (Fig. 2), which are both in the CoIIIFeII electronic state at room temperature. In the latters, the CoIIIFeII electronic state is formed through a redox reaction in solution during the synthesis of the compounds. The relationship between the electronic state of the compound and the shape of the alkali cation vibration band suggests that the presence of big alkali cations in closed cubic cavities (associated with the narrow peak on the spectra) plays a key role in the CoIIFeIII → CoIIIFeII redox reaction accompanying the formation of the compound.
The complete list of assigned frequencies is given in Table 1.
| Na2CoFe | Rb2CoFe | Cs2CoFe | ||||
|---|---|---|---|---|---|---|
| 300 K | 14 K | 300 K | 14 K | 300 K | 14 K | |
| a Possible attribution discussed in the text. | ||||||
| CoII–NC | 219.8 | — | 221.3 | 223.9 | 222.3 | 220.1 |
| CoIII–NC | — | 269.5 | 264.9 | 270 | 266.1 | 271.4 |
| FeIII–CN | 432.7 | — | — | — | — | — |
| FeII–CN | — | 541.7 | 536.6 | 540 | 536.4 | 540.5 |
| A+ | 79.8 | 92.8 | 58.3 | 53.3 | 64.6 | 63.6 |
| — | 598.5 | 593.2 | 600.7 | 590.6 | 599.3 | |
Effect of the temperature on the spectra
The spectra of Na2CoFe, Rb2CoFe and Cs2CoFe recorded upon cooling are shown in Fig. S2 (ESI†). For all compounds the spectra at 300 K and at 14 K are different, but these changes are fully reversible, as shown on the spectrum of Rb2CoFe at 300 K before cooling and after two cooling/heating cycles (Fig. S3, ESI†). The samples can be classified into the same two groups.The spectral changes for Na2CoFe (Fig. 2) are dominated by the thermally activated CoII(HS)FeIII → CoIII(LS)FeII electronic switching as stated in the above discussion. They reflect an abrupt electronic switching (Fig. S2, ESI†) in agreement with magnetic measurements.23 The weak intensity of the FeIII–CN band (430 cm−1) at low temperature indicates that the CoII(HS)FeIII → CoIII(LS)FeII electron transfer upon cooling is almost total. At last, the broad contribution at 80 cm−1 assigned to the vibration of the Na+ cation remains broad upon cooling (Fig. 4a). This can again be explained by the small size of the cation and the associated multiple positions of the latter in the cavities of the bimetallic network. Nevertheless, this contribution exhibits a significant change after the electron transfer, especially an upshift of the maximum of the band (+15 cm−1, i.e. +19%), showing that the electronic state change is accompanied with an important change in the vibrational properties of the Na+ cation.
Rb2CoFe and Cs2CoFe are in the CoIII(LS)FeII electronic state over the whole temperature range. Their spectra are both dominated by thermal effects. The bands assigned to the vibrations of the cyanide-bridged CoFe network exhibit a shift towards higher frequencies upon cooling: FeII–CN (+3–4 cm−1), CoIII–NC (+5 cm−1) (Fig. S2 and Table S1, ESI†). These high-frequency shifts can be assigned to lattice contraction effects usually observed upon cooling.
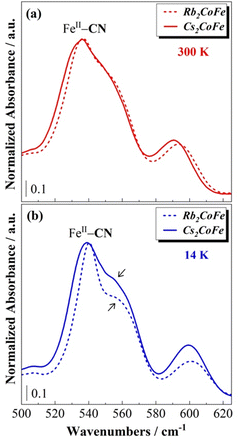
A closer look at the bands associated with the FeII–CN bonds (≈540 cm−1) and with the alkali cations (≈60 cm−1) highlights however some differences between Rb2CoFe and Cs2CoFe (Fig. 4). These bands show considerably larger changes for Rb2CoFe than for Cs2CoFe upon cooling. The concomitant change of these two bands suggests coupled effects, reflecting the same phenomenon. Since these bands are both expected to be affected by the interactions between the alkali cations and the cyanide-bridged CoFe bimetallic network, such a correlation likely reflects a change in these interactions. Such interactions (and so their modifications) are rarely detected in PBAs, except when the amounts of alkali cations and M(CN)6 vacancies are sufficiently large and small respectively, which allows for these interactions to spread in a cooperative way over the whole crystal. In that particular case, powder X-ray diffraction reveals a distortion of the cyanide-bridged bimetallic network due to the tilting of the transition metal ions octahedral coordination polyhedra possibly accompanied by a displacement of the alkali cation off the center of the cubic cavities.10 This is reminiscent of structural distortions reported for perovskites, for which the driving force is considered to be the underbonding of small cations with the surrounding anions in the cubic cavities.33 Our A2CoFe compounds do not exhibit such collective distortions. Indeed, they all contain less alkali cations and more Fe(CN)6 vacancies than the compounds exhibiting collective distortions. Nevertheless, the changes observed on the two bands associated to the FeII–CN bonds and to the alkali cations (Fig. 4) suggest that the changes in the interactions between the alkali cations and the cyanide-bridged bimetallic network can be probed by FIR spectroscopy. Due to the alkali cations dilution and their various envionments in closed and open cavities, the effects of these interactions remain localized and probably of lesser magnitude than in compounds where they spread in a cooperative way. It has also to be noted that in the CoIIIFeII electronic state, all the chemical bonds in the CoIII–NC–FeII linkages, including the CoIII(LS)–NC bond, are very covalent and strong, which can hinder/weaken any distortion of the cyanide-bridged bimetallic network driven by alkali cation–network interactions. Noteworthy, the peak of the vibration band of the alkali cation shows a significant shift to lower frequencies by 5 cm−1 (7%)‡ upon cooling for the Rb+ cation (Fig. 4a), but almost no shift for the Cs+ cation (1%). The usual thermal effects are fully excluded here, since in such case, the shift is towards higher frequencies, as observed for the bands associated to the Fe–CN and Co–NC bonds (see above). These different behaviours of the alkali cations vibration band thus reflect different interactions between the alkali cation and the surrounding Co4Fe4 cage and can be explained by the different size of the alkali cations. Thus, the larger Cs+ cation fits particularly well the cubic cavities and interacts equally with all 12 surrounding cyanido ligands over the whole temperature range without either significant structural change of the surrounding cage or displacement of the alkali cation; the band associated to its vibrations does almost not change upon cooling. This is consistent with the very rare observation of octahedral tilting in Cs+-rich PBAs.10 In contrast, the smaller Rb+ cation accommodates less well to all the cyanido ligands of the cubic cage. Interaction of the Rb+ cation with fewer cyanido ligands is thus likely to be favored upon cooling, which can explain the shift of the Rb+ vibration band. Such underbonding of the Rb+ cations in the cubic cavity is not surprising, since octahedral tilting revealing such situations, has already been reported in Rb+-rich PBAs.10,34–37 Furthermore, the frequency downshift of the band is consistent with the expected softening of the cation vibration band associated to the off-centering (or the early stages of the off-centering) of the alkali cation inside the closed cubic cavity, as observed in displacive-type ferroelectrics materials.§38-40 A scheme illustrating the proposed positioning of the Rb+ and Cs+ cations in the closed cubic cavities is shown in Fig. 5. It is noticeable that such off-centering of the Rb+ cation has been observed in molecular cubic cage mimicking the octant of CoFe PBAs.41
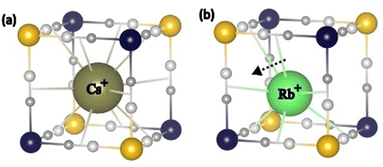 | ||
| Fig. 5 Scheme of the proposed positioning of the (a) Cs+ and (b) Rb+ cations in the closed cubic cavities. | ||
The effects of interactions between the alkali cations and the cyanide-bridged CoFe network are also detectable in the FeII—CN bond vibration frequency range on the spectra of Rb2CoFe and Cs2CoFe (Fig. 4b and Fig. 6). The band assigned to the FeII–CN bond is assymetric and can be described as a pair of bands (a narrow peak and a high frequency broad shoulder). These two contributions either correspond to two different vibration modes (stretching and deformation for instance) or reflect the presence of two different environments for the FeII(CN)6 entities in the compounds. As the chemical composition of the cyanide-bridged CoFe network and the oxidation state of the transition metal ions are exactly the same in both compounds, the differences between these two contributions can be assigned to different interactions between the FeII(CN)6 entities and the alkali cations. At room temperature, the shape of this band is very similar for both Rb2CoFe and Cs2CoFe, indicating comparable environments of the FeII(CN)6 entities in both compounds (Fig. 6a). It also suggests comparable interactions between the alkali cations and the FeII(CN)6 entities in both compounds. The shape of the FeII—CN band on the spectrum of Cs2CoFe shows very little changes upon cooling (Fig. 4b), suggesting almost unchanged interactions between the Cs+ cation and the FeII(CN)6 entities, in line with the unchanged vibration band of the Cs+ cation. The Cs+ cation fits perfectly well the cubic cage and interacts equally with the surrounding cyanido ligands whatever the temperature. In contrast, at low temperature, the relative intensity of the peak and shoulder of the band seems to be different between the two PBAs, with a significant evolution for Rb2CoFe with respect to room temperature. The change in the intensity ratio between the peak and the shoulder upon cooling on the spectrum of Rb2CoFe suggests different interactions between the Rb+ cation and the FeII(CN)6 entities at 300 K and 14 K, in line with the shift of the vibration band of the Rb+ cation and the proposed reduced coordination number of the latter upon cooling.
Effect of the alkali cation chemical nature on the FeII–CN band at low temperature
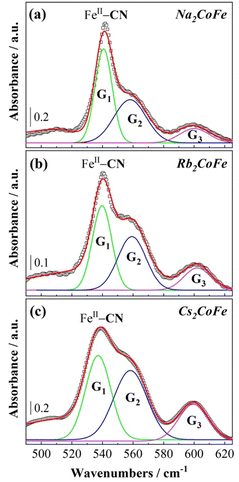
At 14 K, the oxidation states of the transition metal ions (Fig. S4, ESI†) and the chemical composition of the cyanide bridged CoFe network are the same for Cs2CoFe, Rb2CoFe and Na2CoFe. Nevertheless, the shape of the FeII–CN band is clearly different on the spectra of the three compounds (Fig. 7). The main difference between the three compounds is the chemical nature of the alkali cation. The different shape of the FIR spectrum over the 500–550 cm−1 frequency range can therefore be assigned to different interactions between the alkali cations and the Fe(CN)6 entities. The relative intensity of the peak and of the shoulder of the FeII–CN band as well as that of the band at 600 cm−1 seems to vary along the series. Fig. 7 shows the deconvolution of these bands into three Gaussian components for the three compounds and their frequency of absorbance maximum, full-width at half maximum and area under peak are given in Table S1 (ESI†). The results of the deconvolution show that the G1 peak displays the strongest variation with the chemical nature of the alkali cation. Its area under the peak decreases and the frequency of its absorbance maximum and linewidth increase as the size of the alkali cation increases from Na+ to Cs+. The G1 peak can be assigned either to Fe(CN)6 entities directly interacting with the alkali cations or to a vibration mode of the Fe(CN)6 entities affected by the presence of the alkali cations. In contrast, the G2 and G3 peaks exihibit very close absorbance maxima and linewidths for the three compounds. They can be assigned either to Fe(CN)6 entities without significant interaction with the alkali cations or to vibration modes of the Fe(CN)6 entities, which are not affected by the presence of the alkali cations. The assignment of the G3 peak to deprotonated CoIII–O bonds can be ruled out. Indeed, in this case, a change in the stretching vibration bands of the OH bonds of water molecules coordinated to the Co ions in the MIR range should have an impact on this band. On the contrary, the G3 peak is unchanged while the stretching vibration bands of the OH bonds of water molecules bound to the Co ions of Cs2CoFe and Rb2CoFe on the one hand and of Na2CoFe on the other hand are much different (Fig. S5, ESI†).All these results enable to better understand the interactions between the alkali cation and the cyanide-bridged CoFe bimetallic network, and to emphasize the role of the alkali cation in the different compounds. In the A2CoFe series of compounds containing the same number of alkali cations and Fe(CN)6 vacancies, and therefore exhibiting the same Co4[Fe(CN)6]3.3 chemical composition of the cyanide-bridged bimetallic network, three different thermal behaviors are indeed observed depending on the nature and, consequently, on the size of the alkali cation. As stated above, the evolution of the spectrum of Cs2CoFe, which is in the CoIIIFeII electronic state whatever the temperature, is dominated upon cooling by pure thermal effects. The big Cs+ cation fits the PBA's cavities particularly well without modification in the Cs+-cyanide-bridged CoFe network interactions upon cooling (Fig. 4). Rb2CoFe is in the same electronic state as Cs2CoFe whatever the temperature. However, despite comparable spectra for the main bands between Rb2CoFe and Cs2CoFe at 300 K, the spectrum of Rb2CoFe exhibits more significant changes than that of Cs2CoFe upon cooling, revealing different alkali cations thermal behaviours. These different thermal behaviours are assignable to their different sizes, resulting in different bondings with the surrounding anions. Finally, the spectrum evolution of Na2CoFe upon cooling is dominated by the thermally activated electron transfer. Nevertheless, the change of the Na+ vibration band reflects an effect of the electron transfer on the interactions between the alkali cation and the cyanide-bridged CoFe network.
Experimental
Compounds synthesis
The powdered CoFe Prussian Blue Analogues with chemical formula A2Co4[Fe(CN6)]3.3·nH2O (A= Na+, Rb+ and Cs+) were prepared from a precipitation reaction in aqueous solutions of potassium ferricyanide(III) and cobalt(II) nitrate salts, by following the synthesis conditions as described in ref. 24. These samples are respectively called Na2CoFe, Rb2CoFe and Cs2CoFe. Their characterization using elemental analysis, X-ray diffraction, X-ray absorption spectroscopy and magnetization measurements can be found in a separate series of publications elsewhere.24,25,29,42,43 The chemical composition, the structure and the electronic state of the three compounds have been checked before recording the IR spectra.Infrared (IR) spectroscopy
The temperature-dependent far-infrared (FIR) spectroscopic studies were carried out on the beamline AILES at synchrotron SOLEIL (Gif sur Yvette, France).44 Samples were prepared by dispersing the powders with Nujol oil to form a paste, which was placed in a liquid absorption cell between two diamond windows. All the measurements were acquired on a Bruker IFS 125 Fourier transform spectrometer equipped with a 6 μm Si beam splitter and a 4.2 K liquid-helium-cooled Si bolometer detector to assess a far-IR spectral window (20 ≤ ω ≤ 650 cm−1). Prior to the measurements, the spectrometer was evacuated down to a 2 × 10⁻⁵ mbar pressure to minimize absorptions due to residual gases and to limit ice formation on the sample during the cooling down of the sample. The IR spectra were recorded upon cooling and heating cycles in the temperature range from 300 K to 14 K. The temperature on the sample was maintained using a temperature controller (Lakeshore model 336) connected to a thermostat, which is in thermal contact with a copper sample holder. All data were recorded in transmission mode. The reference spectrum was measured under the same conditions by using the sample holder filled with pure Nujol and then substracted from all the subsequent data acquisition. Each spectrum was subjected to a linear baseline correction and removal of interference fringes arising from internal reflection within diamond windows.45 Lastly, all spectra were normalized to a range [0, 1] by setting the maximum intensity value (of the FeII–CN band at 14 K) at 1. The bands frequency determination where done by the use of the Origin software.The uncertainty in bands position (Δν) can be approximated as follows: Δν ≈ ΔW/2(S/N), where ΔW is the bandwidth at half-maximum and (S/N) represents the signal-to-noise ratio.46 For the Rb+ alkali cation band at 53 cm−1 (at 14 K), the width half-maximum of 23.0 cm−1 combined with the high signal-to-noise ratio of approximately 142 achieved using the synchrotron source, gives an accuracy for the band position better than 0.08 cm−1. The peak maxima of other bands studied in detail, such as that of Fe–CN at 540 cm−1, are defined with equivalent precision. Such precision fully validates the observed frequency shifts of a few wavenumbers.
Conclusions
The use of far-infrared spectroscopy remains scarce in the investigation of the structure-properties relationships in Prussian blue analogues. This variable temperature study of the A2CoFe series demonstrates that FIR spectroscopy, despite the need of synchrotron radiation to be used, is particularly well-suited to probe the interactions between the alkali cations in interstitial sites of Prussian blue analogues and the surrounding cyanide-bridged bimetallic network. These interactions play a crucial role in the properties of the PBAs, but they can be revealed only in favorable cases where they spread in a cooperative way in the compounds and can then be detected by powder XRD. Here, thanks to this proof-of-concept study, we show that FIR spectroscopy bring information in these interactions even for PBAs with few alkali cations and no cooperative effect. This paves the way towards a better understanding of the properties of PBAs where alkali cations play a key role.Conflicts of interest
There are no conflicts to declare.Acknowledgements
The authors acknowledge SOLEIL for the provision of synchrotron radiation facility on the AILES beamline through proposals 20201201 and 20220450. This work was supported by the Paris Ile-de-France region (DIM Respore). The authors thank K. Rader for technical support during experiments.Notes and references
- M. Verdaguer, A. Bleuzen, V. Marvaud, J. Vaisserman, M. Seuleiman, C. Desplanches, A. Scuiller, C. Train, R. Garde, G. Gelly, C. Lomenech, I. Rosenman, P. Veillet and C. Cartier dit Moulin, Coord. Chem. Rev., 1999, 190–192, 1023 CrossRef CAS.
- O. Sato, T. Iyoda, A. Fujishima and K. Hashimoto, Science, 1996, 272, 704 CrossRef CAS PubMed.
- J. Jang and D. S. Lee, Ind. Eng. Chem. Res., 2016, 55, 3852 CrossRef CAS.
- Y. Lu, L. Wang, J. G. Cheng and J. B. Goodenough, Chem. Commun., 2012, 48, 6544 RSC.
- K. Itaya, N. Shoji and I. Uchida, J. Am. Chem. Soc., 2010, 20, 5110 Search PubMed.
- A. Simonov, T. De Baerdemaeker, H. L. B. Boström, M. L. Rios Gomez, H. J. Gray, D. Chernyshov, A. Bosak, H.-B. Bürgi and A. L. Goodwin, Nature, 2020, 578, 256 CrossRef CAS PubMed.
- A. Lüdi, H.-U. Güdel and M. Rüegg, Inorg. Chem., 1970, 9(10), 2224 CrossRef.
- H. J. Buser, D. Schwarzenbach, W. Fetter and A. Lüdi, Inorg. Chem., 1977, 16, 2704 CrossRef CAS.
- A. Lüdi and H. U. Güdel, Structure and Bonding, Spinger-Verlag, Berlin, Germany, 1973, pp. 1–21 Search PubMed.
- H. L. B. Boström and W. R. Brant, J. Mater. Chem. C, 2022, 10, 13690 RSC.
- X. Bie, K. Kubota, T. Hosaka, K. Chiharab and S. Komaba, J. Mater. Chem. A, 2017, 5, 4325 RSC.
- J. Cattermull, K. Sada, K. Hurlbutt, S. J. Cassidy, M. Pasta and A. L. Goodwin, Chem. Mater., 2022, 34, 5000 CrossRef CAS PubMed.
- J. D. Qiu, H.-Z. Peng, R.-P. Liang, J. Li and X.-H. Xia, Langmuir, 2007, 23, 2133 CrossRef CAS PubMed.
- R. O. Lezna, R. Romagnoli, N. R. de Tacconi and K. Rajeshwar, J. Phys. Chem. B, 2002, 106, 3612 CrossRef CAS.
- N. Shimamoto, S.-I. Ohkoshi, O. Sato and K. Hashimoto, Inorg. Chem., 2002, 41, 678 CrossRef CAS PubMed.
- A. C. Felts, M. J. Andrus, C. M. Averback, C. H. Li and D. R. Talham, Polyhedron, 2017, 133, 404 CrossRef CAS.
- T. Suemoto, K. Ohki, R. Fukaya, M. Nakajima, H. Tokoro and S. Ohkoshi, J. Lumin., 2009, 129, 1775 CrossRef CAS.
- T. Suemoto, R. Fukaya, A. Asahara, M. Nakajima, H. Tokoro and S. Ohkoshi, Phys. Status Solidi B, 2011, 248, 477 CrossRef CAS.
- A. Asahara, M. Nakajima, R. Fukaya, H. Tokoro, S.-I. Ohkoshi and T. Suemoto, Phys. Status Solidi B, 2011, 248, 491 CrossRef CAS.
- J. Lejeune, J.-B. Brubach, P. Roy and A. Bleuzen, C. R. Chim., 2014, 17, 534 CrossRef CAS.
- H. Tokoro, A. Namai, M. Yoshikiyo, R. Fujiwara, K. Chiba and S. Ohkoshi, Sci. Rep., 2018, 8, 63 CrossRef PubMed.
- S.-I. Ohkoshi, M. Yoshikiyo, A. Namai, K. Nakagawa, K. Chiba, R. Fujiwara and H. Tokoro, Sci. Rep., 2017, 7, 8088 CrossRef PubMed.
- R. Le Bris, J.-D. Cafun, C. Mathonière, A. Bleuzen and J.-F. Létard, New J. Chem., 2009, 33, 1255 RSC.
- J.-D. Cafun, G. Champion, M.-A. Arrio, C. Cartier dit Moulin and A. Bleuzen, J. Am. Chem. Soc., 2010, 132, 11552 CrossRef CAS PubMed.
- V. Escax, A. Bleuzen, C. Cartier dit Moulin, F. Villain, A. Goujon, F. Varret and M. Verdaguer, J. Am. Chem. Soc., 2001, 123, 12536 CrossRef CAS PubMed.
- J. Lejeune, J.-D. Cafun, G. Fornasieri, J. B. Brubach, G. Creff, P. Roy and A. Bleuzen, Eur. J. Inorg. Chem., 2012, 3980 CrossRef CAS.
- H. J. Llewellyn, Inorg. Chem., 1963, 2, 777 CrossRef.
- K. Nakamoto, Infrared and Raman Spectra of Inorganic and Coordination Compounds, John Wiley & Sons, Inc., Hoboken, New Jersey, 2008 Search PubMed.
- A. Bleuzen, C. Lomenech, V. Escax, F. Villain, F. Varret, C. Cartier dit Moulin and M. Verdaguer, J. Am. Chem. Soc., 2000, 122, 6648 CrossRef CAS.
- C. Loos-Neskovic, M. Fedoroff and E. Garnier, Talanta, 1989, 36, 749 CrossRef CAS PubMed.
- C.-W. Tang, C.-B. Wang and S.-H. Chien, Thermochim. Acta, 2008, 473, 68 CrossRef CAS.
- K. I. Hadjiivanov, D. A. Panayotov, M. Y. Mihaylov, E. Z. Ivanova, K. K. Chakarova, S. M. Andonova and N. L. Drenchev, Chem. Rev., 2021, 121, 1286 CrossRef CAS PubMed.
- P. M. Woodward, Acta Crystallogr., Sect. B: Struct. Sci., 1997, 53, 44 CrossRef.
- J.-H. Her, P. W. Stephens, C. M. Kareis, J. G. Moore, K. S. Min, J.-W. Park, G. Bali, B. S. Kennon and J. S. Miller, Inorg. Chem., 2010, 49, 1524 CrossRef CAS PubMed.
- T. Matsuda, J. Kim and Y. Moritomo, Dalton Trans., 2012, 41, 7620 RSC.
- Y. Moritomo, M. Hanawa, Y. Ohishi, K. Kato, M. Takata, A. Kuriki, E. Nishibori, M. Sakata, S. Ohkoshi, H. Tokoro and K. Hashimoto, Phys. Rev. B: Condens. Matter Mater. Phys., 2003, 68, 144106 CrossRef.
- H. L. B. Bostrom and R. I. Smith, Chem. Commun., 2019, 55, 10230 RSC.
- J. Petzelt, G. V. Kozlov and A. A. Volkov, Ferroelectrics, 2011, 73, 101 CrossRef.
- W. Cochran, Adv. Phys., 1960, 9, 387 CrossRef CAS.
- S. Aubry and R. Pick, J. Phys., 1971, 32, 657 CrossRef.
- J. Glatz, J.-R. Jiménez, L. Godeffroy, H. J. von Bardeleben, L. Fillaud, E. Maisonhaute, Y. Li, L.-M. Chamoreau and R. Lescouëzec, J. Am. Chem. Soc., 2022, 144, 10888 CrossRef CAS PubMed.
- A. Bleuzen, V. Escax, J.-P. Itié, P. Münsch and M. Verdaguer, C. R. Chim., 2003, 6, 343 CrossRef CAS.
- V. Escax, C. Cartier dit Moulin, V. Villain, G. Champion, J.-P. Itié, P. Münsch, M. Verdaguer and A. Bleuzen, C. R. Chim., 2003, 6, 1165 CrossRef CAS.
- P. Roy, M. Rouzières, Z. Qi and O. Chubar, Infrared Phys. Technol., 2006, 49, 139 CrossRef CAS.
- M. F. Faggin and M. A. Hines, Rev. Sci. Instrum., 2004, 75, 4547 CrossRef CAS.
- S. P. Davis, M. C. Abrams and J. J. W. Brault, Fourier Transform Spectrometry, Academic Press, San Diego, CA, 2001 Search PubMed.
Footnotes |
| † Electronic supplementary information (ESI) available: FIR spectra of CoFe PBAs of chemical formula CsxCo4[Fe(CN)6](8+x)/3·nH2O at 300 K; FIR spectra of Na2CoFe, Rb2CoFe and Cs2CoFe recorded upon cooling; FIR spectra of Rb2CoFe at 300 K before cooling and after 1 and 2 cooling/heating cycles; low temperature XANES spectra of Na2CoFe, Rb2CoFe and Cs2CoFe at the Co and Fe K-edges; MIR spectra of Na2CoFe, Rb2CoFe and Cs2CoFe over the 3400–3800 cm−1 frequency range; frequency of absorbance maximum, full-width at half maximum and area under peak for the three Gaussian components (G1, G2, G3). See DOI: https://doi.org/10.1039/d4ma00064a |
| ‡ It is noteworthy that the 5 cm−1 shift of the Rb+ band from 58.3 cm−1 to 53.3 cm−1 is significant and corresponds to a band shift of 7%. For comparison, the ≈40 cm−1 shift of the cyanide band in the Middle InfraRed accompanying the CoIIICNFeII to CoIICNFeIII electron transfer corresponds to a band shift of only 1.7%. |
| § Generally, the softening of one mode toward low frequency with temperature is a well known “soft-mode” behavior particularly studied and identified in ferroelectric materials. Indeed, based on Laudau theory of phase transitions, Cochran has demonstrated that if a crystal undergoes a second order phase transition and if this transition is of the displacive type (the low temperature equilibrium positions of atoms can be described as a displacement of the atoms from their high temperature equilibrium positions),39,40 it always exists a phonon whose frequency goes to zero at the critical temperature, while the other phonons frequencies remain finite. This theory was confirmed by the observation of very strong mode softening in ferroelectrics materials,38 where the ferroelectric transition corresponds to the off-centering of the cation that is inside the oxygen octahedra cage. |
| This journal is © The Royal Society of Chemistry 2024 |

