DOI:
10.1039/D4MA00067F
(Paper)
Mater. Adv., 2024,
5, 4286-4292
The effect of co-substitution of heterovalent ions Ga3+ and Sb5+ on nonlinear optical properties of phosphate crystals†
Received
23rd January 2024
, Accepted 22nd March 2024
First published on 23rd March 2024
Abstract
The strong second harmonic response of nonlinear optical (NLO) materials is of great scientific significance for laser technology. The second harmonic generation (SHG) response in NLO crystals is usually enhanced by introducing non-centrosymmetric active structural units with permanent hyperpolarizability into the structure. We have designed and grown a series of Ga3+:Sb5+:KTiOPO4 crystals based on traditional KTiOPO4 by co-doping Ga and Sb ions. The chemical compositions of the crystals were determined through inductively coupled plasma atomic emission spectroscopy (ICP-AES). The electronic structure was analyzed by X-ray photoelectron spectroscopy (XPS), and it was determined that the chemical strengths of Ti–O K–O and P–O bonds are related to the binding energy difference. After the introduction of doping ions, the frequency doubling conversion efficiency increased from 1064 to 532 nm, up to approximately 22%. And the SHG responses of Ga3+:Sb5+:KTP crystals have significantly enhanced, with a NLO coefficient close to 1.25 times that of KTP crystals. First-principles calculations and structural analyses show that the improved SHG response of Ga3+:Sb5+:KTP crystals is mainly influenced by the [SbO6] groups. This study provides a new illustration for improving the NLO performance of crystals.
1. Introduction
In 1961, Franken et al.1 first discovered the laser frequency doubling phenomenon in a quartz crystal, marking the beginning of NLO materials and promoting their rapid development. NLO crystals are one of the important photoelectric information functional materials, and their development degree is closely related to the development of laser technology. They can be used for converting laser frequency and expanding the wavelength of lasers; modulating the intensity and phase of lasers; realizing holographic storage of laser signals, and so on. They are indispensable materials in high-tech and modern military technology, and have important applications in the fields of photoelectric communication, laser processing, laser weapons and laser medicine. Metal phosphates have attracted widespread attention from the academic community due to their excellent physical and chemical properties and structural advantages.2–5 The structure of a PO4 tetrahedron is conducive to ensuring a shorter UV cutoff edge, making it a good candidate material for UV or deep UV NLO crystals.2,6–12 However, due to the highly symmetric tetrahedral geometries of [PO4]3− units, metal phosphates exhibit a weak SHG response.13 Up to now, the largest SHG response of an alkali- or alkaline-earth metal phosphate is 2.6 × KDP (LiCs2PO4).2 As a critical optical performance of nonlinear optical crystals, obtaining a large NLO response to achieve high laser output efficiency remains a core issue.
In order to improve the SHG response, it is necessary to introduce additional structural NLO-active units, that is, introducing non-centrosymmetric active structural units with permanent hyperpolarizability into the structure, which are generally divided into the following three types: (1) octahedrally coordinated d0 transition metal cations (Zr4+, Ti4+, Nb5+, Mo6+, W6+, V5+, Ta5+, and Sb5+) with a second-order Jahn Teller (SOJT) effect,14–17 (2) stereoactive lone pair cations (Pb2+, Bi3+, Sn2+, Se4+, and Te4+),18–22 and (3) d10 cations (Zn2+, Cd2+, and Hg2+) with large polar displacement.18,23–25 The influence of different nonlinear active units on the NLO performance of crystals varies. Taking octahedrally coordinated d0 transition metal cations as an example, it was found that different metal polyhedra have different degrees of distortion, and the average magnitude of the intraoctahedral distortion scales are as follows: Mo6+ > V5+ > W6+ > Nb5+ > Ta5+ > Ti4+.14 For example, two new phosphate crystals: KCsWP2O9 and KCsMoP2O9 crystals,15,16 both of which contain noncentrosymmetric active ions: W6+ and Mo6+. Their NLO coefficients are 16.8 times and 27 times that of KDP crystals, respectively. The large NLO responses of both crystals originate from the octahedron formed by d0 transition metal cations: WO6 and MO6 octahedrons, and it is confirmed from the literature that the distortion of Mo6+ ions is greater than that of W6+ ions,14 which leads to a stronger NLO response. Due to the small NLO coefficient of LiCs2PO42, some researchers have modified it via ion substitution, for example, by introducing NLO-active ions such as Hg2+ and Pb2+ ions and obtaining two new crystals: LiHgPO423 and LiPbPO4.26 The PbO8 polyhedra and the highly distorted HgO6 octahedron are the important sources of the SHG effect. The NLO coefficients were successfully enhanced, which are 11 times and 3 times that of KDP crystals, respectively.
KTP crystals have excellent NLO properties and have been a research hotspot in recent years. In order to further improve the NLO response and frequency doubling conversion efficiency of KTP crystals, we consider doping them with NLO-active ions. From the structural aspect, it can be inferred that Sb has multiple coordination modes and is able to form various polyhedra with high distortion and large anisotropy.27 However, single doping of NLO-active ions in KTP crystals can lead to difficulties in crystal growth,28 and the NLO performance of the crystals will not be improved.29 Therefore, we consider introducing the Ga element to balance charges, as Ga3+, Sb5+ and Ti4+ ions have extremely similar ionic radius and are prone to substitution. In this study, we chose the Sb5+ NLO-active ion with a d10 electronic configuration and Ga3+ ions for co-doping in a KTP crystal. Based on the analysis above, we successfully synthesized a series of KTP-type crystals Ga3+:Sb5+:KTP, explored their optical and NLO properties and analyzed the correlation between their structure and performance.
2. Experimental
2.1 Crystal growth
Ga3+ and Sb5+ co-doped KTP crystals with the composition of KTi1−2xGaxSbxOPO4 (x = 0.025 and 0.05) were grown through the top-seeded solution growth method. K2CO3, KH2PO4, TiO2, Ga2O3, and Sb2O5 with 99.9% purity were used as raw materials. The starting mixtures were placed in a platinum crucible with a diameter of 70 mm and a height of 90 mm. Then, the reagents were mixed evenly and heated to generate the flux (K6P4O13) and the solute (Ga3+:Sb5+:KTP). After the saturation temperature of the solution was measured by the seed crystal method, a KTP seed was introduced into the solution at about 1 °C above the saturation temperature for a period of time to dissolve the impurities on the seed surface. After this, the temperature of the solution decreased slowly to grow the crystal. The rotation rate was set to 30 rpm and the crystal growth period was about 40 days. After the growth period, the crystal was taken out of the solution and cooled to ambient temperature. The grown Ga3+:Sb5+:KTP crystals were processed into dimensions of 6 × 13 × 10 mm3 and 5 × 10 × 8 mm3, respectively.
2.2 Powder X-ray diffraction (PXRD)
The powder X-ray diffraction (RXPD) patterns were recorded using a Bruker-AXS D8 Advance X-ray diffractometer (Cu Kα = 1.5406 Å) produced by Bruker-AXS company in German. The measurement was accomplished at room temperature with an angle range of 2θ = 10–70° and a scan step of 0.02°.
2.3 Thermal stability
Thermogravimetric (TG) and differential thermal analysis (DTA) data were recorded using a NETZSCH STA8000 simultaneous analyzer in air. The heating rate was 10 °C min−1 in the test range of 30–1300 °C.
2.4 X-ray photoelectron spectroscopy
X-ray photoelectron spectroscopy (XPS) measurements of Ga3+:Sb5+:KTP crystals were performed using an ESCALAB 250 with Al Kα radiation and using C 1s (284.8 eV) as a reference to investigate the elemental composition and valence of samples.
2.5 Inductively coupled plasma atomic emission spectroscopy (ICP-AES)
The elemental contents of Ga3+:Sb5+:KTP crystals were analyzed using a PerkinElmer NEXION350X inductively coupled plasma atomic emission spectrometer (ICP-AES). Five different concentrations of 5 μg L−1, 10 μg L−1, 20 μg L−1, 50 μg L−1, and 100 μg L−1 calibration solution samples of Ga3+ and Sb5+ ions were used. The crystal powder samples were digested in sulfuric acid before the analysis.
2.6 UV-vis-NIR transmission spectroscopy
The room temperature optical transmittance spectra of Ga3+:Sb5+:KTP crystals were measured using an Agilent Cary 5000 UV-vis-NIR spectrophotometer in the wavelength range from 200 to 700 nm and a Thermo Nicolet NEXUS 670 FTIR spectrometer from 2500 to 6000 nm.
2.7 Second harmonic generation measurements
The power SHG responses of Ga3+:Sb5+:KTP were measured by means of the Kurtz–Perry method.30 The fundamental wavelength of 1064 nm was generated using a Q-switched Nd:YAG laser. The crystals were ground and sieved into distinct particle size ranges: 38–48, 48–75, 75–96, 96–150, 150–250 and 250–400 μm. To judge the strength of SHG, pure KTP crystals were also ground and sieved into the same particle size range and used as a reference. The SHG intensity of the Ga3+:Sb5+:KTP/KTP ratio was evaluated based on the same size (200–300 μm).
2.8 First-principles calculations
The electronic structure and optical properties of Ga3+:Sb5+:KTP and KTP crystals were calculated using CASTEP software through density functional theory (DFT).31 The generalized gradient approximation (GGA) PBE exchange-correction functional and norm-conserving pseudopotential are adopted. In order to simulate the doping system, we replaced a Ti atom with a doped Ga atom and Sb atom, with a doping concentration of 2%. The model was fully optimized using the BFGS method. The convergence thresholds for energy change and force were set to 10−5 eV and 0.01 eV Å−1, respectively. The energy cutoff values were set to 800 eV and 750 eV, respectively. A convergence threshold of 1 × 10⁻⁶ eV per atom was set for the self-consistent-field of the total electronic energy. The numerical integration of the Brillouin zones was performed using 1 × 1 × 1 and 1 × 2 × 1 Monkhorst–Pack k-point meshes, respectively. Norm-conserving pseudopotentials were used with the following valence electron configurations: K, 3s2 3p6; Ti, 3s2 3p6 3d2 4s2; O, 2s2 2p4; P, 3s2 3p3; Ga, 3s2 3p6 3d10; Sb, and 5s2 5p3.
3. Results and discussion
3.1 Crystal growth
The crystal phase for Ga3+:Sb5+:KTP crystals was detected using powder X-ray diffraction (PXRD). The results and crystal photographs are shown in Fig. 1. It is established that the PXRD patterns of the grown crystals match with those of pure KTP crystals very well, indicating that the grown crystals were pure-phase and the incorporation of Ga and Sb hardly changes the crystal phase of the original compound. However, by partially amplifying the PXRD spectrum, it can be observed that some peak positions show a slight shift toward a lower diffraction angle when Ga and Sb entering the crystal structure, indicating that the lattice parameters of these doped crystals have changed a bit.
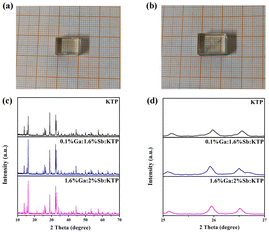 |
| | Fig. 1 Single crystal photographs of (a) 0.1% Ga:1.6% Sb:KTP and (b) 1.6% Ga:2% Sb:KTP. (c) Powder X-ray diffraction patterns of KTP and Ga3+:Sb5+:KTP crystals. (d) Enlarged section of the 2θ region from 25 to 27°. | |
3.2 Thermal stability
The thermal stabilities of pure KTP and Ga3+:Sb5+:KTP crystals were investigated through TGA and DTA. As shown in Fig. 2, it can be observed that all three crystals have only one endothermic peak, which represents the melting point of the crystals. With the increase of the doping concentration, the melting point of the crystal gradually increased from 1158 °C to 1162 °C, and there are also mass loss on the TG curves. The results show that the thermal stability of KTP crystals improved after doping with Ga3+ and Sb5+, and this phenomenon also occurs in the RTiOPO4 crystal.32
 |
| | Fig. 2 TG and DTA curves of the (a) pure KTP, (b) 0.1% Ga:1.6% Sb:KTP, and (c) 1.6% Ga:2% Sb:KTP crystals. | |
3.3 X-ray photoelectron spectroscopy
The electronic structures of Ga3+:Sb5+:KTP crystals were studied using X-ray photoelectron spectroscopy (XPS) measurements at 300 K. The XPS spectra of Ti 2p, K 2p P 2p and Sb 3d core levels are displayed in Fig. 3. The characteristic peaks of Ga elements cannot be accurately analyzed possibly due to excessive noise. The characteristic peaks of Sb 3d5/2 and Sb 3d3/2 were observed to be located at 532.4 and 539.8 eV, respectively, indicating that the valence of the doped Sb element is SbV.33 The binding energy of Ti 2p doublet peaks shows a shift to higher binding energy with the increase of the doping concentration in Ga3+:Sb5+:KTP crystals. To study the influence of Ga and Sb co-doping on the chemical bonding properties of KTP crystals, after obtaining the binding energy (BE) value of the representative levels, we use the parameter of binding energy difference: ΔBE (O–M) = BE (O 1s) − BE (M) to characterize the chemical bond properties of metal and oxygen in the compound, and M is a representative metal core-level. For Ga3+:Sb5+:KTP crystals, the calculated binding energy differences are shown in Table 1. The values of ΔBE (O–Ti) increase as the doping concentration increases, and the values of both ΔBE (O–P) and ΔBE (O–K) increase with the increase of Sb content. From the view of the strength of the bonds,34,35 we consider that in the case of a small amount of doping, the ionic strength of O–Ti bonds increased, and the covalent strength of O–P and O–K bonds also increased in Ga3+:Sb5+:KTP. It is worth noting that according to Fig. 3d and Fig. S1 (ESI†), the ratio of the peak area of oxygen vacancies to the peak area of O 1s before and after doping decreased from 8% to 6%, which proved that the oxygen vacancies in the Ga3+:Sb5+:KTP crystal decreased. It is attributable to the Sb5+ ions, in which extra electrons will neutralize the positive charges of the oxygen vacancy, resulting in the decrease of oxygen vacancies.
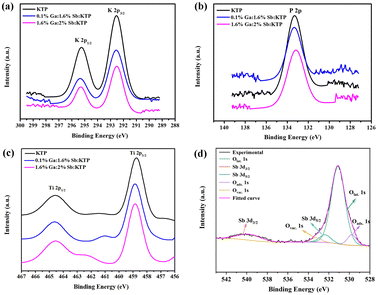 |
| | Fig. 3 High-resolution X-ray photoelectron spectra of Ga3+:Sb5+:KTP crystals: (a) K 2p core level, (b) P 2p core level, (c) Ti 2p core level, and (d) Sb 3d and O 1s core levels. | |
Table 1 Binding energy values (eV) of pure and Ga3+:Sb5+:KTP crystals
|
|
KTP |
0.1% Ga:1.6% Sb:KTP |
1.6% Ga:2% Sb:KTP |
| K 2p3/2 |
292.51 |
292.56 |
292.75 |
| Ti 2p3/2 |
458.74 |
458.85 |
458.84 |
| Ti 2p1/2 |
464.55 |
464.59 |
464.56 |
| P 2p |
133.27 |
133.3 |
133.1 |
| O 1s |
530.78 |
530.88 |
531.08 |
| ΔBE (O 1s–Ti 2p3/2) |
72.04 |
72.03 |
72.24 |
| ΔBE (O 1s–Ti 2p1/2) |
66.23 |
66.29 |
66.52 |
| ΔBE (O 1s–P 2p) |
397.51 |
397.58 |
397.98 |
| ΔBE (O 1s–K 2p3/2) |
238.27 |
238.32 |
238.33 |
3.4 Inductively coupled plasma atomic emission spectroscopy (ICP-AES)
To obtain the chemical composition of the Ga3+:Sb5+:KTP crystal, the concentrations of elements were measured through ICP-AES. Through calculations, the molecular compositions of the two crystals were found to be 0.1% Ga:1.6% Sb:KTP and 1.6% Ga:2% Sb:KTP, respectively.
3.5 UV-vis-IR transmission spectroscopy
The UV-vis-IR transmission spectra of KTP and Ga3+:Sb5+:KTP compounds were collected and are shown in Fig. 4. As can be seen, the ultraviolet absorption edges of KTP, 0.1% Ga:1.6% Sb:KTP and 1.6% Ga:2% Sb:KTP were at about 353 nm, 357 nm and 360 nm, respectively, which increase with the doping concentration. The infrared cutoff edge of crystals was all located near 4.4 μm with almost no change. Based on the transmission results, the absorption coefficient can be estimated according to the following equation:where α, T, d, h, ν and Eg represent the absorption coefficient, transmittance (%), crystal thickness, Planck constant, frequency and bandgap energy, respectively; A is a constant, and n is a constant that has a value of 1/2 for direct bandgaps and 2 for indirect bandgaps. Thus, we can plot a figure according to eqn (2). By drawing (αhν)1/n as the vertical axis and hv as the horizontal axis, we can obtain the bandgap values. The curves show that the bandgap values of KTP, 0.1% Ga:1.6% Sb:KTP and 1.6% Ga:2% Sb:KTP are about 3.53 eV, 3.49 eV and 3.45 eV, respectively. It is worth noting that the bandgap values are gradually reduced with the increase of Sb5+ and Ga3+. This phenomenon indicates that the doped Sb5+ and Ga3+ have changed the electronic structure of crystals to varying degrees. Nevertheless, the bandgap change caused by co-doping is relatively small, only reducing by 0.08 eV, which has significant advantages compared to single doped crystals.36
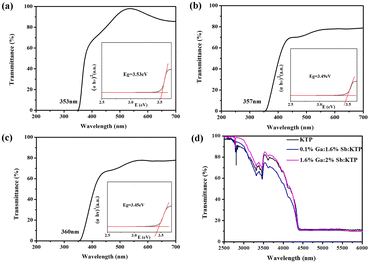 |
| | Fig. 4 UV-vis transmission spectra of crystals: (a) KTP crystal, (b) 0.1% Ga:1.6% Sb:KTP, and (c) 1.6% Ga:2% Sb:KTP. (d) Mid-IR transmission spectrum. | |
3.6 Second harmonic generation measurements
The optical SHG responses of Ga3+:Sb5+:KTP were measured by means of the Kurtz–Perry method.30 Pure KTP crystals were used as the reference. The measurement results indicated that Ga3+:Sb5+:KTP crystals exhibited a strong NLO response. It can be seen from Fig. 5a and b that when the doping concentrations were 0.1% Ga and 1.6% Sb, the SHG response is the highest, reaching 1.25 times that of KTP crystals. When the doping concentrations were 1.6% Ga and 2% Sb, the SHG response actually slightly decreased. In addition, it can be seen from Fig. 5a that the SHG intensity increases with the increase of the particle size, indicating that all the Ga3+:Sb5+:KTP crystals exhibit type I phase-matching behavior under 1064 nm laser irradiation. Furthermore, the SHG performance of bulk single crystals was also characterized. The frequency doubling conversion efficiencies from 1064 nm to 532 nm of bulk single crystals with different doping concentrations were obtained. The experimental configuration is shown in Fig. 5g. The base frequency source is a pulsed picosecond 1064 nm laser, the repetition frequency is 10 Hz, and the pulse width is 20 ps. The fundamental frequency laser spot is reduced by the diaphragm and incident perpendicular to the crystal, with a crystal thickness of 5 mm. The 1064 nm fundamental frequency laser passing through the frequency doubling crystal generated a 532 nm laser, leaving a portion of the 1064 nm laser that has not been doubled. This part of the 1064 nm laser was filtered out through the 1064 nm high reflection 532 nm high transmittance laser output mirror, leaving only 532 nm laser in the end. The output energy was measured using an energy detector. When the detector was located in position 1, the energy of the initial 1064 nm laser was measured; when the detector was located in position 2, the output energy of the 532 nm laser was measured. As shown in Fig. 5c, it can be seen that as the input energy increases, the conversion efficiency increases and eventually tends to be saturated. The maximum conversion efficiencies of KTP, 0.1% Ga:1.6% Sb:KTP and 1.6% Ga:2% Sb:KTP are 12%, 21.74% and 20.67%, respectively, which correspond to the results of powder frequency doubling. This improvement is greatly significant. The intensity of the output green laser can be seen from the crystal photographs; pure KTP has the weakest green laser and Ga3+:Sb5+:KTP has a strong green laser, which are consistent with the experimental data. The above results indicate that the co-doping of Ga and Sb ions does contribute to improving the NLO response of the crystal. However, while the concentration of the Sb5+ ion remains almost invariable, as the concentration of the Ga ion increased from 0.1% to 1.6%, the SHG response decreased a little. This phenomenon further indicates that only NLO-active ions can improve the NLO performance of crystals, and the introduction of the Ga ion will only play a role in balancing charges and does not improve the NLO performance of the crystal. In brief, the co-substitution of Ga3+ and Sb5+ successfully improved the NLO properties of traditional KTP crystals.
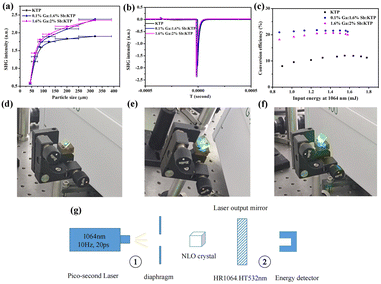 |
| | Fig. 5 NLO properties of Ga3+:Sb5+:KTP. (a) Phase-matching curves of KTP, 0.1% Ga:1.6% Sb:KTP and 1.6% Ga:2% Sb:KTP by powder SHG measurements at 1064 nm. (b) The oscilloscope traces of the SHG signals for the KTP, 0.1% Ga:1.6% Sb:KTP and 1.6% Ga:2% Sb:KTP at 1064 nm. (c) Frequency doubling conversion efficiencies from 1064 nm to 532 nm of KTP, 0.1% Ga:1.6% Sb:KTP and 1.6% Ga:2% Sb:KTP crystals. The green laser output of the bulk (d) KTP, (e) 0.1% Ga:1.6% Sb:KTP, and (f) 1.6% Ga:2% Sb:KTP crystals using a 1064 nm laser. (g) Schematic diagram of the frequency doubling experimental configuration. | |
3.7 Electronic structure analysis
In order to explore the correlation between the crystal structure and the performance, we calculated the electronic structures of pure KTP and Ga3+:Sb5+:KTP crystals based on first principles. Based on previous research on the heterovalent co-doping of RTP, which is isomorphic to KTP, we assume that doped ions occupy the Ti site for theoretical calculations.34,35 The band structure indicates that the pure KTP crystal has an indirect band gap of 3.335 eV, which is similar to the experimental result. The Ga3+:Sb5+:KTP crystal has an indirect band gap of 2.878 eV, which is slightly smaller than the experimental result. The GGA usually underestimates the band gap, which has been often observed in previous studies.6,37 The calculated total densities of states and partial densities of states (TDOS and PDOS) are plotted in Fig. 6b and d. The density of states (DOS) shows that, for pure KTP crystals, the bottom region of the valence band (VB) is composed of K 3p states, which is located at about −11 eV. The region of the VB from −8 eV to the Fermi level is mainly contributed by O 2p, with minor contribution from P 3p and Ti 3d orbitals. The bottom region of the conductive bands (CB) is mainly composed of Ti 3d and O 2p orbitals. The region of the CB from 8 eV to 13 eV is mainly contributed by K, P 3p, O 2p orbitals and minor contribution from Ti 3p orbitals. For Ga3+:Sb5+:KTP, the top of the VB was dominated by Ti 3d, Sb 5p, P 2p, and O 2p orbitals, and the bottom of the CB was dominated by Ti 3d and Sb 5s orbitals. The introduction of Sb ion orbitals near the Fermi energy level leads to the increase of electron activity at the bottom of the conduction band, which makes the movement of the conduction band larger than that of the valence band, resulting in the down-shift of the conduction band.
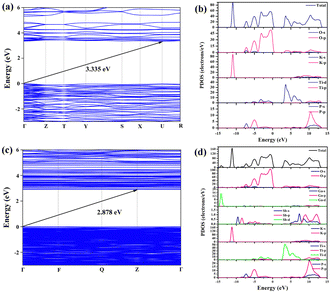 |
| | Fig. 6 Band structure and DOS of pure KTP and Ga3+:Sb5+:KTP. (a) Band structure of KTP. (b) DOS of KTP. (c) Band structure of Ga3+:Sb5+:KTP. (d) DOS of Ga3+:Sb5+:KTP. | |
Consequently, it can be understood that the introduction of Sb ions changes the densities of states near the bottom of the CB and the top of the VB in KTP, causing the bottom of the CB to move downwards and reduce the band gap. Since the optical properties of crystals mainly rely on the optical transitions between the electronic states near the bandgap, while the 3d orbitals introduced by Ga ions are located around −14 eV. Therefore, the Ga ions have a minimal effect on the densities of states and only play a role in balancing charges within the structure. The improved NLO properties of Ga3+:Sb5+:KTP mainly originate from the contribution of TiO6, PO4 and SbO6 groups. These results correspond to the calculated dipole moment (Table S1, ESI†), and the MO6 octahedron with the second-order Jahn Teller (SOJT) effect dominates the NLO response.
To observe the polarization degree of the bridged oxygen electronic structure of NLO-active units (SbO6, TiO6, and PO4 groups) in Ga3+:Sb5+:KTP crystals, the calculated electron-density difference (EDD) plots of the local structure are shown in Fig. 7. From the schematics of the local structure, it can be seen that the electron cloud distribution around Ga atoms is relatively uniform, while the electron cloud around Sb and Ti atoms tends to be far away from the O side, which has obvious polarity distribution characteristics. This polarity distribution is conductive to improve the microscopic second-order susceptibility of NLO-active units. According to the anionic group theory, the overall SHG coefficient of the crystal is the geometrical superposition of the microscopic second-order susceptibility tensors of the relevant ionic groups38 (SbO6, TiO6 and PO4 groups), and ultimately reflected in the significant increase of the SHG coefficient of the Ga3+:Sb5+:KTP crystals. And, according to the trend of theoretical calculation results, it can be predicted that if the concentration further increases, the NLO performance of the crystal will continue to improve.
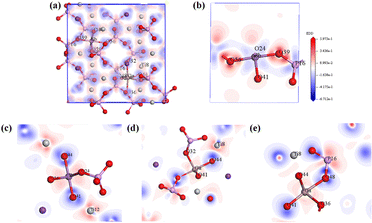 |
| | Fig. 7 Calculated electron-density difference (EDD) plots of the local structure: (a) total EDD of Ga3+:Sb5+:KTP, (b) Sb–O–P EDD, (c) Sb–O–Ti EDD, (d) Ga–O–Ti EDD, and (e) Ga–O–P EDD. | |
4. Conclusions
In summary, a series of co-doped Ga3+:Sb5+:KTP crystals with KTP structures were designed and prepared in this study. The transparent, high quality Ga3+:Sb5+:KTP single crystals were successfully grown using the top seed solution growth method. With an increase in the doping concentration, the UV cutoff edge shifted from 353 nm to 360 nm, and the optical bandgap decreased from 3.53 eV to 3.45 eV. The change in the bandgap is significantly reduced compared to that of single doped crystals, which is beneficial for maintaining their positive optical performance. The chemical bond properties of Ga3+:Sb5+:KTP crystals were studied by using binding energy difference between the metals and oxygen. The ionic strength of the O–Ti bonds increased, and the covalent strength of the O–P and O–K bonds also increased in the case of a small amount of doping. By comparing the proportion of peak areas of oxygen vacancies, it has been proved that the number of oxygen vacancies has decreased after co-doping. The frequency doubling conversion efficiency and NLO coefficient of Ga3+:Sb5+:KTP crystals have significantly improved compared to those of pure KTP crystals (1.25 times that of KTP crystals) at 1064 nm. Through DFT calculations, it has been confirmed that the improvement of NLO performance was due to the contribution of TiO6, SbO6 and PO4 groups. The contribution of Ga ions is almost negligible, only serving to balance charges. The NLO performance of KTP type crystals was significantly improved through co-doping without significantly changing the crystal bandgap. This provides a good strategy for the introduction of non-centrosymmetric active structural units to improve crystal performance and explore new NLO crystals.
Author contributions
The article was written through contributions from all authors. All authors have given approval to the final version of the article.
Conflicts of interest
There are no conflicts to declare.
Acknowledgements
The authors gratefully acknowledge financial support from the National Natural Science Foundation of China (Grant No. 51772171 and 51272130).
Notes and references
- A. Franken, A. E. Hill, C. W. Peters and G. Weinreich, Phys. Rev. Lett., 1961, 7, 118 CrossRef.
- L. Li, Y. Wang, B. H. Lei, S. J. Han, Z. H. Yang, K. R. Poeppelmeier and S. L. Pan, J. Am. Chem. Soc., 2016, 138, 9101–9104 CrossRef CAS PubMed.
- L. Li, Y. Wang, B. H. Lei, S. J. Han, Z. H. Yang, H. Y. Lia and S. L. Pan, J. Mater. Chem. C, 2017, 5, 269–274 RSC.
- S. W. Liu, B. B. Zhang, H. P. Wu, H. W. Yu, Z. G. Hu, J. Y. Wang and Y. C. Wu, Inorg. Chem. Front., 2021, 8, 2061–2067 RSC.
- W. F. Zhou and S. P. Guo, Acc. Chem. Res., 2024, 57, 648–660 CAS.
- H. W. Yu, J. S. Young, H. P. Wu, W. G. Zhang, J. M. Rondinelli and P. S. Halasyamani, Chem. Mater., 2017, 29, 1845–1855 CrossRef CAS.
- Z. Qian, H. P. Wu, H. W. Yu, Z. G. Hu, J. Y. Wang and Y. C. Wu, New J. Chem., 2020, 44, 6771–6777 RSC.
- L. Li, S. J. Han, B. H. Lei, Y. Wang, H. Y. Li, Z. H. Yanga and S. L. Pan, Dalton Trans., 2016, 45, 3936–3942 RSC.
- Y. F. Li, F. Liang, H. M. Song, W. Liu, Z. S. Lin, G. C. Zhang and Y. C. Wu, Solid State Sci., 2019, 91, 23–27 CrossRef CAS.
- T. Baiheti, H. Li, Z. H. Yang, S. J. Han, Y. Wang and S. L. Pan, J. Solid State Chem., 2018, 266, 150–154 CrossRef CAS.
- W. H. Liu, M. H. Lee, R. X. Guo and J. Y. Yao, Inorg. Chem., 2023, 62, 2480–2488 CrossRef CAS PubMed.
- F. F. Yuan, L. Hu, Z. Y. Bai, L. H. Liu, Y. S. Huang, L. Z. Zhang, D. S. Wei and Z. B. Lin, Inorg. Chem., 2021, 60, 8103–8110 CrossRef CAS.
- Y. Yang, Y. Qiu, P. F. Gong, L. Kang, G. M. Song, X. M. Liu, J. L. Sun and Z. S. Lin, Chem. – Eur. J., 2019, 25, 5648–5651 CrossRef CAS PubMed.
- P. S. Halasyamani, Chem. Mater., 2004, 16, 3586–3592 CrossRef CAS.
- T. Baiheti, S. Han, A. Tudi, Z. H. Yang and S. L. Pan, Chem. Mater., 2020, 32, 3297–3303 CrossRef CAS.
- T. Baiheti, S. J. Han, A. Tudi, Z. H. Yang and S. L. Pan, J. Mater. Chem. C, 2020, 8, 11441–11448 RSC.
- C. F. Sun, C. L. Hu, X. Xu, B. P. Yang and J. G. Mao, J. Am. Chem. Soc., 2011, 133, 5561–5572 CrossRef CAS.
- Z. Q. Li, Y. Chen, P. F. Zhu, N. J. Ji, X. L. Duan and H. D. Jiang, RSC Adv., 2017, 7, 53111–53116 RSC.
- J. K. Wang, B. K. Xiong, H. P. Wu, H. W. Yu, Z. G. Hu, J. Y. Wang and Y. C. Wu, Inorg. Chem. Front., 2021, 8, 344–351 RSC.
- K. C. Chen, C. S. Lin, G. Peng, Y. Chen, H. Z. Huang, E. Z. Chen, Y. X. Min, T. Yan, M. Luo and N. Ye, Chem. Mater., 2022, 34, 399–404 CrossRef CAS.
- H. W. Yu, W. G. Zhang, J. S. Young, J. M. Rondinelli and P. S. Halasyamani, J. Am. Chem. Soc., 2016, 138, 88–91 CrossRef CAS PubMed.
- S. H. Kim, J. Yeon and P. S. Halasyamani, Chem. Mater., 2009, 21, 5335–5342 CrossRef CAS.
- B. L. Wu, C. L. Hu, F. F. Mao, R. L. Tang and J. G. Mao, J. Am. Chem. Soc., 2019, 141, 10188–10192 CrossRef CAS PubMed.
- S. G. Zhao, J. H. Luo, P. Zhou, S. Q. Zhang, Z. H. Sun and M. C. Hong, RSC Adv., 2013, 3, 14000–14006 RSC.
- Y. L. Sun, G. X. Liu, Y. L. Lv, L. Ma, Y. L. Yao and R. L. Tang, J. Solid State Chem., 2023, 325, 124171 CrossRef CAS.
- G. P. Han, Q. Liu, Y. Wang, X. Su, Z. H. Yang and S. L. Pan, Phys. Chem. Chem. Phys., 2016, 18, 19123–19129 RSC.
- C. Hu, B. B. Zhang, B. H. Lei, S. L. Pan and Z. H. Yang, ACS Appl. Mater. Interfaces, 2018, 10, 26413–26421 CrossRef CAS PubMed.
- J. Y. Wang, Y. Y. Liu, J. Q. Wei, M. H. Jiang, Z. S. Shao, W. J. Liu and S. S. Jiang, Cryst. Res. Technol., 1997, 32, 319–327 CrossRef CAS.
- S. Sadhasivam, R. N. Perumal and P. Ramasamy, Spectrochim. Acta, Part A, 2015, 149, 183–189 CrossRef CAS PubMed.
- S. K. Kurtz and T. T. Perry, A Powder Technique for the Evaluation of Nonlinear Optical Materials, J. Appl. Phys., 1968, 39, 3798–3813 CrossRef CAS.
- S. J. Clark, M. D. Segall, C. J. Pickard, P. J. Hasnip, M. I. J. Probert, K. Refson and M. C. Payne, Z. Kristallogr.-Cryst. Mater., 2005, 220, 567–570 CrossRef CAS.
- J. J. Carvajal, J. Gavalda, J. Massons, F. Diaz and M. Aguilo, Chem. Mater., 2003, 15, 2730–2736 CrossRef CAS.
- F. Garbassi, Surf. Interface Anal., 1980, 2, 165–169 CrossRef CAS.
- J. Liu, Z. Q. Li, P. F. Zhu and X. L. Duan, Opt. Mater., 2018, 75, 38–43 CrossRef CAS.
- Z. Q. Li, P. F. Zhu, J. M. Ding, N. J. Ji, Y. Chen, Z. Y. Wang, X. L. Duan and H. D. Jiang, Cryst. Growth Des., 2019, 19, 7143–7152 CrossRef CAS.
- P. F. Zhu, Z. Q. Li, Z. Y. Wang, L. Ai, J. F. Zhao, C. Li, X. L. Duan, X. Zhao and F. P. Yu, Adv. Opt. Mater., 2022, 10, 2201643 CrossRef CAS.
- H. N. Liu, H. P. Wu, H. W. Yu, Z. G. Hu, J. Y. Wang and Y. C. Wu, J. Mater. Chem. C, 2021, 9, 15321–15328 RSC.
- C. T. Chen, Y. C. Wu and R. K. Li, Int. Rev. Phys. Chem., 1989, 8, 65–91 Search PubMed.
|
| This journal is © The Royal Society of Chemistry 2024 |
Click here to see how this site uses Cookies. View our privacy policy here.  Open Access Article
 *a,
Bingbing
Zhang
 *b and
Jiyang
Wang
a


