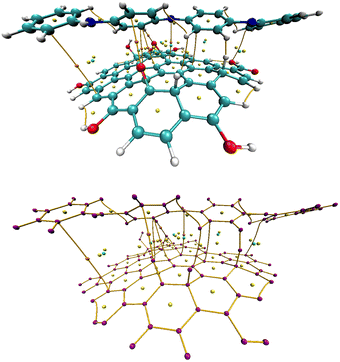
 Open Access Article
Comprehensive investigation of multifunctional polyaniline/reduced graphene oxide nanocomposites synthesized from deep eutectic solvents: experimental, RSM, ANN and computational studies†
Abir
Boublia‡
 a,
Zahir
Guezzout
b,
Nacerddine
Haddaoui
a,
Michael
Badawi
a,
Zahir
Guezzout
b,
Nacerddine
Haddaoui
a,
Michael
Badawi
 c,
Imane
Lakikza
d,
Ilyas
Belkhettab
e,
Ouahiba
Moumeni
f,
Saoussen Imene
Aouni
d,
Manawwer
Alam
 g and
Yacine
Benguerba
 *h
*h
aLaboratoire de Physico-Chimie des Hauts Polymères (LPCHP), Département de Génie des Procédés, Faculté de Technologie, Université Ferhat ABBAS Sétif-1, 19000, Sétif, Algeria. E-mail: abir.boublia@univ-setif.dz; n_haddaoui@yahoo.com
bUnité de Recherche sur les Matériaux Emergents –Sétif- URMES, Equipe de Valorisation Des Polymères, Université Ferhat ABBAS Sétif-1, 19000, Sétif, Algeria. E-mail: z.guezzout@univ-setif.dz
cUniversité de Lorraine, CNRS, L2CM, F-57000 Metz, France. E-mail: michael.badawi@univ-lorraine.fr
dLaboratory of physics for matter and radiation, Mohamed Cherif Messadia-souk Ahras University, PO Box 1553, SoukAhras 41000, Algeria. E-mail: lakikza.imane96@gmail.com; sawsenaouni18@gmail.com
eLaboratory of Electrochemistry-Corrosion, Metallurgy and Inorganic Chemistry, Faculty of Chemistry, USTHB, BP 32 El-Alia, 16111 Algiers, Algeria. E-mail: ilyasbelkhettab@gmail.com
fLaboratoire d’Electrochimie des Matériaux Moléculaires et Complexes (LEMMC), Département de Génie des Procédés, Faculté de Technologie, Université Ferhat Abbas Setif-1, El-Maabouda, 19000, Sétif, Algeria. E-mail: ouahibamoumeni_wah@yahoo.fr
gDepartment of Chemistry, College of Science, King Saud University, PO Box 2455, Riyadh 11451, Saudi Arabia. E-mail: maalam@ksu.edu.sa
hLaboratoire de Biopharmacie Et Pharmacotechnie (LPBT), Ferhat Abbas Sétif 1 University, 19000, Sétif, Algeria. E-mail: yacinebenguerba@univ-setif.dz
First published on 22nd August 2024
Abstract
This work reports a comprehensive investigation into the synthesis, modeling, and characterization of multifunctional polyaniline/reduced graphene oxide (PANI/rGO) nanocomposites, with a focus on their synthesis using deep eutectic solvents (DES). Leveraging an in situ chemical polymerization method, PANI/rGO nanocomposites were successfully synthesized, introducing a novel approach employing DES as the electrolyte. The study utilized response surface methodology (RSM), artificial neural networks (ANN), and molecular simulation techniques to model, optimize, and characterize the nanocomposites comprehensively. RSM analysis disclosed the impact of APS/ANI molar ratio, rGO loading, and polymerization time on electrical conductivity, with optimal conditions identified: APS/ANI molar ratio of 0.75, 3 wt% rGO loading, and a 6-hour polymerization time, yielding a high electrical conductivity of 4.975 × 10⁻³ S cm−1. Integration of ANN techniques enhanced predictive accuracy, reaching an electrical conductivity of 4.988 × 10⁻³ S cm−1, surpassing RSM. Characterization techniques including UV-vis, PL, Raman, FTIR, and XRD highlighted structural changes, while XPS analysis revealed intensified C–N peaks in PANI/rGO, indicating a denser nanocomposite coating. Electrochemical studies showcased superior capacitance at 145.79 F g−1, surpassing individual components, and TGA analysis revealed enhanced thermal stability. Molecular-level insights provided a nuanced understanding of the PANI–rGO system through FMO, COSMO-RS, NCI, and QTAIM analyses. The study not only presents an innovative synthesis method but also positions PANI/rGO nanocomposites as promising materials for supercapacitors and gas sensors, offering potential for advancements in green chemistry and eco-friendly innovations.
1. Introduction
Polyaniline (PANI) has been a subject of extensive investigation due to its noteworthy characteristics, drawing significant interest for possible use in electronic devices such as batteries, capacitors, and sensor materials. Its outstanding conductivity and adaptable features position it as a compelling choice for advancing modern electronic technologies.1–3 Notably, the combination of PANI with carbonaceous elements in nanocomposites has surfaced as an attractive tactic for crafting sophisticated materials, capitalizing on their mutually beneficial attributes. PANI is distinguished by its outstanding electrical conductivity, elevated pseudocapacitance, and robust resilience against environmental degradation.4,5 Simultaneously, carbonaceous materials, encompassing graphene, carbon nanotubes, and carbon black, are recognized for their remarkable mechanical strength, extensive surface area, and excellent electrical conductivity. Researchers have significantly enhanced electrochemical performance through this combination, making these materials well-suited for diverse applications.6,7 Among carbon-based materials, graphene distinguishes itself with exceptional electrical, thermal, and mechanical characteristics.8,9 Its low density,10 remarkable specific surface area,11 and robust electron mobility12 position it as an ideal substrate for embedding active polymers in nanocomposites.13 Since its groundbreaking discovery in 2004 by Geim and Novoselov,14 researchers have extensively investigated the integration of graphene as a nanofiller into PANI for the development of versatile nanocomposites. The synergistic interplay between these components has resulted in significant enhancements in their thermal, electrical, mechanical, optical, and electrochemical properties when compared to either pristine PANI or standalone graphene.13,15 Nevertheless, graphene faces challenges like insolubility in aqueous environments and a tendency to agglomerate due to van der Waals interactions between its sheets. In response to these challenges, derivatives of graphene, particularly reduced graphene oxide (rGO), have emerged as promising nanofillers for polymer nanocomposites.16–18 Extensive research have been directed towards enhancing the electrical characteristics of PANI/rGO.19,20 Consequently, the heightened electrical conductivity and supercapacitance observed in PANI/rGO nanocomposites have facilitated their utilization across diverse fields, including various electronic applications,21 supercapacitors,19 energy storage,22 sensing systems and detectors,23,24 fuel-cell systems,25 and numerous other domains.The synthesis of PANI/rGO nanocomposites conventionally relies on several methods. Electrochemical polymerization involves depositing PANI onto a GO-coated electrode, allowing precise control over thickness and morphology, but is limited to coating applications.26 Interfacial polymerization polymerizes aniline at the interface of two immiscible liquids, producing high surface area composites but often resulting in heterogeneous and less uniform properties.27In situ chemical oxidative polymerization is the most commonly used method due to its efficiency. It polymerizes aniline in the presence of GO, which reduces to rGO during the process, ensuring good interaction between PANI and rGO and resulting in improved conductivity and mechanical properties.28,29 However, achieving higher electrical conductivity requires meticulous optimization of various parameters.30 These encompass critical factors such as GO filler loading, the oxidant-to-monomer ratio, the nature and concentration of dopant acids, reaction temperature, monomer purity, and polymerization time.31,32 The traditional approach to optimization, involving the alteration of one parameter at a time, is time-intensive and resource-draining. Conducting numerous experiments, each adjusting a single factor while keeping others constant, consumes considerable time and energy resources. To overcome these limitations, a more efficient approach involves the collective optimization of all pertinent parameters. This is accomplished through an empirical design based on statistical methodologies, illustrated by the implementation of response surface methodology (RSM).33,34 RSM, combining mathematical and statistical methods, plays a significant role in process modeling and optimization studies.35 It discerns the impact of independent variables, either in isolation or combination, on the synthesis processes. An inherent strength of RSM lies in its capacity to reduce the number of experiments needed for an in-depth statistical analysis, especially in scenarios involving numerous factors. This modeling approach utilizes polynomials to locally approximate, resulting in the derivation of a mathematical expression that succinctly expresses the complex interplay between the response and the independent variables.34
Within the realm of RSM, the Box–Behnken design (BBD) offers significant advantages over the central composite design (CCD) by reducing the number of experimental runs and avoiding extreme factor levels, thus saving valuable time and resources while preventing potentially unsatisfactory or unstable results. Conversely, CCD provides better accuracy for quadratic surface fitting due to its inclusion of axial points but requires more resources and involves extreme conditions, which may not always be practical. Therefore, BBD is more advantageous for preliminary optimization, while CCD is suited for detailed studies.34,36,37
Additionally, artificial neural networks (ANN) function as a versatile modeling tool capable of addressing both linear and nonlinear multivariate regression problems across diverse processes, including synthesis and nanocomposite fabrication.34 Inspired by the biological brain, an ANN begins with the creation of a neural network comprising multiple layers, each housing a defined number of artificial neurons. Each neuron is characterized by a weight and an activation function, where the weights represent the connections between neurons and the activation function mimics the neuron's response. The weight is a crucial parameter that represents the connection between neurons and is optimized during the backpropagation process. Initially, the input data, described by descriptors encapsulating the essential characteristics of the input data, is processed. These descriptors are then multiplied by the corresponding weights and passed through an activation function, effectively initiating a feedforward operation within the network. During the ANN's training phase, the network iteratively adjusts its weights through a procedure known as backpropagation, guided by the minimization of the mean square error between the network's predicted output and the actual experimental data. This optimization process is critical for the model to learn the underlying relationships and features within the data effectively. The final steps of ANN modeling involve validating and testing datasets, which are crucial for assessing network performance.38,39 While ANNs can be computationally expensive and require substantial data and time for training, these limitations can be mitigated through several strategies. Data preprocessing and augmentation, efficient network architectures, advanced optimization algorithms, parallel and distributed computing, and hybrid approaches—such as clustering strategies and combining traditional machine learning techniques with ANNs—can significantly enhance efficiency and performance.40 These methods ensure that the powerful capabilities of ANNs can be harnessed effectively, even within resource-constrained environments.
Moving beyond experimental design investigations, molecular simulations have become instrumental in guiding researchers in synthesizing intricate materials and understanding mechanisms at the electronic scale. Despite significant efforts to uncover interaction mechanisms with diverse materials, there's an increasing demand for a unified framework that integrates in situ nanoscale research, molecular modeling, and their macroscopic implications. Widely embraced computational chemistry techniques, notably density functional theory (DFT), is predominantly applied to predict the electronic structure and ground-state geometries of materials. DFT calculations provide a quantum mechanical description of the electronic distribution within materials, which is fundamental for the understanding of their intrinsic properties. On the other hand, molecular dynamics (MD) simulations are typically employed for simulating the behavior of large systems under real-world conditions, such as varying temperatures and pressures. MD simulations animate the movements of atoms and molecules over time, providing dynamic insights into material behaviors in conditions that closely mimic operational environments.41,42 These methods, considering certain electron correlation effects at a computationally feasible expense, lay the groundwork for comprehending various chemical processes.43 Their application in calculating nanocomposite characteristics and interactions with filler materials offers valuable insights into the chemical attributes of these complexes.44
A thorough literature review was conducted to pinpoint the key factors influencing the electrical conductivity of PANI/rGO. The investigation revealed that the electrical conductivity of PANI experiences an increase with a higher oxidant molar ratio. Such enhancement in conductivity is attributed to a rise in the density of cation radicals and the extension of PANI chain length. These factors facilitate an enhanced interchain transfer, thereby increasing the carrier mobility.45 Nevertheless, concentrations of oxidant exceeding 0.5 M resulted in phenazine production, causing a reduction in electrical conductivity.46,47 Moreover, studies demonstrated an initial increase in PANI conductivity with an aniline amount of up to 0.15 M, followed by a decrease with further additions of aniline.48 The investigation of the oxidant-to-aniline ratio indicated that an optimal PANI conductivity and yield were achieved with a ratio close to 1. Higher ratios, however, led to over-oxidation, resulting in a decrease in both conductivity and yield.49 Diverse dopants were explored for their impact on electrical conductivity, showing a positive correlation between dopant concentration and PANI's conductivity.50 Although, an increase in the dopant/aniline ratio resulted in a notable decline in PANI conductivity, emphasizing the influence of intramolecular mobility of charged species along the chain on electrical conductivity, surpassing the impact of intermolecular hopping within crystalline regions.51–53 At extremely elevated dopant concentrations, a substantial decline in conductivity was accomplished through concurrent reductions in doping levels and crystallinity.54 Evaluation of PANI/rGO nanocomposites across different temperatures and rGO loadings demonstrated enhanced conductivity as temperature rises, linked to thermally-assisted charge carrier hopping in disordered materials.45–48,50,54,55 The integration of rGO into the PANI matrix notably enhanced the conductivity of the nanocomposite. This improvement can be attributed to synergistic interactions between the PANI and rGO phases, involving charge transfer among delocalized P-orbitals.56 The duration and temperature of the synthesis process played a crucial role in determining the size and structure of PANI/rGO nanocomposites, directly influencing their electrical conductivity. Extended synthesis times and lower temperatures yielded larger and well-defined PANI/rGO systems with enhanced electrical conductivity. Previous studies emphasized that the yield and electrical conductivity remain unaffected by the polymerization temperature when maintained below 0 °C.54,57 Conversely, elevated temperatures were found to induce more defects, resulting in diminished conductivity.51 Consequently, a polymerization temperature of approximately 0 °C was considered optimal for the synthesis of PANI/rGO.
In light of the reviewed literature, despite numerous studies on PANI synthesis, a specific optimization of PANI/rGO conductivity using RSM techniques, particularly in scenarios involving the nanoscale, taking into account the interactions and synthesis factors at play, remains unexplored. This study addresses this gap by identifying key factors influencing PANI electrical conductivity, including rGO loading, oxidant-to-monomer molar ratio, and polymerization time. Notably, PANI/rGO was synthesized via in situ polymerization in a choline chloride/triethylene glycol-based deep eutectic solvent (DES) acting as an electrolyte. Employing BBD-RSM and ANN methodologies, we systematically assessed various nanocomposite synthesis conditions, analyzing the intricate relationship between electrical conductivity and these factors. Beyond optimization, we conducted a comprehensive analysis of the synthesized nanocomposites using Ultraviolet-visible spectroscopy (UV-vis), photoluminescence spectroscopy (PL), Raman spectroscopy, Fourier-transform infrared spectroscopy (FTIR), X-ray diffraction (XRD), X-ray photoelectron spectroscopy (XPS), cyclic voltammetry (CV), and thermogravimetric (TGA) analyses, exploring their structural, optical, and electrochemical properties. Significantly, our tailored computational models for PANI and rGO align with experimental data, enhancing the credibility of our findings. Theoretical analyses, including Frontier molecular orbital (FMO), conductor like screening model for real solvents (COSMO-RS), non-covalent interaction (NCI) based on the reduced density gradient (RDG), and quantum theory of atoms in molecules (QTAIM) deepen our understanding of bonding interactions, providing insights for potential applications in nanocomposite technology. The rationale behind using DES in this study is multi-faceted. First, DES enhances the solubility of reactants, providing a stable medium for in situ polymerization, which leads to a more uniform dispersion of rGO within the PANI matrix. DES components, TEG (hydrogen bond donor) and choline chloride (hydrogen bond acceptor), play crucial roles in this process. TEG helps disperse rGO, preventing agglomeration, while choline chloride facilitates the polymerization process and stabilizes the formed nanocomposite. This combination ensures better integration of rGO with PANI, resulting in improved electrical conductivity and mechanical properties of the final composite. Moreover, the use of DES is more environmentally friendly and scalable, making it suitable for industrial applications. This study presents a novel and superior method for synthesizing PANI/rGO nanocomposites, addressing gaps in existing literature and offering a comprehensive optimization strategy for enhanced electrical conductivity.
2. Material and methods
2.1. Materials
Choline chloride (ChCl) ([(CH3)3NCH2CH2OH]+Cl−, Sigma-Aldrich, 99%), tetraethylene glycol (TEG) (HO(CH2CH2O)3CH2CH2OH, Aldrich, 99%), natural graphite powder was consummated by using graphite as a powder with particle size of the order of 10 μm. Sulfuric acid (H2SO4, Aldrich, 98%), sodium nitrate (NaNO3, Aldrich, 99%), hydrogen peroxide (H2O2, Aldrich, 30%), hydrazine monohydrate (N2H4, Sigma-Aldrich, >99%), aniline monomer (ANI)(C6H5NH2, Sigma-Aldrich, ≥99.5%), ammonium persulfate (APS) ((NH4)2S2O8, Sigma-Aldrich, 98%) was utilized as an oxidant and hydrochloric acid (HCl, Fisher chemical, 37%). All materials were employed in their as-received state, and aniline was saved under refrigeration at 4 °C when not in use.2.2. Sample preparation
Three different DES formulations were prepared by combining ChCl with TEG in varying molar ratios (1![[thin space (1/6-em)]](https://www.rsc.org/images/entities/char_2009.gif) :
:![[thin space (1/6-em)]](https://www.rsc.org/images/entities/char_2009.gif) 1, 1
1, 1![[thin space (1/6-em)]](https://www.rsc.org/images/entities/char_2009.gif) :
:![[thin space (1/6-em)]](https://www.rsc.org/images/entities/char_2009.gif) 2, and 1
2, and 1![[thin space (1/6-em)]](https://www.rsc.org/images/entities/char_2009.gif) :
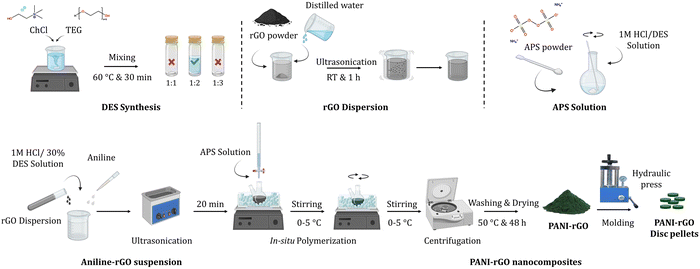
:![[thin space (1/6-em)]](https://www.rsc.org/images/entities/char_2009.gif) 3). The mixtures were heated at 60 °C with continuous stirring. After 30 minutes, the resulting DESs became a homogeneous colorless liquid. Fig. 1 provides a schematic representation of the DES preparation process. Only the DES with a 1
3). The mixtures were heated at 60 °C with continuous stirring. After 30 minutes, the resulting DESs became a homogeneous colorless liquid. Fig. 1 provides a schematic representation of the DES preparation process. Only the DES with a 1![[thin space (1/6-em)]](https://www.rsc.org/images/entities/char_2009.gif) :
:![[thin space (1/6-em)]](https://www.rsc.org/images/entities/char_2009.gif) 2 molar ratio exhibited stability and was selected for further experimentation. The preparation of GO is followed our prior work58,59 and for the reduction of GO to rGO, a hydrazine chemical reduction method was then employed.
2 molar ratio exhibited stability and was selected for further experimentation. The preparation of GO is followed our prior work58,59 and for the reduction of GO to rGO, a hydrazine chemical reduction method was then employed.
The synthesis of PANI/rGO nanocomposites was carried out according to previously established procedures.60,61 Initially, a dispersion of rGO was prepared by weighing the appropriate amount, adding distilled water, and subjecting it to ultrasonication for 1 hour. Simultaneously, an APS solution was prepared by dissolving it in a fresh 1 M HCl/30% DES solution. The DES concentration is crucial to retain its properties and ensure that the synthesis of the composites is facilitated by the DES serving as an electrolyte,62 rather than the individual effects of TEG and ChCl in solution. The synthesis of PANI/rGO commenced with the dissolution of pure aniline and rGO in the 1 M HCl/30% DES solution, forming an aniline-rGO suspension. This suspension was ultrasonicated for 20 minutes and then placed in an iced bath, maintaining a temperature range of 0–5 °C while being mechanically stirred (as depicted in Fig. 1). The APS solution was carefully added drop by drop to the aniline-rGO suspension in a two-step process to prevent excessive temperature elevation. The oxidant-to-aniline ratio was meticulously controlled throughout the synthesis. Approximately 20–30 minutes after the initial addition of the oxidant, the solution's color transitioned from blackish-blue to progressively greener, indicating the progression of the reaction. The resultant nanocomposites and pure PANI were separated by centrifugation, thoroughly washed with 1 M HCl, fresh distilled water, and acetone, and subsequently dried in an oven at 50 °C for 48 hours. Details regarding the polymerization time, the aniline-to-rGO ratio, and the aniline-to-APS ratio are provided in the experimental design strategy outlined below.
2.3. Experimental design by response surface methodology
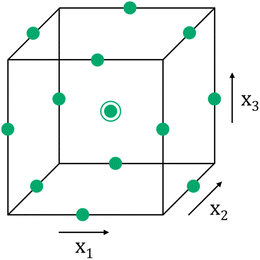
Data analysis investigation is a valuable tool for uncovering concealed insights and constructing predictive models. The RSM, initially introduced by Box and Wilson,35 stands out as a robust approach for scrutinizing interactive influences within a system and for optimizing its performance. RSM typically employs specific experimental designs, with the most commonly employed ones being the Box–Behnken design (BBD) and the central composite design (CCD).35 In the context of this study, we employed the BBD design to explore the impact of variables such as molar ratio of APS/ANI, rGO loading, and polymerization time on the electrical conductivity of PANI/rGO-based nanocomposites. Within the BBD framework, each factor is systematically assigned one of three equidistant values. The experimental conditions are represented by points positioned at the midpoint of the edges in the experimental space, which can be visualized as a cube, as well as at the center (as depicted in Fig. 2).The total number of experiments, N, the variables under consideration, k, and the central points, C0, can be calculated using the following eqn (1):
| N = 2k (k − 1) + C0 | (1) |
Table 1 provides an overview of the experimental design using the BBD model. This design incorporates three factors, each with three levels, and we have included both actual and coded values for better understanding. The three optimized independent variables are APS/ANI ratio (X1), rGO loading (X2), and polymerization time (X3). For each independent variable, we employed a horizontal encoding scheme, which assigns three values: −1, 0, and +1, facilitating a systematic exploration of the experimental space. The actual ranges for these variables are: APS/ANI ratio (X1) from 0.25 to 0.75, rGO loading (X2) from 1 to 5 wt%, and polymerization time (X3) from 2 to 6 hours. The selected range of rGO loadings (1, 3, and 5 wt%) was based on a combination of literature evidence and systematic pilot experimentation. Literature suggests that rGO loadings within this range effectively enhance the electrical and mechanical properties of PANI/rGO nanocomposites. Pilot experiments conducted with rGO loadings below 1 wt% showed minimal improvements in properties, while loadings above 5 wt% led to processing difficulties due to increased viscosity and rGO aggregation. Therefore, the chosen range optimally enhances the properties of PANI/rGO nanocomposites while maintaining good processability.26,63–65
| Factors | Coded | Levels | ||
|---|---|---|---|---|
| −1 | 0 | 1 | ||
| Molar ratio of APS/ANI | X 1 | 0.25 | 0.5 | 0.75 |
| rGO loading (wt%) | X 2 | 1 | 3 | 5 |
| Time (h) | X 3 | 2 | 4 | 6 |
The relationship and interactions between the independent variables and the response factors were thoroughly investigated using a second-order polynomial equation (eqn (2)):
 | (2) |
Here, y represents the predicted value of the response, β0 is the offset term, j, ij, and jj correspond to the linear coefficients, the cross-product coefficients, and the quadratic coefficients, respectively. Xi and Xj are the independent factors. To carry out this analysis, we employed JMP SAS Pro® 16 software. This robust software facilitated the evaluation of experimental data and the execution of analysis of variance (ANOVA) to ascertain the model's fitting accuracy. This statistical analysis is essential for understanding the impact and significance of the independent variables on our response factors.
2.4. Artificial neural network
Artificial neural networks (ANNs) are computational frameworks inspired by the structure of the biological nervous system. They include diverse architectures such as feedforward networks, radial basis function networks, and fuzzy networks.38,39 As demonstrated via Hornik et al.,66 multilayered feedforward networks, even with just one hidden layer, possess the capability to accurately approximate any function from n dimensions to m dimensions. In recent years, ANNs have revolutionized engineering by offering unparalleled predictive and estimation capabilities, surpassing conventional modeling approaches like RSM concerning predictive precision.67,68 In the present study, we harnessed the power of ANNs to predict the intricate, non-linear relationship between our input parameters (X1, X2, and X3) and the response variable (y), utilizing an experimental dataset derived from the BBD design. Our network architecture was meticulously constructed using JMP SAS Pro® 16 software (SAS Institute, Cary, NC), ensuring the efficacy of the feed-forward ANN. The configuration of the neural network holds a pivotal role in shaping the ANN model's capacity for generalization. It essentially comprises three key layers: input, hidden, and output, with each layer accommodating an array of neurons. The quantity of neurons in the input and output layers directly corresponds to the count of input and output variables. Consequently, we evaluated eight different ANN architectures, each equipped with a single hidden layer containing varying neuron counts ranging from 3 to 24. To ensure the model's robustness and reliability, we divided our datasets into training and testing subsets, following an 80%![[thin space (1/6-em)]](https://www.rsc.org/images/entities/char_2009.gif) :
:![[thin space (1/6-em)]](https://www.rsc.org/images/entities/char_2009.gif) 20% ratio. This strategy allowed us to systematically explore various ANN architectures, ultimately selecting the optimal setup based on superior performance with the testing dataset. The equations within the ANN model incorporate various parameters that elucidate the neural network's behavior. These parameters encompass the weights (Wm) connecting neurons, the inputs (x) to specific neurons (n), considerations of the hidden layer (l), and the biases (b) associated with each neuron. Additionally, we incorporated the hyperbolic tangent (tan
20% ratio. This strategy allowed us to systematically explore various ANN architectures, ultimately selecting the optimal setup based on superior performance with the testing dataset. The equations within the ANN model incorporate various parameters that elucidate the neural network's behavior. These parameters encompass the weights (Wm) connecting neurons, the inputs (x) to specific neurons (n), considerations of the hidden layer (l), and the biases (b) associated with each neuron. Additionally, we incorporated the hyperbolic tangent (tan![[thin space (1/6-em)]](https://www.rsc.org/images/entities/char_2009.gif) h) function into the expressions, effectively confining the output of each neuron to the variety of [−1, 1]. This interval signifies the extent of activation or deactivation, ensuring meticulous control over the network's dynamics and results. The mathematical representation of the output of neuron (j) arises from the synergistic interplay of these parameters:
h) function into the expressions, effectively confining the output of each neuron to the variety of [−1, 1]. This interval signifies the extent of activation or deactivation, ensuring meticulous control over the network's dynamics and results. The mathematical representation of the output of neuron (j) arises from the synergistic interplay of these parameters: | (3) |
To assess the effectiveness of both ANN and RSM models, performance metrics including root mean square error (RMSE), coefficient of determination (R2), average absolute relative deviation (AARD), and mean absolute error (MAE) were applied where their expressions are shown in eqn (4)–(7), respectively. Where σexp, σpred, and ![[small sigma, Greek, macron]](https://www.rsc.org/images/entities/i_char_e0d2.gif) indicate the experimental, predicted, and average values, while p denotes the total count of experimental data points.
indicate the experimental, predicted, and average values, while p denotes the total count of experimental data points.
 | (4) |
 | (5) |
 | (6) |
 | (7) |
2.5. Characterization and morphology
The Ultraviolet-visible (UV-vis) were recorded with V-650 JASCO spectrophotometer equipped with an integrating sphere. The photoluminescence (PL) investigation was carried out on the spectrofluorometer HORIBA FL3-DFX-iHR320 model. Raman was recorded with an invia microscope spectrometer (RENISHAW). Fourier-transform infrared (FTIR) spectroscopy was analyzed by the V-650 JASCO spectrophotometer equipped with an integrating sphere. X-ray diffraction (XRD) analysis was performed with Cu Ka X-ray sources on a D/Max-2400 powder diffractometer (Japanese Physical Company). The surface analysis of the synthesized materials was examined through means of an X-ray Photoelectron Spectroscopy (XPS) (Escalab THERMO SCIENTIFIC).Cyclic voltammetry (CV) experiments were performed utilizing a Volta Lab PGZ 301 apparatus with Volta Master 40 software, employing a standard three-electrode configuration. The setup comprised a counter electrode made of platinum, a reference electrode of Ag/AgCl, and a working electrode made of platinum with modifications. A solution of 0.1 M lithium perchlorate (LiClO4) in dimethylformamide (DMF) served as the electrolyte support in the analytical protocol. The electrochemical performances of PANI/rGO nanocomposites were explored through CV within a potential window with a range of −0.8 V to 1.6 V.
Thermal stability study of the PANI/rGO nanocomposites were conducted under nitrogen atmosphere (N2) at room temperature up to 1000 °C with a heating rate of 10 °C minutes through thermogravimetric (TGA) analysis.
2.6. Electrical conductivity measurements
The four-point probe method was employed to assess the electrical conductivity of pure PANI, rGO, and PANI/rGO nanocomposites. Digital micrometers were used to determine the thickness of the samples, which were shaped into discs with a diameter of approximately 12 mm. The electrical measurements were performed using a Keithley 195 current source and a Keithley 197 electrometer, both computer-controlled. For these measurements, the disc pellet samples were placed on an insulated test bed, connected to a PRF-912 probe model. This test was primarily focused on quantifying the sample's surface resistance. The reciprocal of resistivity (ρ) determined the electrical conductivity (σ) of the disc pellet samples, as expressed in eqn (8): | (8) |
2.7. Computational methodology
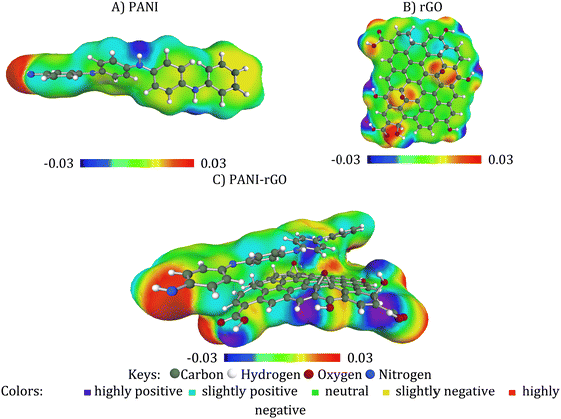
This study involved comprehensive calculations concerning geometric parameters, internal energies, and electronic properties of the nanocomposite. Initially, we utilized the Material Studio software69,70 to perform MD simulations aimed at assessing the interaction energy between the PANI molecule and rGO sheet. The initial simulation box was constructed by placing the rGO sheet alongside the PANI molecule to investigate the inherent interactions between these components. Accordingly, the box's geometry was optimized to relax the entire molecular system. Subsequently, the box underwent NVT dynamics for approximately 2000 picoseconds, utilizing a 1 femtosecond time step at a temperature of 298 kelvin. These simulations employed the COMPASS forcefield.71 After the NVT dynamics, a second MD simulation was conducted using the NPT thermodynamic ensemble for 20![[thin space (1/6-em)]](https://www.rsc.org/images/entities/char_2009.gif) 000 picoseconds, also with a 1 femtosecond time step at 298 kelvin. The outcome of this simulation led to another round of geometric optimization.70,72 Energies were calculated for approximately of a hundred resulting conformations or more. Among these conformations, the one with the lowest energy was selected as the model for subsequent analysis. The selected model was further optimized via the DFT M06-2X functional70,73–77 and the TZVP basis set,78–80 and this optimization was carried out with the Turbomole software.81–85 To delve deeper into the characteristics of the PANI/rGO system and their interactions, the conductor-like screening model for real solvents (COSMO-RS) methodology was applied. This involved utilizing the COSMOthermX program to calculate relevant thermodynamic parameters. The COSMO-RS calculations were conducted at 298.15 K to ensure that the computational data accurately reflects the real-world behavior of the system. In addition, the optimization process allowed us to determine geometrical parameters as well as various QTAIM and RDG topological parameters.
000 picoseconds, also with a 1 femtosecond time step at 298 kelvin. The outcome of this simulation led to another round of geometric optimization.70,72 Energies were calculated for approximately of a hundred resulting conformations or more. Among these conformations, the one with the lowest energy was selected as the model for subsequent analysis. The selected model was further optimized via the DFT M06-2X functional70,73–77 and the TZVP basis set,78–80 and this optimization was carried out with the Turbomole software.81–85 To delve deeper into the characteristics of the PANI/rGO system and their interactions, the conductor-like screening model for real solvents (COSMO-RS) methodology was applied. This involved utilizing the COSMOthermX program to calculate relevant thermodynamic parameters. The COSMO-RS calculations were conducted at 298.15 K to ensure that the computational data accurately reflects the real-world behavior of the system. In addition, the optimization process allowed us to determine geometrical parameters as well as various QTAIM and RDG topological parameters.
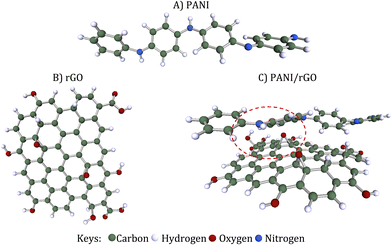
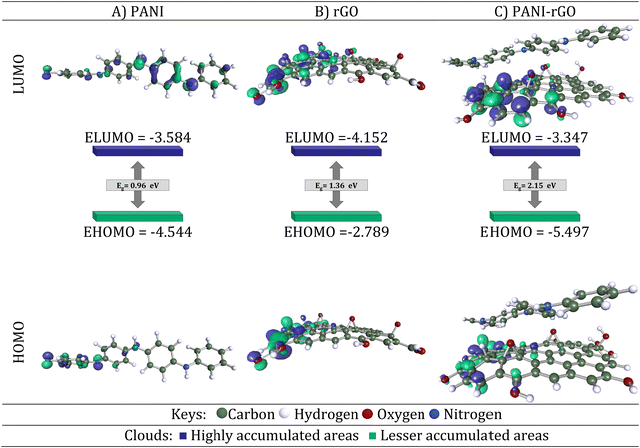
To represent the PANI conducting polymer, an oligomer was employed, comprising four monomer units of aniline. This oligomer includes 4 phenyl rings and a total of 48 atoms. In our model, rGO was selected. It's composed of 55 carbon atoms and 11 oxygen atoms, with open ends saturated by hydrogen atoms. rGO is essentially the reduced form of GO, featuring oxygen-containing groups like carboxyl acid (–COOH), hydroxy (–OH), and epoxy (–O–) functional groups that are haphazardly affixed to the edges and surface. The portrayal of rGO's structure lacks precision due to the erratic distribution of these oxygen-containing functional groups and the notable structural disarray within the framework.86 Both rGO and PANI underwent neutral optimization. This optimization allowed us to determine various electronic properties, including charge distribution, energies associated with the highest and the lowest occupied molecular orbitals (HOMO and LUMO, respectively), as well as band gap (Eg), which was estimated using the HOMO and LUMO energies through the following equation (eqn (9)):
| Eg = ELUMO − EHOMO | (9) |
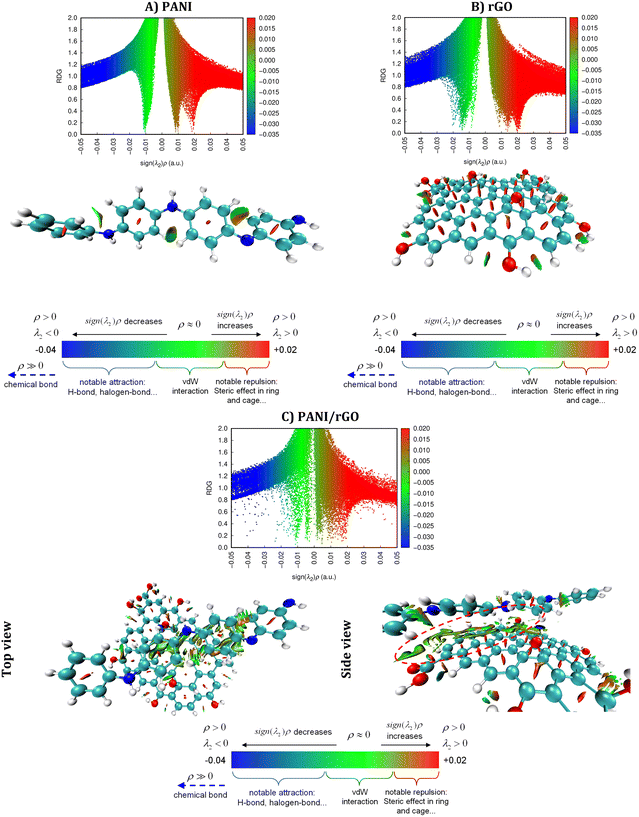
To comprehensively investigate weak interactions within a three-dimensional framework, our study employs an illuminating approach focused on the analysis of NCI.87–89 Several theoretical models, including NCI-RDG and QTAIM, were applied. The RDG analysis relies on fundamental electron density (ρ) and reduced density gradients (RDGs), expressed in mathematical terms using eqn (10), where ρ denotes the electron density, and ∇ρ signifies its initial derivative. This method is particularly effective for identifying van der Waals interactions and weak non-covalent interactions, including hydrogen bonding and steric repulsions, which become significant at specific distances and can significantly influence the system as a whole.90,91
 | (10) |
For NCI analyses based on the RDG and QTAIM, we incorporated the Molden input from Turbomole92 and utilized the computational tool Multiwfn93 to explore and identify potential weak interactions within the analyzed system. To visualize the results, we generated RDG plots and QTAIM maps via the Visual Molecular Dynamics (VMD) interface.94 Furthermore, color scatter plots were created with the assistance of gnuplot.95 These advanced computational techniques facilitated an in-depth examination of weak interactions within the system under investigation.
3. Results and discussion
3.1. Response surface methodology results
In this investigation, a series of 15 experiments was executed using RSM-BBD, involving three repeated experiments that incorporated three input variables and three center points. Each experiment was replicated twice, and the mean value was determined. The design matrix for the experiments and the predicted outcomes are detailed in Table 2. Notably, the center point runs (#4, #10, and #15) exhibited minimal variations in the electrical conductivity, indicative of excellent experimental repeatability.| #Run | Code values | Real values | Electrical conductivity σ × 10−3 (S cm−1) | ||||
|---|---|---|---|---|---|---|---|
| X 1 | X 2 | X 3 | X 1 | X 2 | X 3 | ||
| 1 | + | − | 0 | 0.75 | 1 | 4 | 3.142 |
| 2 | 0 | − | − | 0.5 | 1 | 2 | 3.203 |
| 3 | 0 | + | + | 0.5 | 5 | 6 | 2.958 |
| 4 | 0 | 0 | 0 | 0.5 | 3 | 4 | 2.472 |
| 5 | − | 0 | − | 0.25 | 3 | 2 | 2.189 |
| 6 | − | + | 0 | 0.25 | 5 | 4 | 1.756 |
| 7 | − | 0 | + | 0.25 | 3 | 6 | 2.277 |
| 8 | − | − | 0 | 0.25 | 1 | 4 | 1.893 |
| 9 | 0 | + | − | 0.5 | 5 | 2 | 2.122 |
| 10 | 0 | 0 | 0 | 0.5 | 3 | 4 | 2.250 |
| 11 | 0 | − | + | 0.5 | 1 | 6 | 3.739 |
| 12 | 0 | 0 | 0 | 0.75 | 5 | 4 | 3.295 |
| 13 | + | 0 | − | 0.75 | 3 | 2 | 3.715 |
| 14 | + | 0 | + | 0.75 | 3 | 6 | 4.975 |
| 15 | 0 | 0 | 0 | 0.5 | 3 | 4 | 2.122 |
Furthermore, a comprehensive evaluation of the experimental outcomes involved an in-depth analysis of multiple regression models. After assessing various models, the quadratic model emerged as the most suitable fit for all design points. To understand the effects of the variables and their interactions, Analysis of Variance (ANOVA) was performed, and the findings are reported in Table 3. It was observed that a linear effect (X1) and a quadratic effect (X32) were statistically significant, with a p-value < 0.05. Nevertheless, the other linear and interaction terms, along with all quadratic terms, were considered statistically insignificant (p-value > 0.05). The experimental data exhibited a favorable agreement with the formulated model equation, evident from the lack of fit result with a p-value > 0.05. Subsequently, a second-order polynomial function, represented by eqn (8), was deduced to approximate the σ of PANI/rGO nanocomposites:
| σ = 2.28144 + 0.87651X1 − 0.23076X2 + 0.33983X3 + 0.07224X1X2 + 0.29292X1X3 + 0.07501X2X3 + 0.26177X12 − 0.02154X22 + 0.74556X32 | (11) |
| Parameter | D f | Sum of squares | Mean square | F ratio | Prob. > F |
|---|---|---|---|---|---|
| a Significant at 95% confidence interval. | |||||
| Intercept | 9 | 10.123 | 1.125 | 7.3866 | 0.0002a |
| X 1 (molar ratio of APS/ANI) | 1 | 6.147 | 6.147 | 40.3646 | 0.0014a |
| X 2 (rGO loading) | 1 | 0.426 | 0.426 | 2.7974 | 0.1553 |
| X 3 (time) | 1 | 0.924 | 0.924 | 6.0671 | 0.057 |
| X 1 X 2 | 1 | 0.021 | 0.021 | 0.1371 | 0.7264 |
| X 1 X 3 | 1 | 0.343 | 0.343 | 2.2538 | 0.1936 |
| X 2 X 3 | 1 | 0.023 | 0.023 | 0.1478 | 0.7165 |
| X 1 2 | 1 | 0.253 | 0.253 | 1.6615 | 0.2538 |
| X 2 2 | 1 | 0.002 | 0.002 | 0.0113 | 0.9196 |
| X 3 2 | 1 | 2.052 | 2.052 | 13.4778 | 0.0144a |
| Lack of fit | 3 | 0.699 | 0.233 | 7.4106 | 0.1212 |
| Pure error | 2 | 0.063 | 0.031 | ||
| Total | 14 | 10.885 | |||
Here, σ, X1, X2, and X3 represent the electrical conductivity of PANI/rGO nanocomposites, coded forms of the APS/ANI ratio, rGO loading, and the time of polymerization, respectively.
The results from the ANOVA analysis, presented in Table 3, reveal an exceptionally low p-value (<0.0001), signifying a highly significant alignment of the model with the experimental data. Moreover, the lack of fit value (0.1212) substantiates the model's aptitude in capturing the experimental trends, thereby confirming its bona fide predictive power. Moreover, the model demonstrates excellent predictive performance, supported by the elevated adjusted and predicted R2 values of 0.8041 and 0.9301, respectively, highlighting the precision and dependability of its predictions.
Additionally, to verify the adequacy of the model and ensure it meets the analysis assumptions, residual analysis was conducted. Given the dispersion of residuals observed in Fig. 3, the data points scatter randomly about the center line, devoid of any apparent systematic trends or patterns. This randomness is indicative of the model's adequacy in capturing the inherent variability of the experimental data. Furthermore, the scatter of residuals displayed uncorrelated and random distribution on both sides of the center line, indicating constant variance. These robust findings provide compelling evidence that the model is appropriate and indeed satisfies the assumptions of the analysis.
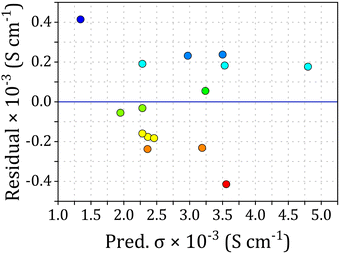 | ||
| Fig. 3 Correlation between residuals and predicted values for the electrical conductivity of PANI/rGO nanocomposites. | ||
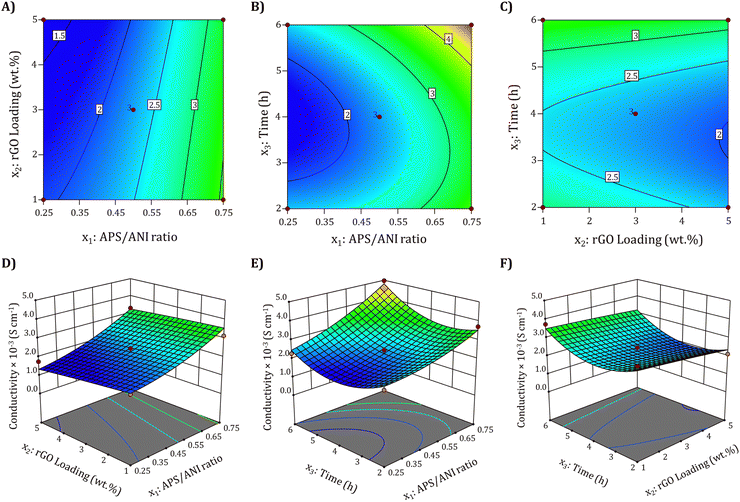
To understand the interaction effects of two variables while maintaining the other variables at their central point value (zero level), we created 2D contour and 3D surface plots using eqn (11). Fig. 4(A) and (D) depict the influence of the APS/ANI ration and rGO loading at a constant polymerization time of 4 h. It is evident that the electrical conductivity increases as the APS/ANI ratio and rGO loading vary from 0.5 to 0.75 and 3 to 5 wt%, respectively. However, at higher APS/ANI ratios and increased rGO loading, the electrical conductivity shows a decreasing trend. This behavior can be attributed to the increased amount of APS (oxidant), resulting in the generation of a higher number of radical cations, which consequently accelerates the chemical oxidative polymerization of ANI. As acknowledged, the electrical conductivity of PANI is contingent on the protonation degree or the effective conjugation length of PANI chains.96 In addition, the higher content of rGO in the nanocomposites hinders the orderly arrangement of PANI chains, inducing a higher structural disorder and creating more conjugated defects, ultimately contributing to lower conductivity.56 Likewise, Fig. 4(B) and (E) exhibit the combined impact of APS/ANI ratio and polymerization time (h) on electrical conductivity while keeping the rGO loading fixed at 3 wt%. It is evident that electrical conductivity continues to rise with an increase in the polymerization time, consistent with previous reports.33,97 Finally, Fig. 4(C) and (F) demonstrate the linear influence of rGO loading and polymerization time on the electrical conductivity, suggesting their minor impact on the overall electrical conductivity.
3.2. Artificial neural network modeling
In this study, ANN was constructed to capture the intricate non-linear associations among three independent variables (molar ratio of APS/ANI, rGO loading, and polymerization time) and the desired output (electrical conductivity) through the application of the Broyden–Fletcher–Goldfarb–Shanno (BFGS) algorithm. For performance optimization, we meticulously tuned hyperparameters, training and assessing a total of eight distinct ANN architectures. We systematically varied the number of neurons in a hidden layer to identify the configuration that yielded the lowest RMSE and the highest R2 values following this analysis, we determined the final architecture of the ANN model, adopting a 3-12-1 configuration, where the hidden layer comprises 12 neurons. Fig. 5(A) illustrates the statistical metrics RMSE and R2 for different architectures, revealing that the 3-12-1 architecture yields lower RMSE and higher R2 values, indicating superior predictive performance. The proposed ANN structure is schematically depicted in Fig. 5(B).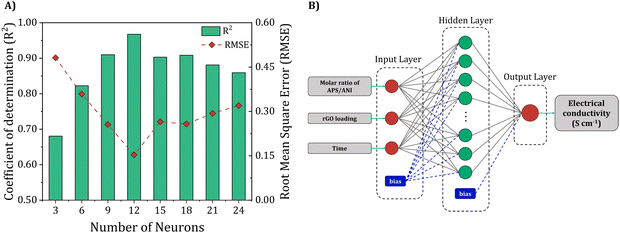 | ||
| Fig. 5 (A) Performance of the developed ANN model with respect to the neurons’ number in the hidden layer, and (B) schematic representation of the 3-12-1 ANN architecture. | ||
3.3. Comparison between RSM and ANN models
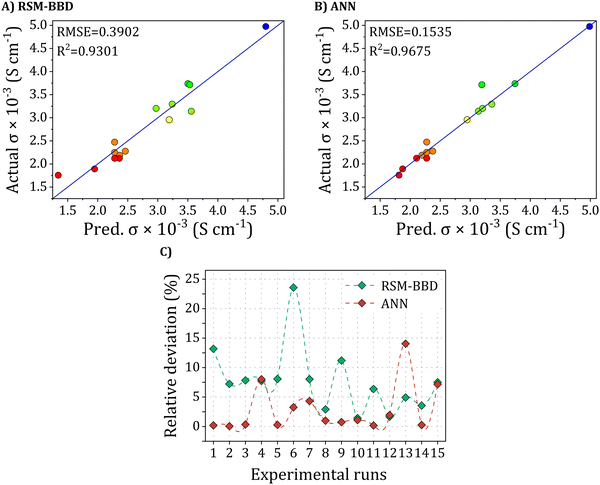
The effectiveness of the proposed approaches has been validated, establishing the superiority of the methods in depicting the electrical conductivity of PANI/rGO nanocomposites. To compare the predictions of the respective models (RSM-BBD and ANN), a comprehensive error analysis was performed, and key performance metrics, including R2, RMSE, AARD, MAE, and relative deviation (RD%), were computed using the equations detailed in the methodology section. As depicted in Fig. 6(A) and (B), the scatter plots for both models illustrated strong concordance with the experimental data, substantiated by the elevated R2R2 values of 0.93 and 0.97 for RSM and ANN, respectively. Notably, the ANN demonstrated superior accuracy in fitting the experimental data when contrasted with the RSM model, as indicated by the plot of RD% in Fig. 6(C). This higher predictive accuracy of the ANN model highlights its superior performance.However, it is crucial to recognize that the ANN model, in its standard form, does not inherently elucidate the influence of input parameters on the response; this understanding typically necessitates further analysis, such as a query strategy for selecting informative training data or post-hoc interpretability methods. In contrast, the primary advantage of RSM lies in its capacity to demonstrate factor contributions through coefficients in the regression model.
The integration of ANN techniques in our study enhanced the predictive accuracy of electrical conductivity, achieving a conductivity of 4.988 × 10⁻³ S cm−1, compared to 4.975 × 10⁻³ S cm−1 obtained using RSM. Although the numerical enhancement of 0.013 mS cm−1 may appear modest, it is significant for several reasons.
First, the improvement from ANN demonstrates superior predictive capability over RSM. Evaluation metrics listed in Table 4, including R2, AARD, and RMSE, provide additional validation of the robust alignment between the ANN-predicted and experimental values, surpassing the performance achieved by the RSM model. The enhanced predictive prowess of ANNs can be ascribed to their adeptness in approximating non-linear systems, a capability beyond the scope of RSM, which is confined to approximating systems using second-order polynomials.
| Metric | Model | |
|---|---|---|
| BBD | ANN (3-12-1) | |
| R 2 | 0.9301 | 0.9675 |
| RMSE | 0.3902 | 0.1535 |
| AARD (%) | 7.68 | 2.86 |
| MAE | 0.1985 | 0.0797 |
Enhanced predictive accuracy results in better reproducibility in large-scale production. The precise optimization of parameters ensures that the synthesized nanocomposites consistently achieve high performance, reducing variability and enhancing reliability. In practical applications, even small improvements in conductivity can significantly impact the overall performance of materials. Higher conductivity improves the efficiency of electronic devices and sensors, leading to better sensitivity and faster response times. For industrial applications, achieving minor enhancements in material properties can have a substantial cumulative effect. Enhanced conductivity can lead to cost savings, improved product quality, and competitive advantages in the marketplace.
3.4. Electrical conductivity optimization of the PANI/rGO nanocomposites
In our endeavor to improve the electrical conductivity of PANI/rGO nanocomposites, we harnessed the power of a response surface optimization approach and ANN predictive model. These methodologies are intricately crafted to identify the optimal position within the design space, whether it involves a minimum, a maximum, or a specific region characterized by a stable response. The main objective in this investigation was to maximize the electrical conductivity of PANI/rGO nanocomposites. To accomplish this, we relied on the RSM and ANN models. Through meticulous analysis, we uncovered the precise conditions that lead to the highest electrical conductivity. These optimal conditions were revealed to be an APS/ANI molar ratio of 0.75, an rGO loading of 3 wt%, and a polymerization time of 6 hours.Following this optimization, a comprehensive analysis using various techniques, encompassing UV-visible, Raman, FTIR, PL, XRD, XPS, CV, and TGA analyses were performed for the PANI/rGO samples. These analyses provided in-depth insights into the structural, optical, and electrochemical performances of the investigated PANI/rGO nanocomposites.
3.5. Compositional and structural analyses
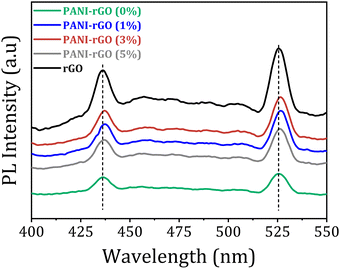
![[double bond, length as m-dash]](https://www.rsc.org/images/entities/char_e001.gif) O bonds in carbonyl or carboxyl groups within rGO, which occur as a result of partial reduction.64 This absorbance profile is characteristic of graphene materials and indicates the restoration of electronic conjugation within rGO sheets.99,100 The enhanced absorption and absence of distinct peaks within this range indicate the formation of a continuous, highly conjugated graphene structure in rGO. Regarding the PANI/rGO nanocomposites in varying ratios, it is noteworthy that compared to the pure PANI or rGO samples, it displays three robust absorbance peaks at 210 nm, 270 nm, and 655 nm, each showing a shift with respect to the peaks observed in the pure materials. These peaks are shifted, suggesting a relatively complex interaction between PANI and rGO. The observed peak at approximately 210 nm is attributed to a π–π* aromatic transition.101 The wide peak ranging from 240 to 320 nm in the PANI/rGO spectra is associated with the benzenoid π–π* transition. Additionally, a shoulder is observed, likely stemming from the Polaron–π* transition of quinoid-imine functional groups due to protonation. These findings affirm the presence of diverse interactions, involving hydrogen bonding and π–π coordination among the PANI and rGO.102–104
O bonds in carbonyl or carboxyl groups within rGO, which occur as a result of partial reduction.64 This absorbance profile is characteristic of graphene materials and indicates the restoration of electronic conjugation within rGO sheets.99,100 The enhanced absorption and absence of distinct peaks within this range indicate the formation of a continuous, highly conjugated graphene structure in rGO. Regarding the PANI/rGO nanocomposites in varying ratios, it is noteworthy that compared to the pure PANI or rGO samples, it displays three robust absorbance peaks at 210 nm, 270 nm, and 655 nm, each showing a shift with respect to the peaks observed in the pure materials. These peaks are shifted, suggesting a relatively complex interaction between PANI and rGO. The observed peak at approximately 210 nm is attributed to a π–π* aromatic transition.101 The wide peak ranging from 240 to 320 nm in the PANI/rGO spectra is associated with the benzenoid π–π* transition. Additionally, a shoulder is observed, likely stemming from the Polaron–π* transition of quinoid-imine functional groups due to protonation. These findings affirm the presence of diverse interactions, involving hydrogen bonding and π–π coordination among the PANI and rGO.102–104
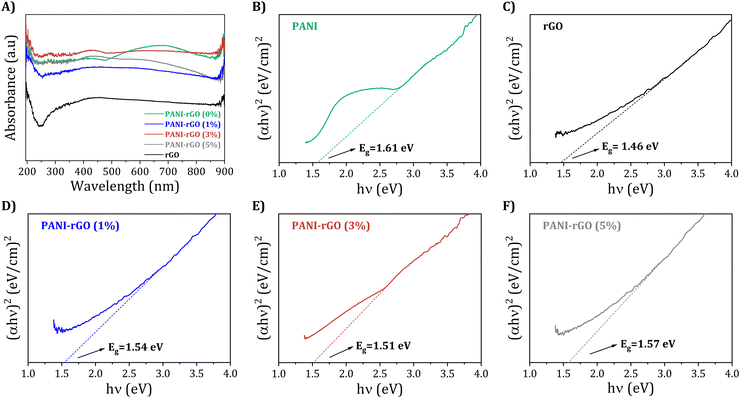 | ||
| Fig. 7 (A) UV-Visible adsorption spectra (A) with its corresponding Tauc plots for pure PANI, rGO, and PANI/rGO nanocomposites (B)–(F). | ||
Moving on, Fig. 7(B–F) show the corresponding Tauc plot, (αhν)2 with hν, for pure PANI, rGO, and PANI/rGO (1, 3, and 5 wt%) samples, with h representing the Planck constant and ν denoting the frequency. The energy gap (Eg) can be estimated by determining the x-intercept of the extrapolated Tauc plot.105 For pure PANI and rGO, the band gap is found to be approximately 1.61 and 1.46 eV, respectively (Fig. 7(B and C)). Furthermore, as the rGO loading increases up to 3 wt%, the optical band gap of the composite decreases to 1.51 eV. In PANI/rGO nanocomposites, the integration of rGO leads to the formation of new energy levels known as trap states. These states are typically located near the valence band and arise due to the complex interaction between PANI and rGO, introducing localized states or defect levels within the composite structure. These trap states play a pivotal role in the electronic properties of the nanocomposite (Fig. 7(D and E)). While electron delocalization within the conjugated PANI chains is a contributing factor, the primary mechanism for the reduced energy gap (Eg) and increased conductivity lies in these trap states. These states provide a pathway for electrons to move from the valence band to the conduction band with minimal energy input. Essentially, the trap states create a ‘stepping stone’ effect, allowing electrons to ‘hop’ between these states. This hopping mechanism is less energy-intensive than the direct transition across the full band gap in a pristine material. As a result, the presence of these trap states in PANI/rGO nanocomposites facilitates easier and more efficient electron movement, leading to enhanced electrical conductivity. However, it is important to note that this is a nuanced balance. An excessive concentration of trap states or rGO can lead to increased scattering and localization effects, potentially countering the benefits of enhanced conductivity. Nevertheless, as shown in Fig. 7(F), with a continued increase in rGO loading (5 wt%), barriers are formed within the PANI chain, hindering electron delocalization and resulting in a corresponding increase in the band gap (1.57 eV).56 Thus, incorporating 3 wt% rGO into the PANI matrix promotes electron delocalization, broadening the absorption range, and enhancing electrical conductivity.106,107 Meanwhile, the reduction in the energy gap compared to rGO alone is particularly significant which expands the absorption range into the visible area of the electromagnetic spectrum, thereby improving the light harvesting efficiency of PANI/rGO nanocomposites. Consequently, the incorporation of rGO facilitates increased delocalization of electrons within the PANI chains, allowing for the absorption of a wider range of photons.108 As a result, the PANI/rGO nanocomposites exhibit improved electrical conductivity, as observed in the present study.
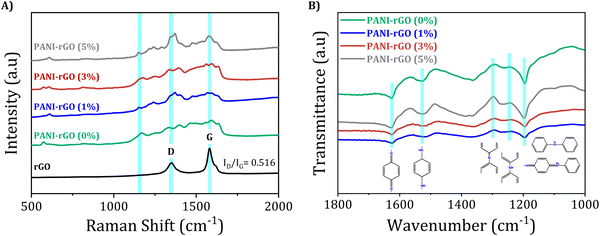
The Raman spectra of rGO shows two discernible peaks with significance: one at 1351 cm−1 associated with the D mode, suggesting defects in graphitic carbon, and the other at 1580 cm−1 (G mode), aligning with the first-order scattering of the E2g mode commonly observed in sp2-carbon fields.116,117 The extent of disorder in carbon materials is commonly assessed using the ID/IG ratio. In this case, the low ID/IG ratio of rGO (0.516) suggests a reduction in structural defects compared to its precursor material, GO. Literature reports suggest that the high ID/IG ratio in GO is indicative of a distorted lattice and a significant number of sp3-like defects resulting from the oxidation process during its preparation.118 The presence of oxygen-containing chemical moieties or groups during oxidation causes disturbances in the graphene lattice and leads to the formation of sp3 carbon domains in GO. Nevertheless, during the reduction process, some of these defects are repaired, leading to a more ordered lattice in rGO defects by restoring the sp2 hybridized carbon network and reducing the sp3 domains, as evidenced by a lower ID/IG ratio. This process, however, might not completely eliminate all defects, leaving some residual disruptions in the lattice structure. The removal of oxygen-containing functional groups during reduction restores sp2 carbon domains and recovers the graphene-like structure. As a consequence, the ID/IG ratio in rGO decreases, representing a reduction in the number of sp3-like defects and an increase in the relative abundance of sp2 carbon fields.117,119
The Raman spectrum of pristine PANI reveals distinct bands linked to the doped polymer, including C–H bending in the quinoid ring at 1161 cm−1, C–N+ stretching at 1329 cm−1, and C![[double bond, length as m-dash]](https://www.rsc.org/images/entities/char_e001.gif) C stretching in the quinonoid ring at 1590 cm−1. In PANI/rGO nanocomposites, the Raman spectra exhibits characteristic peaks consistent with those of pure PANI, corroborated by prior research, providing further evidence of the presence of PANI in the nanocomposites.120–122 Interestingly, As the rGO content increases in the PANI/rGO nanocomposites, the vibration intensity at approximately 1470 cm−1 (corresponding to C
C stretching in the quinonoid ring at 1590 cm−1. In PANI/rGO nanocomposites, the Raman spectra exhibits characteristic peaks consistent with those of pure PANI, corroborated by prior research, providing further evidence of the presence of PANI in the nanocomposites.120–122 Interestingly, As the rGO content increases in the PANI/rGO nanocomposites, the vibration intensity at approximately 1470 cm−1 (corresponding to C![[double bond, length as m-dash]](https://www.rsc.org/images/entities/char_e001.gif) N quinoid stretching) undergoes changes, signifying that the addition of rGO encourages the prevalence of the quinoid form of PANI, promoting a conjugated planar arrangement. This finding is additionally substantiated by analyzing the intensity ratio of the C–H vibration in the quinoid unit (1150 cm−1) relative to that of the consistent benzenoid (1160 cm−1).123,124 The stabilization of quinoid rings in the PANI/rGO nanocomposites is facilitated by π–π interactions with the basal planes of rGO, resulting in an increased level of polymer chain ordering within the hybrids.119 This enhanced polymer chain ordering promotes stronger interactions and facilitates more effective charge transfer between rGO and PANI.
N quinoid stretching) undergoes changes, signifying that the addition of rGO encourages the prevalence of the quinoid form of PANI, promoting a conjugated planar arrangement. This finding is additionally substantiated by analyzing the intensity ratio of the C–H vibration in the quinoid unit (1150 cm−1) relative to that of the consistent benzenoid (1160 cm−1).123,124 The stabilization of quinoid rings in the PANI/rGO nanocomposites is facilitated by π–π interactions with the basal planes of rGO, resulting in an increased level of polymer chain ordering within the hybrids.119 This enhanced polymer chain ordering promotes stronger interactions and facilitates more effective charge transfer between rGO and PANI.
Remarkably, the FTIR spectrum of rGO exhibited distinct changes, with a novel peak emerging at 1565 cm−1, attributed to sp2 hybridized C![[double bond, length as m-dash]](https://www.rsc.org/images/entities/char_e001.gif) C, and the disappearance of the peak at 1050 cm−1, indicative of epoxide groups. These observations proved the successful reduction of GO to rGO, aligning with similar FTIR spectra reported in the literature for rGO.125 In the FTIR spectrum of PANI and PANI/rGO nanocomposites, prominent absorption peaks are observed at 3277, 1623, 1428, and 1318 cm−1, corresponding to N–H, C
C, and the disappearance of the peak at 1050 cm−1, indicative of epoxide groups. These observations proved the successful reduction of GO to rGO, aligning with similar FTIR spectra reported in the literature for rGO.125 In the FTIR spectrum of PANI and PANI/rGO nanocomposites, prominent absorption peaks are observed at 3277, 1623, 1428, and 1318 cm−1, corresponding to N–H, C![[double bond, length as m-dash]](https://www.rsc.org/images/entities/char_e001.gif) N, C
N, C![[double bond, length as m-dash]](https://www.rsc.org/images/entities/char_e001.gif) C, and C–N stretching, correspondingly.126 Notably, the intensity ratio of the PANI bands (1623 and 1428 cm−1) is indicative of the occurrence of reduced (benzenoid) and oxidized (quinoid) repeat units. These characteristic bands serve as compelling evidence for the presence of the emeraldine salt phase of PANI in the nanocomposites.127 The emeraldine salt phase represents the conductive state of PANI, featuring alternating benzenoid and quinoid repeat units. This conductive state is crucial for optimizing the electrical properties of PANI/rGO nanocomposites. In the structure of polyaniline, the alternating arrangement of benzenoid and quinoid units plays a crucial role in defining its electrical properties. This structural configuration facilitates the delocalization of π electrons across the benzenoid units, which is essential for the intrinsic conductivity of the polymer. This delocalization contributes to the overall electronic structure of PANI, allowing for a certain degree of electron mobility within the polymer chain. Simultaneously, the presence of quinoid units introduces sites for potential charge transfer interactions. These interactions are not purely based on the delocalization of π electrons but involve hopping mechanisms, where charge carriers, such as polarons and bipolarons, move between localized states along the polymer chain. This charge transfer process is influenced by the degree of oxidation (doping) of PANI and is critical in applications where PANI undergoes redox reactions or interacts with other materials, such as graphene in composites. Therefore, the electrical conductivity in PANI is a result of a complex interplay between the delocalization of π electrons, predominantly within the benzenoid segments, and charge transfer mechanisms, facilitated by the quinoid structures and doping levels. This interplay enables PANI to exhibit a range of conductive behaviors, adapting to different environmental conditions and applications. As a result, the presence of the emeraldine salt phase enables the efficient flow of electrons, contributing to improved electrical conductivity and enhanced performance of the nanocomposites in various applications, including energy storage devices, sensors, and conductive coatings. Interestingly, the FTIR spectrum of PANI/rGO nanocomposites did not exhibit the functional groups present on the rGO. This finding indicated that the surface of rGO was effectively coated with PANI through precise interactions, such as π–π electron stacking and H- bonding among the amine group of PANI and the oxygen groups in rGO.128,129 Notably, the polymerization process involving aniline in the presence of rGO follows a specific mechanism. Aniline undergoes oxidation, consequential in the construction of oxidized radicals. These radicals then undergo a reductive elimination of 2H+ to form an α,α-aniline dimer. Subsequently, these dimers can propagate to longer chain lengths through repeated oxidation and reaction with generated aniline radicals via oxidation.130 These interactions not only ensure the uniform dispersion of rGO within the PANI matrix but also contribute significantly to the improved electrical properties and overall performance of the PANI/rGO nanocomposites.
C, and C–N stretching, correspondingly.126 Notably, the intensity ratio of the PANI bands (1623 and 1428 cm−1) is indicative of the occurrence of reduced (benzenoid) and oxidized (quinoid) repeat units. These characteristic bands serve as compelling evidence for the presence of the emeraldine salt phase of PANI in the nanocomposites.127 The emeraldine salt phase represents the conductive state of PANI, featuring alternating benzenoid and quinoid repeat units. This conductive state is crucial for optimizing the electrical properties of PANI/rGO nanocomposites. In the structure of polyaniline, the alternating arrangement of benzenoid and quinoid units plays a crucial role in defining its electrical properties. This structural configuration facilitates the delocalization of π electrons across the benzenoid units, which is essential for the intrinsic conductivity of the polymer. This delocalization contributes to the overall electronic structure of PANI, allowing for a certain degree of electron mobility within the polymer chain. Simultaneously, the presence of quinoid units introduces sites for potential charge transfer interactions. These interactions are not purely based on the delocalization of π electrons but involve hopping mechanisms, where charge carriers, such as polarons and bipolarons, move between localized states along the polymer chain. This charge transfer process is influenced by the degree of oxidation (doping) of PANI and is critical in applications where PANI undergoes redox reactions or interacts with other materials, such as graphene in composites. Therefore, the electrical conductivity in PANI is a result of a complex interplay between the delocalization of π electrons, predominantly within the benzenoid segments, and charge transfer mechanisms, facilitated by the quinoid structures and doping levels. This interplay enables PANI to exhibit a range of conductive behaviors, adapting to different environmental conditions and applications. As a result, the presence of the emeraldine salt phase enables the efficient flow of electrons, contributing to improved electrical conductivity and enhanced performance of the nanocomposites in various applications, including energy storage devices, sensors, and conductive coatings. Interestingly, the FTIR spectrum of PANI/rGO nanocomposites did not exhibit the functional groups present on the rGO. This finding indicated that the surface of rGO was effectively coated with PANI through precise interactions, such as π–π electron stacking and H- bonding among the amine group of PANI and the oxygen groups in rGO.128,129 Notably, the polymerization process involving aniline in the presence of rGO follows a specific mechanism. Aniline undergoes oxidation, consequential in the construction of oxidized radicals. These radicals then undergo a reductive elimination of 2H+ to form an α,α-aniline dimer. Subsequently, these dimers can propagate to longer chain lengths through repeated oxidation and reaction with generated aniline radicals via oxidation.130 These interactions not only ensure the uniform dispersion of rGO within the PANI matrix but also contribute significantly to the improved electrical properties and overall performance of the PANI/rGO nanocomposites.
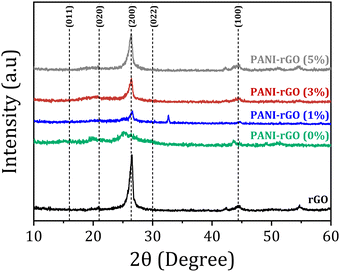
Upon forming the PANI/rGO nanocomposites, new peaks surfaced, demonstrating a shift compared to the pristine rGO peaks. This shift is ascribed to the π–π bond stacking of the benzene rings in PANI with rGO. Particularly, the peak at 2θ = 25.50° in pure PANI shifted to 26.60° when PANI was blended with rGO, signifying a substantial interaction between rGO particles and PANI chains.21 Moreover, the XRD analysis of rGO/PANI nanocomposites revealed diffraction peaks similar to those observed in PANI or rGO, suggesting the absence of additional crystalline structures in the nanocomposite samples. Based on these outcomes, it can be resolved that the characteristic diffraction peaks indicate extensive physical and chemical interactions between rGO and PANI chains. These interactions include H-bonds, electrostatics, and π–π coordination interactions.101
3.6. X-ray photoelectron spectroscopy (XPS)
The investigation of elemental composition was advanced by X-ray photoelectron spectroscopy (XPS), providing deeper insights into the samples. The comprehensive survey spectra, as depicted in Fig. 11(A), distinctively portray the characteristic chemical profiles of pure PANI, rGO, and PANI/rGO nanocomposite samples, featuring discernible signals consistent to carbon (C 1s), nitrogen (N 1s), and oxygen (O 1s) for each respective material. Additionally, it is noteworthy that besides the detection of C KLL and O KLL Auger electron emissions in the high binding energy region, the oxygen signal present in the PANI sample may have arisen from residual APS as well as water molecules adsorbed onto the surface.133 This oxygen signal might also stem from the rGO component within the PANI/rGO samples. Intriguingly, a subtle yet noteworthy N 1s peak observed in the rGO spectrum can be ascribed to doped nitrogen resulting from the hydrazine reduction process, thus further enriching our understanding of these intricate materials.61,134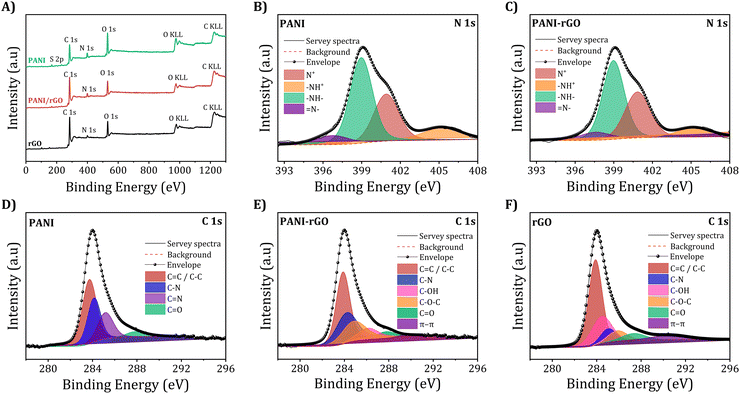 | ||
| Fig. 11 XPS surveys with (A) the broad high-resolution spectrum of the (B and C) N 1s and (D–F) C 1s areas for pure PANI, rGO, and PANI/rGO nanocomposites (3 wt%). | ||
Meanwhile, the N1s spectrum at high resolution for both PANI and PANI/rGO reveals four discernible components, as illustrated in Fig. 11(B) and (C). The peaks at binding energies of 398.1 and 399.2 eV are indicative of imine (–N![[double bond, length as m-dash]](https://www.rsc.org/images/entities/char_e001.gif) ) and amine (–NH–) groups, respectively, while those at 401.6 and 405.1 eV are associated with positively charged nitrogen groups N+ and –NH+, respectively. PANI is predominantly composed of amine groups, suggesting its protoemeraldine form.135,136 Throughout synthesis, PANI undergoes oxidation, leading to the partial conversion of amine to imine nitrogen. This transformation is explicable by the simultaneous reduction of GO oxygen functionalities and PANI nitrogen groups, facilitated by superheated water and the hydrothermal process,137 also via hydrothermal process.133 The heightened fraction of positively charged nitrogen can be attributed to the interactions between PANI and rGO, inducing a restructuring of the benzenoid amine structure of PANI. Moreover, the elevated doping level of PANI in this composite is expected to augment its electrical and electrochemical performance. The C 1s spectra’ deconvolution for PANI, PANI/rGO nanocomposite, and rGO samples is presented in Fig. 11(D–F). Upon closer examination of the primary peak line of PANI, as shown in Fig. 11(D), a decomposition into four distinct peak lines becomes evident. Specifically, PANI displays a peak at 284.6 eV attributed to C–C and C
) and amine (–NH–) groups, respectively, while those at 401.6 and 405.1 eV are associated with positively charged nitrogen groups N+ and –NH+, respectively. PANI is predominantly composed of amine groups, suggesting its protoemeraldine form.135,136 Throughout synthesis, PANI undergoes oxidation, leading to the partial conversion of amine to imine nitrogen. This transformation is explicable by the simultaneous reduction of GO oxygen functionalities and PANI nitrogen groups, facilitated by superheated water and the hydrothermal process,137 also via hydrothermal process.133 The heightened fraction of positively charged nitrogen can be attributed to the interactions between PANI and rGO, inducing a restructuring of the benzenoid amine structure of PANI. Moreover, the elevated doping level of PANI in this composite is expected to augment its electrical and electrochemical performance. The C 1s spectra’ deconvolution for PANI, PANI/rGO nanocomposite, and rGO samples is presented in Fig. 11(D–F). Upon closer examination of the primary peak line of PANI, as shown in Fig. 11(D), a decomposition into four distinct peak lines becomes evident. Specifically, PANI displays a peak at 284.6 eV attributed to C–C and C![[double bond, length as m-dash]](https://www.rsc.org/images/entities/char_e001.gif) C bonds. Furthermore, characteristic peaks associated with carbon-nitrogen interactions manifest as follows: C–N, C–N+, C
C bonds. Furthermore, characteristic peaks associated with carbon-nitrogen interactions manifest as follows: C–N, C–N+, C![[double bond, length as m-dash]](https://www.rsc.org/images/entities/char_e001.gif) N, and C
N, and C![[double bond, length as m-dash]](https://www.rsc.org/images/entities/char_e001.gif) O, each corresponding to binding energies of approximately 285.6, 286.7, as well as 287.9 eV, respectively. The presence of carbonyl functional groups within PANI can be ascribed to the generation of benzoquinone and hydroquinone, resulting from partial surface oxidation.138 Turning attention to Fig. 11 (E and F), the C 1s spectrum for PANI/rGO and rGO display six discernible peak lines: C
O, each corresponding to binding energies of approximately 285.6, 286.7, as well as 287.9 eV, respectively. The presence of carbonyl functional groups within PANI can be ascribed to the generation of benzoquinone and hydroquinone, resulting from partial surface oxidation.138 Turning attention to Fig. 11 (E and F), the C 1s spectrum for PANI/rGO and rGO display six discernible peak lines: C![[double bond, length as m-dash]](https://www.rsc.org/images/entities/char_e001.gif) C and C–C (284.31 eV), C–N (285.4 eV), C–OH (285.7 eV), C–O–C (286.6 eV), C
C and C–C (284.31 eV), C–N (285.4 eV), C–OH (285.7 eV), C–O–C (286.6 eV), C![[double bond, length as m-dash]](https://www.rsc.org/images/entities/char_e001.gif) O bonds (288.1 eV), and π–π stacking (290.4 eV).134,139 Notably, the C–N peaks are more prominent in the PANI/rGO spectra than in the rGO sample. While inherent oxygen defects may exist in the raw rGO sample, the majority of the oxygen in the PANI/rGO nanocomposite coating likely originates from slight rGO oxidation during synthesis. This oxygen content acts as active sites, facilitating PANI polymerization. In this context, it is reasonable to infer that rGO contributes to the formation of a more comprehensive and densely structured PANI/rGO nanocomposite coating. This observation holds significant implications for the structural and functional properties of the resultant nanocomposite material.
O bonds (288.1 eV), and π–π stacking (290.4 eV).134,139 Notably, the C–N peaks are more prominent in the PANI/rGO spectra than in the rGO sample. While inherent oxygen defects may exist in the raw rGO sample, the majority of the oxygen in the PANI/rGO nanocomposite coating likely originates from slight rGO oxidation during synthesis. This oxygen content acts as active sites, facilitating PANI polymerization. In this context, it is reasonable to infer that rGO contributes to the formation of a more comprehensive and densely structured PANI/rGO nanocomposite coating. This observation holds significant implications for the structural and functional properties of the resultant nanocomposite material.
3.7. Electrochemical behavior of PANI/rGO nanocomposites
To comprehend the electrochemical redox behavior of PANI/rGO nanocomposites, a conventional cyclic voltammetry (CV) test was performed. Fig. 12 illustrates the cyclic voltammograms of rGO, pure PANI, and PANI/rGO nanocomposites. When scanned at a rate of 25 mV s−1, the CV of pure PANI exhibited the existence of two sets of redox peaks. These peaks correspond to specific transitions within the PANI structure, notably the shift from the fully-reduced PANI form (leucoemeraldine) to the partially-oxidized PANI form (emeraldine), as well as the transition among emeraldine and the fully-oxidized PANI form (pernigraniline).1,35,122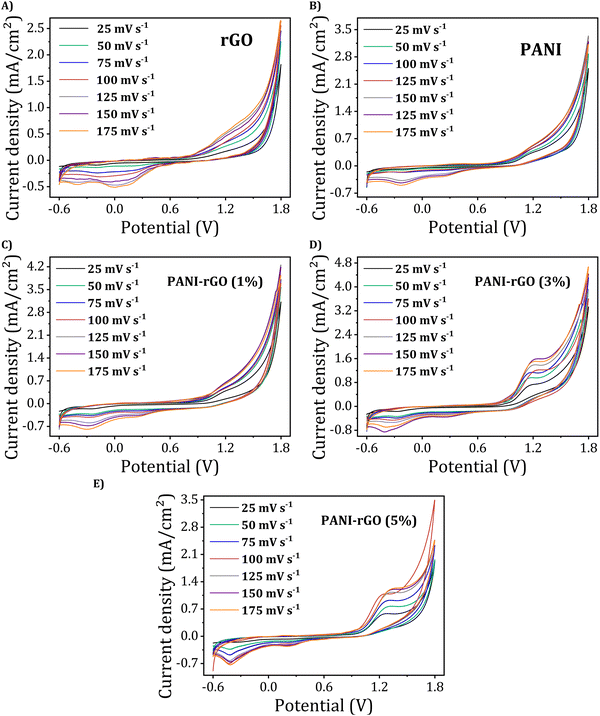 | ||
| Fig. 12 Cyclic voltammograms of (A) rGO, (B) PANI, and PANI/rGO nanocomposites (C)–(E) at different scan rates. | ||
In contrast, the CV of PANI exhibits a single pair of redox peaks when scanned at rates ranging across 25 to 175 mV s−1. It is important to note that as the scan rate rises from 25 to 175 mV s−1, there is a proportional increase in current density. This increase can be ascribed to the interior resistance within the electrode. CV curves for PANI/rGO nanocomposites share a similar overall shape to that of pure PANI, but there is a noticeable difference in current densities. Specifically, the current densities of PANI/rGO nanocomposite samples are somewhat lower compared to PANI at equivalent potential scan rates. Moreover, by altering the weight percentage (wt%) of rGO in the PANI/rGO nanocomposites, significant changes in the profiles of the CV curves and current densities were observed. An increase in the rGO wt% from 3 wt% resulted in a substantial rise in current density. However, this trend was reversed as the rGO content was further increased to 5 wt%.
Using the CV data, the specific capacitances (Cp, F g−1) were calculated for various potential scan rates (ν, mV s−1) through the application of the following formula:
 | (12) |
Here,  signifies the integration of current over time, as acquired from the cyclic voltammogram, m denotes the mass of the sample, which, in this case, corresponds to the PANI/rGO nanocomposites, and is expressed in grams. ΔV represents the potential window, while ν represents the scan rate.
Fig. 13 offers an insightful evaluation by comparing the CV curves at a scan rate of 25 mV s−1 and the computed specific capacitances of pure PANI, rGO, and PANI/rGO nanocomposites. Notably, the trends in current density at 25 mV s−1 (Fig. 13(A)) and the specific capacitance (Fig. 13(B), as detailed in Table 5) align consistently. The order is as follows: PANI/rGO (3 wt%) < PANI/rGO (1 wt%) < PANI < PANI/rGO (5 wt%) < rGO. At a scan rate of 25 mV s−1, the PANI/rGO (3 wt%) nanocomposite exhibits the highest specific capacitance, reaching a remarkable 145.79 F g−1. The exceptional electrochemical behavior of PANI/rGO (3 wt%) can be attributed to an optimal balance between the conductive network provided by rGO and the electroactive surface area of PANI. An increase in the rGO content from 1 wt% to 3 wt% enhances the conductive pathways within the nanocomposite, thereby facilitating better charge transport and higher current densities. However, as the rGO content is further increased to 5 wt%, a decline in performance is observed. The decrease in current density and specific capacitance at 5 wt% rGO can be explained by the physics of percolation theory and the agglomeration effect.65,140 While a moderate amount of rGO improves conductivity, excessive rGO leads to particle agglomeration. This agglomeration reduces the effective surface area and hinders the uniform dispersion of rGO within the PANI matrix. Consequently, the electrochemical active sites are less accessible, and the charge transfer resistance increases.141 This phenomenon results in a decline in the overall electrochemical performance of the nanocomposite.
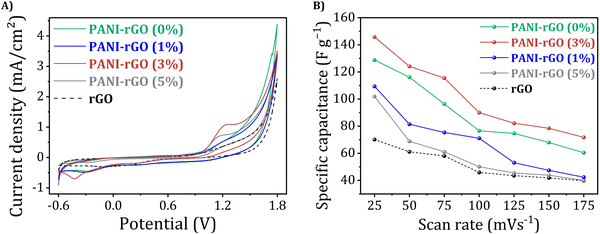 | ||
| Fig. 13 (A) CV curves at a scan rate of 25 mV s−1 and (B) the computed specific capacitance of rGO, pure PANI, and rGO/PANI nanocomposites across various scan rate. | ||
| Sample | Specific capacitance (F g−1) |
|---|---|
| PANI | 101.87 |
| PANI/rGO (1 wt%) | 128.80 |
| PANI/rGO (3 wt%) | 145.79 |
| PANI/rGO (5 wt%) | 109.36 |
| rGO | 70.13 |
Thus, the finding that PANI/rGO (3 wt%) exhibits the highest specific capacitance underscores its exceptional electrochemical behavior, holding great promise for diverse sensor and energy storage applications.
3.8. Thermo-gravimetric analysis (TGA)
Thermogravimetry analysis (TGA) proves instrumental in discerning dopants and water content within polymers, offering valuable insights into thermal degradation patterns, structural characteristics, and thermal stability.142 The progressive degradation at each step of the curve can be delineated through the mass loss profile. Employing TGA, we investigated the thermal stability of rGO, PANI, and PANI/rGO from room temperature up to 1000 °C (Fig. 14).In the case of rGO, a significantly lower weight loss of approximately 11% was noted at 600 °C, demonstrating its heightened stability. The consistent weight reduction observed throughout the temperature spectrum emphasizes the enduring stability of rGO. The initial weight decline in rGO (∼2%) below 100 °C is ascribed to the evaporation of adsorbed solvent molecules. Subsequently, a minor weight loss of ∼5% and ∼7% was observed in rGO between 100–300 °C and >300 °C, correspondingly. The gradual loss at temperatures exceeding 300 °C is linked to the elimination of more stable oxides, particularly –COOH groups, with the partial presence of oxides validating the successful preparation of rGO.143
In PANI, a weight loss approximately 260 °C links to the evaporation of moisture content and dopants, initiating the breakdown of the PANI backbone beyond 260 °C.144 PANI/rGO experiences rapid mass loss at approximately 390 °C, attributed to the decomposition of oxygen-containing groups such as –OH, –CO–, and –COOH.145 Furthermore, Fig. 14 depicts that the thermal stability of the nanocomposite is shifted towards elevated temperatures in contrast to pure PANI. While PANI experiences complete decomposition at 767 °C, PANI/rGO nanocomposites exhibit decomposition temperatures of 838, 870, and 878 °C for PANI/rGO at 1%, 3%, and 5% wt., respectively. This enhanced thermal stability can be attributed to the covalent bonding among rGO and the PANI backbone.146 Moreover, these covalent bonds foster a substantial π–π stacking force amongst the basal plane of rGO and the PANI backbone, further reinforcing the nanocomposite's thermal stability.147
3.9. Computational calculations
In the pursuit of advancing materials science and engineering, the choice of appropriate models for the constituents of a nanocomposite material is paramount. In this study, a specific model for PANI and a distinct model for rGO were selected to comprehensively investigate the PANI–rGO nanocomposite. The overarching aim of this study is to align computational results with experimental findings. By selecting these tailored models for PANI and rGO, we aim to compare and confirm our computational outcomes with experimental data, reinforcing the credibility and applicability of our calculations. This holistic approach bridges the gap between theory and practice, fostering a deeper understanding of the PANI–rGO nanocomposite's structural and electronic properties, with significant implications for materials design and engineering applications.This analysis was conducted under several key assumptions that are essential for the computational modeling process. First, it was assumed that the molecular orbitals of the PANI, rGO, and PANI/rGO systems could be accurately represented as linear combinations of atomic orbitals (LCAO).148 This is a well-established method in quantum chemistry, designed to simplify the intricate interactions within molecules. Additionally, the molecules were modeled as isolated entities in a vacuum environment, an approach that excludes solvent effects and other intermolecular interactions. While this assumption simplifies the computational process, it must be carefully considered when interpreting the results in practical, real-world contexts.149,150 Moreover, the FMO analysis was based on the assumption that the molecules are in their ground state, focusing on their lowest energy configuration without considering possible excitations or the influence of external perturbations such as temperature variations or electromagnetic fields.149,151 Lastly, electron correlation effects were approximated rather than fully incorporated, a common practice in DFT to ensure computational tractability, although this may lead to minor deviations in the calculated absolute energy levels.152
The optimized structures of PANI, rGO, and PANI/rGO, as depicted in Fig. 15 reveal a pronounced tendency of rGO to establish close interactions with the nitrogen (N) atoms of PANI. This is clearly illustrated in Fig. 15(C), where the intimate contact between rGO and the N atoms of PANI is distinctly observed. These interactions are crucial for understanding the electronic and molecular characteristics of the PANI/rGO nanocomposite, which may significantly influence its performance in various applications. These critical findings, illustrated in Fig. 15, provide invaluable insights into the optimized geometry of both PANI, rGO and the PANI/rGO nanocomposite. The interaction among rGO and PANI, as elucidated in the optimized structure, assumes paramount importance in comprehending the electronic and molecular characteristics of this nanocomposite material. To evaluate the comparative stability and reactivity of the optimized structures, a range of parameters were systematically computed. These parameters include the interaction energy, energies of the EHOMO, ELUMO, and Eg.
The interaction energy was calculated by subtracting the sum of the electronic energies of the individual components (PANI and rGO) from the electronic energy of the resulting complex (PANI/rGO). The resulting negative interaction energy, in this case −12.566 eV, indicates that the formation of the PANI/rGO nanocomposite is exothermic. From a thermodynamic perspective, a negative interaction energy suggests that energy is released during the formation of the nanocomposite, which directly implies that the process is thermodynamically favorable. This exothermic reaction lowers the overall energy of the system, driving the formation of the complex.72,153–155 The release of energy during bond formation between PANI and rGO signifies the creation of a more stable, lower-energy configuration compared to the isolated components. Hence, the negative interaction energy not only confirms the spontaneity of the complex formation but also reflects the strong interactions at the molecular level, which contribute to the enhanced stability and unique properties of the PANI/rGO nanocomposite.
Fig. 16 provides a comprehensive overview of the EHOMO and ELUMO, along with the energy gap, for the PANI, rGO, and PANI–rGO structures, all meticulously optimized in their most stable forms. The energy gap of a molecular structure is widely acknowledged as a crucial indicator of its electron transport properties.44,156,157 Specifically, a lower energy gap in molecular structures suggests enhanced ease of electron transport. As illustrated in Fig. 16, the optimized configurations of PANI, rGO, and PANI–rGO exhibit energy gaps of 0.96 eV, 1.36 eV, and 2.15 eV, respectively. This observation aligns seamlessly with the experimental findings outlined in Section 3.5.1. This insight further underscores the potential of the PANI/rGO nanocomposite in facilitating efficient electron transport, a key attribute in various electronic applications.
In chemistry, sigma profiles and sigma potentials (σ-profiles and σ-potentials, respectively) are fundamental tools for studying the distribution of electrostatic potential around molecules and ions. They are pivotal in characterizing a molecule's electronic structure and chemical properties, aiding in predicting reactivity, stability, and other key attributes.165,166 Within the COSMO-RS methodology, σ-profiles (P(σ)) offer graphical representations of charge shielding density on a molecular surface, providing insights into specific charge shielding densities in different regions. σ-Potentials (μ(σ)), on the other hand, measure a molecule's interaction affinity by assessing the electrostatic potential energy at an exact point within the molecule, considering the surrounding solvent environment.78,82,83 This metric helps evaluate the tendency of components in a mixture to interact with polar surfaces and establish hydrogen bonds. The electron density distribution is categorized into three regions: the HBD area (σ < −0.0082 e Å−2), the non-polar area (−0.0082 e Å−2 < σ < 0.0082 e Å−2), and the HBA area (σ > 0.0082 e Å−2). Positive μ(σ) values indicate a higher occurrence of repulsive interactions, while negative values indicate more significant interactions among molecules.167 The horizontal axis, with increasing positive and negative values representing H-bond thresholds, delineates areas within a molecule where HBDs interact with HBAs.168
In this investigation, Fig. 18 provides a compelling visualization of the σ-profiles as well as σ-potentials for both PANI and rGO, which offer profound insights into their unique characteristics. Upon scrutiny of the σ-profiles, it becomes evident that the PANI structure and rGO sheets predominantly exhibit nonpolar attributes, with discernible regions exhibiting a propensity for HBA, notably linked to the oxygen atoms within the rGO structure. Within the P(σ), the central sector corresponds to nonpolar or weakly polar segments of the molecules, whereas the right-hand side reveals strongly polar areas, suggesting potential involvement in hydrogen bonding (Fig. 18(a)). On the left-hand side, HBD regions emerge. Within the carbon-rich zones, nonpolar characteristics prevail, denoted by the green regions in the surface charge distribution representations, signifying areas predominantly associated with exposed carbon atom surfaces. Peaks positioned within the HBA regions link to the presence of oxygen atoms, depicted as red areas in the surface charge density; for rGO, this red area is correlated with the epoxy groups (as observed in Fig. 17(B)). In contrast, peaks within the HBS area of the σ-profile align with hydrogen atoms present in the alkyl side chains and hydroxyl groups, illustrated as light blue areas.169 Moreover, a meticulous examination of the σ-potentials emphasizes that the primary interaction between PANI and rGO transpires within the polar region, encompassing both HBA and HBD sites. This phenomenon can be largely attributed to rGO's demonstrated capacity to establish hydrogen bonds, as indicated by positive μ(s) values.153,170,171 Additionally, it is worth noting that viable interactions are not confined solely to the polar realm; they can also manifest within the nonpolar area, where rGO exhibits a negative μ(s) value (Fig. 18(b)).
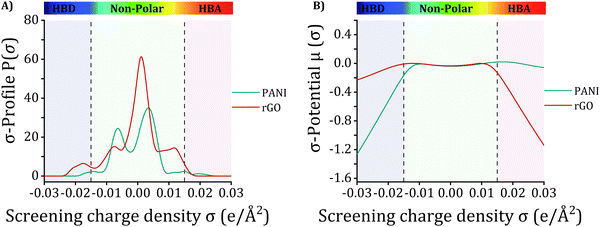 | ||
| Fig. 18 (A) σ-Profiles and (B) σ-potentials derived by COSMO-RS for PANI and rGO models investigated in this study. | ||
This observation underscores the intricate nature of the interaction between PANI and rGO, which bridges both polar and nonpolar domains. Accordingly, the σ-profiles and σ-potentials of these distinct compounds provide appreciated insights into their chemical composition, accounting for polarization and their potential for hydrogen bonding. This comprehensive understanding significantly augments our understandings into the plausible interactions among the targeted PANI and rGO structures.
The capability of the NCI approach is measured by its ability to provide detailed insights into the strength, type, and distribution of these interactions across the molecular system. Specifically, NCI analysis employs the product of ρ and the sign of the second-highest eigenvalue λ2 of the Hessian matrix of the electron density at each point on the isosurface. This product, (λ2) × ρ, is a key metric that allows for the differentiation between attractive and repulsive interactions. A negative value of (λ2) × ρ indicates attractive forces, such as hydrogen bonds, while a positive value signifies repulsive interactions, like steric hindrances.160,172,175
The reliability and effectiveness of the NCI approach are gauged through its consistency with experimental observations and other computational methods. By accurately identifying and characterizing the non-covalent interactions that stabilize molecular structures, the NCI approach has been validated in numerous studies for its ability to predict interaction behavior that aligns well with empirical data. In this study, the capability of the NCI method was demonstrated by the clear identification of van der Waals forces as the predominant stabilizing interactions within the PANI/rGO nanocomposite, as shown in Fig. 19. The RDG isovalue range from −0.035 to 0.020![[thin space (1/6-em)]](https://www.rsc.org/images/entities/char_2009.gif) a.u., combined with the color-coded isosurfaces, effectively visualizes these interactions, further corroborating the stability of the nanocomposite.
a.u., combined with the color-coded isosurfaces, effectively visualizes these interactions, further corroborating the stability of the nanocomposite.
For the PANI molecule, NCI analysis revealed intramolecular van der Waals forces, indicated by green surfaces in the 3D plot, with corresponding spikes at −0.01![[thin space (1/6-em)]](https://www.rsc.org/images/entities/char_2009.gif) a.u. in the 2D s(ρ) plot. In the PANI/rGO system, a cluster of RDG spikes between 0.00 and −0.01
a.u. in the 2D s(ρ) plot. In the PANI/rGO system, a cluster of RDG spikes between 0.00 and −0.01![[thin space (1/6-em)]](https://www.rsc.org/images/entities/char_2009.gif) a.u. confirmed the presence of weak, yet significant, non-covalent interactions, primarily van der Waals forces, which contribute to the formation and stability of the nanocomposite. The application of the NCI approach in this study, therefore, demonstrates its robust capability in accurately mapping and quantifying the non-covalent interactions that underpin the structural integrity and functional properties of the PANI/rGO nanocomposite.
a.u. confirmed the presence of weak, yet significant, non-covalent interactions, primarily van der Waals forces, which contribute to the formation and stability of the nanocomposite. The application of the NCI approach in this study, therefore, demonstrates its robust capability in accurately mapping and quantifying the non-covalent interactions that underpin the structural integrity and functional properties of the PANI/rGO nanocomposite.
While specific benchmarking tests were not conducted as part of this study, it is important to note that the QTAIM methodology has been extensively validated and is widely recognized in the field of computational chemistry. The parameters we employed—such as electron density (ρ(r)), Laplacian of the electron density (Δ2ρ(r)), potential energy density (V(r)), Lagrangian kinetic energy (G(r)), and total energy density (H(r))—are derived using well-established computational protocols. These protocols are widely accepted in the scientific literature and have been proven reliable for analyzing systems similar to the PANI/rGO nanocomposite.
In our study, BCPs were precisely identified by locating (3, −1) critical points (CPs), which are also known as saddle points, between interacting atoms or along the paths connecting analyte atoms to the surface.75,179–181 These BCPs are critical in probing non-covalent interactions within two-fragment systems. The calculated parameters, detailed in Table 6, provide significant insights into the nature of the interactions within the PANI/rGO system.
| BCP | X–Y | ρ(r) | Δ2ρ(r) | V(r) | G(r) | |V(r)|/G(r) | H(r) |
|---|---|---|---|---|---|---|---|
| 164 | 91(C)–40(C) | 0.000274 | 0.001532 | −0.000132 | 0.000257 | −0.511626 | 0.000126 |
| 175 | 54(O)–97(C) | 0.005454 | 0.018768 | −0.003213 | 0.003952 | −0.812856 | 0.000740 |
| 247 | 100(C)–32(C) | 0.004964 | 0.000702 | −0.002328 | 0.003031 | −0.768261 | 0.000702 |
| 248 | 100(C)–33(C) | 0.004954 | 0.015022 | −0.002333 | 0.003044 | −0.766277 | 0.000711 |
| 274 | 102(N)–21(C) | 0.004138 | 0.012777 | −0.002290 | 0.002742 | −0.835106 | 0.000452 |
| 284 | 125(H)–88(O) | 0.041559 | 0.176644 | −0.041626 | 0.042893 | −0.970443 | 0.001268 |
The strength of intermolecular bonds between PANI and rGO was further investigated by classifying the interactions based on Δ2ρ(r) and H(r) values. Positive and negative values of these parameters correspond to weak and strong interactions, respectively. A negative H(r) combined with a positive Δ2ρ(r) indicates medium-strength interactions.182 As shown in Table 6, ρ(r) values with positive Δ2ρ(r) are indicative of hydrogen bond interactions, as seen in the interaction between 125(H) and 88(O). Furthermore, the analysis revealed a strong tendency for rGO to interact closely with the nitrogen (N) atoms of PANI, evidenced by the BCP between 274![[thin space (1/6-em)]](https://www.rsc.org/images/entities/char_2009.gif) :
:![[thin space (1/6-em)]](https://www.rsc.org/images/entities/char_2009.gif) 102(N) and 21(C). The ratio |V(r)|V(r), which is less than 1, indicates that the electron's tendency to combine (represented by V(r)) is outweighed by their propensity to disperse (represented by G(r)). This ratio suggests that the interactions between PANI and rGO are predominantly electrostatic in nature.182 The application of well-established QTAIM methodologies, combined with adherence to rigorous computational protocols, ensures the robustness and reliability of our findings. Consequently, the insights gained into the bonding interactions within the PANI/rGO system provide valuable contributions to the advancement of nanocomposite technologies.
102(N) and 21(C). The ratio |V(r)|V(r), which is less than 1, indicates that the electron's tendency to combine (represented by V(r)) is outweighed by their propensity to disperse (represented by G(r)). This ratio suggests that the interactions between PANI and rGO are predominantly electrostatic in nature.182 The application of well-established QTAIM methodologies, combined with adherence to rigorous computational protocols, ensures the robustness and reliability of our findings. Consequently, the insights gained into the bonding interactions within the PANI/rGO system provide valuable contributions to the advancement of nanocomposite technologies.
4. Conclusion
In the present work, we achieved the successful synthesis of PANI/rGO nanocomposites through an in situ chemical polymerization process facilitated by a deep eutectic solvent (DES) serving as an electrolyte. A thorough investigation was conducted, integrating response surface methodology (RSM), artificial neural networks (ANN), and molecular simulation techniques for the comprehensive modeling, optimization, and characterization of PANI/rGO nanocomposites. The collaborative implementation of optimization methods and meticulous characterization uncovered profound insights into the multifaceted characteristics of these nanocomposites. From this integrative approach, several key outcomes have emerged:• RSM analysis elucidated the impact of APS/ANI molar ratio, rGO loading, and polymerization time on electrical conductivity, culminating in a second-order polynomial function. Optimal conditions for maximum electrical conductivity were identified as an APS/ANI molar ratio of 0.75, 3 wt% rGO loading, and a 6-hour polymerization time, yielding a high conductivity of 4.975 × 10⁻³ S cm−1. ANN analysis exhibited enhanced conductivity of 4.988 × 10⁻³ S cm−1, showcasing the superior predictive accuracy of the ANN model over RSM.
• Comprehensive characterization through UV-vis, PL, Raman, FTIR, and XRD elucidated significant structural changes in PANI/rGO nanocomposites, emphasizing the transformative impact of rGO on PANI.
• XPS analysis unveiled distinctive elemental compositions, with the deconvolution of C 1s spectra highlighting intensified C–N peaks in PANI/rGO, indicating a denser nanocomposite coating and promising structural enhancements.
• Electrochemical studies through cyclic voltammetry showcased superior capacitance in PANI/rGO, reaching an impressive 145.79 F g−1, surpassing individual PANI or rGO components.
• TGA analysis affirmed the enhanced thermal stability of PANI/rGO, with decomposition temperatures notably higher than pure PANI, attributed to synergistic covalent bonding and substantial π–π stacking forces.
• Molecular-level insights through FMO, COSMO-RS, NCI, and QTAIM analyses provided a nuanced understanding of the PANI–rGO system, highlighting the dominant role of van der Waals forces in nanocomposite formation and stability.
To sum up, this study presents an innovative approach for fabricating multifunctional PANI/rGO nanocomposites, highlighting their potential in applications such as supercapacitors and gas sensors. These nanocomposites offer significant promise for advancing materials and promoting eco-friendly innovations. Future research should focus on the long-term stability and performance of PANI/rGO nanocomposites under various environmental conditions, scalable synthesis methods for industrial production, functionalization and doping to enhance specific properties, advanced characterization techniques for deeper insights, integrating PANI/rGO with other materials to develop hybrid systems, and conducting theoretical and computational studies to predict material behavior and design new composites. These efforts will pave the way for utilizing PANI/rGO nanocomposites in advanced energy storage devices, environmental sensors, and next-generation electronic materials.
However, several limitations need to be addressed for successful industrial application. Reproducibility at a larger scale is challenging due to variations in DES composition and the need for precise control over reaction conditions. Scaling up requires maintaining uniform temperature, mixing conditions, and reaction times. The use of specialized chemicals may increase costs and pose availability issues. While DES is more environmentally friendly than conventional solvents, its potential toxicity and environmental impact require thorough evaluation. The dual optimization strategy adds complexity, requiring specialized knowledge and resources. Additionally, the long-term stability of the nanocomposites under various environmental conditions needs further investigation.
This study presents a novel and superior method for synthesizing PANI/rGO nanocomposites, addressing gaps in existing literature and offering a comprehensive optimization strategy for enhanced electrical conductivity. Addressing these limitations is crucial for the successful industrial application of these promising materials.
Author contributions
Conceptualization and methodology (A. B., Z. G., N. H., M. B., Y. B.); validation (A. B., Z. G., N. H., M. B., I. L., I. B., O. M., S. I. A., M. A., Y. B.); formal analysis (A. B., I. L., I. B., O. M., S. I. A.); investigation (A. B., Z. G., N. H., M. B., O. M., Y. B.); resources (Y. B., M. A.); writing – original draft (A. B., Z. G., N. H., M. B., Y. B.); writing – review & editing (A. B., Z. G., N. H., M. B., I. L., I. B., O. M., S. I. A., M. A., Y. B.); visualization (A. B., Y. B.); supervision (Z. G., N. H., M. B., Y. B.); project administration (Z. G., N. H., M. B., M. A., Y. B.); funding acquisition (M. A.).Data availability
The data supporting the findings of this study are available within the article and its ESI.†Conflicts of interest
There are no conflicts to declare.Acknowledgements
The authors are grateful for the support received from the Laboratory of Electrochemistry-Corrosion, Metallurgy and Inorganic Chemistry, Faculty of Chemistry, USTHB, BP 32 El-Alia,16111 Algiers, Algeria, the Ministry of Higher Education and Scientific Research, Ferhat ABBAS Setif 1 University, and the Directorate General for Scientific Research and Technological Development (DGRSDT), Algeria. The authors acknowledge the generous support of the researchers supporting project number (RSP-2024/R113), King Saud University, Riyadh, Saudi Arabia.References
- A. Boublia, Z. Guezzout, N. Haddaoui, M. Badawi, A. S. Darwish, T. Lemaoui, S. E. I. Lebouachera, K. K. Yadav, M. A. Alreshidi, J. S. Algethami, M. Abbas, F. Banat, I. M. AlNashef, B. H. Jeon and Y. Benguerba, Crit. Rev. Solid State Mater. Sci., 2023, 0, 1–25 CrossRef.
- H. D. Kyomuhimbo and U. Feleni, Electroanalysis, 2023, 35, e202100636 CrossRef CAS.
- T. Sen, S. Mishra and N. G. Shimpi, RSC Adv., 2016, 6, 42196–42222 RSC.
- H. N. Heme, M. S. N. Alif, S. M. S. M. Rahat and S. B. Shuchi, J. Energy Storage, 2021, 42, 103018 CrossRef.
- X. Hong, J. Fu, Y. Liu, S. Li, X. Wang, W. Dong and S. Yang, Materials, 2019, 12, 1451 CrossRef CAS PubMed.
- H. Chen, F. Zhuo, J. Zhou, Y. Liu, J. Zhang, S. Dong, X. Liu, A. Elmarakbi, H. Duan and Y. Fu, Chem. Eng. J., 2023, 464, 142576 CrossRef CAS.
- Y. Zhang, X. Chen, H. Chen, M. Jia, H. Cai, Z. Mao and Y. Bai, Chem. Eng. J., 2023, 470, 143912 CrossRef CAS.
- A. K. Geim and K. S. Novoselov, Nanosci. Nanotechnol., 2009, 6, 11–19 Search PubMed.
- Y. Zhu, S. Murali, W. Cai, X. Li, J. W. Suk, J. R. Potts and R. S. Ruoff, Adv. Mater., 2010, 22, 3906 CrossRef CAS PubMed.
- M. Sabet, H. Soleimani and S. Hosseini, J. Vinyl Addit. Technol., 2018, 24, E177–E185 CAS.
- M. D. Stoller, S. Park, Y. Zhu, J. An and R. S. Ruoff, Nano Lett., 2008, 8, 3498–3502 CrossRef CAS PubMed.
- D. S. L. Abergel, V. Apalkov, J. Berashevich, K. Ziegler and T. Chakraborty, Adv. Phys., 2010, 59, 261–482 CrossRef CAS.
- N. A. Kumar and J. B. Baek, Chem. Commun., 2014, 50, 6298–6308 RSC.
- K. S. Novoselov, et al. , Science, 2016, 306, 666–669 CrossRef PubMed.
- L. Wang, X. Lu, S. Lei and Y. Song, J. Mater. Chem. A, 2014, 2, 4491–4509 RSC.
- A. M. Díez-Pascual and J. A. Luceño-Sánchez, Polymers, 2021, 13, 2105 CrossRef PubMed.
- L. Chen, N. Li, X. Yu, S. Zhang, C. Liu, Y. Song, Z. Li, S. Han, W. Wang, P. Yang, N. Hong, S. Ali and Z. Wang, Chem. Eng. J., 2023, 462, 142139 CrossRef CAS.
- F. Kazemi, S. M. Naghib, Y. Zare and K. Y. Rhee, Polym. Rev., 2021, 61, 553–597 CrossRef CAS.
- A. Ladrón-de-Guevara, A. Boscá, J. Pedrós, E. Climent-Pascual, A. de Andrés, F. Calle and J. Martínez, Appl. Surf. Sci., 2019, 467–468, 691–697 CrossRef.
- M. K. Ali, A. Hessein, M. A. Hassan, M. Ghali, N. M. Shaalan, K. Nakamura and A. A. El-Moneim, J. Appl. Polym. Sci., 2021, 138, 50852 CrossRef CAS.
- M. Mitra, C. Kulsi, K. Chatterjee, K. Kargupta, S. Ganguly, D. Banerjee and S. Goswami, RSC Adv., 2015, 5, 31039–31048 RSC.
- V. H. N. Martins, N. M. S. Siqueira, J. E. S. Fonsaca, S. H. Domingues and V. H. R. Souza, ACS Appl. Nano Mater., 2021, 4, 5553–5563 CrossRef CAS.
- X. Huang, N. Hu, R. Gao, Y. Yu, Y. Wang, Z. Yang, E. Siu-Wai Kong, H. Wei and Y. Zhang, J. Mater. Chem., 2012, 22, 22488–22495 RSC.
- J. Chang, X. Zhang, Z. Wang, C. Li, Q. Hu, J. Gao and L. Feng, ACS Appl. Nano Mater., 2021, 4, 5263–5272 CrossRef CAS.
- N. Zhao, Z. Ma, H. Song, D. Wang and Y. Xie, Int. J. Hydrogen Energy, 2018, 43, 17867–17872 CrossRef CAS.
- N. P. S. Chauhan, M. Mozafari, N. S. Chundawat, K. Meghwal, R. Ameta and S. C. Ameta, J. Ind. Eng. Chem., 2016, 36, 13–29 CrossRef CAS.
- N. Gao, J. Yu, S. Chen, X. Xin and L. Zang, Synth. Met., 2021, 273, 116693 CrossRef CAS.
- N. Gospodinova and L. Terlemezyan, Prog. Polym. Sci., 1998, 23, 1443–1484 CrossRef CAS.
- G. Ciric-Marjanovic, Synth. Met., 2013, 177, 1–47 CrossRef CAS.
- A. Boublia, Z. Guezzout, N. Haddaoui, M. Badawi, A. S. Darwish, T. Lemaoui, F. Banat, K. K. Yadav, B. H. Jeon, N. Elboughdiri, Y. Benguerba and I. M. Al Nashef, J. Mater. Chem. A, 2023, 12, 2209–2236 RSC.
- A. L. Pang, A. Arsad and M. Ahmadipour, Polym. Adv. Technol., 2021, 32, 1428–1454 CrossRef CAS.
- S. Ameen, M. Shaheer Akhtar and M. Husain, Sci. Adv. Mater., 2010, 2, 441–462 CrossRef CAS.
- H. Sharifi, M. Zabihzadeh and M. Ghorbani, Carbohydr. Polym., 2018, 194, 384–394 CrossRef CAS PubMed.
- A. Boublia, S. E. I. Lebouachera, N. Haddaoui, Z. Guezzout, M. A. Ghriga, M. Hasanzadeh, Y. Benguerba and N. Drouiche, Polym. Bull., 2023, 80, 5999–6031, DOI:10.1007/s00289-022-04398-6.
- C. H. B. Silva, M. Iliut, C. Muryn, C. Berger, Z. Coldrick, V. R. L. Constantino, M. L. A. Temperini and A. Vijayaraghavan, Beilstein J. Nanotechnol., 2018, 9, 2936–2946 CrossRef CAS PubMed.
- S. L. C. Ferreira, R. E. Bruns, H. S. Ferreira, G. D. Matos, J. M. David, G. C. Brandão, E. G. P. da Silva, L. A. Portugal, P. S. dos Reis, A. S. Souza and W. N. L. dos Santos, Anal. Chim. Acta, 2007, 597, 179–186 CrossRef CAS PubMed.
- N. Szpisják-Gulyás, A. N. Al-Tayawi, Z. H. Horváth, Z. László, S. Kertész and C. Hodúr, Acta Aliment., 2023, 52, 521–537 Search PubMed.
- J. M. Zurada, Data mining with computational intelligence, Springer Science & Business Media, 2006, vol. 17 Search PubMed.
- I. M. Savic, D. G. Gajic and I. M. Savic-Gajic, Artif. Neural Networks New Res., 2017, 17, 1–24 Search PubMed.
- M. Abd Elaziz, A. Dahou, L. Abualigah, L. Yu, M. Alshinwan, A. M. Khasawneh and S. Lu, Neural Comput. Appl., 2021, 33, 14079–14099 CrossRef.
- J. Neugebauer and T. Hickel, Wiley Interdiscip. Rev. Comput. Mol. Sci., 2013, 3, 438–448 CrossRef CAS PubMed.
- Y. Qiao, M. Luo, Q. Yin, Y. Wang and G. Zhou, Macromol. Theory Simul., 2023, 32, 2300023 CrossRef CAS.
- I. B. Obot, D. D. Macdonald and Z. M. Gasem, Corros. Sci., 2015, 99, 1–30 CrossRef CAS.
- B. A. Farooqi, M. Yar, A. Ashraf, U. Farooq and K. Ayub, Eur. Polym. J., 2020, 138, 109981 CrossRef CAS.
- X. Zheng, M. E. Ali Mohsin, A. Arsad and A. Hassan, J. Appl. Polym. Sci., 2021, 138, 50637 CrossRef CAS.
- E. J. Jelmy, S. Ramakrishnan, S. Devanathan, M. Rangarajan and N. K. Kothurkar, J. Appl. Polym. Sci., 2013, 130, 1047–1057 CrossRef CAS.
- M. Reza, N. Srikandi, A. N. Amalina, D. P. Benu, F. V. Steky, A. Rochliadi and V. Suendo, IOP Conference Series: Materials Science and Engineering, IOP Publishing, 2019, vol. 599, p. 12002 Search PubMed.
- H. Nazari and R. Arefinia, Int. J. Polym. Anal. Charact., 2019, 24, 178–190 CrossRef CAS.
- P. N. Adams, P. J. Laughlin, A. P. Monkman and A. M. Kenwright, Polymer, 1996, 37, 3411–3417 CrossRef CAS.
- M. M. Rahman, T. Mahtab, M. Z. Bin Mukhlish, M. O. Faruk and M. M. Rahman, Polym. Bull., 2021, 78, 5379–5397 CrossRef CAS.
- Y. Cao, A. Andreatta, A. J. Heeger and P. Smith, Polymer, 1989, 30, 2305–2311 CrossRef CAS.
- I. Sapurina and J. Stejskal, Polym. Int., 2008, 57, 1295–1325 CrossRef CAS.
- P. P. Sengupta and B. Adhikari, Mater. Sci. Eng., A, 2007, 459, 278–285 CrossRef.
- G. M. Neelgund and A. Oki, Polym. Int., 2011, 60, 1291–1295 CrossRef CAS.
- O. A. Al-Hartomy, S. Khasim, A. Roy and A. Pasha, Appl. Phys. A: Mater. Sci. Process., 2019, 125, 1–9 CrossRef CAS.
- V. G. Sreeja, G. Vinitha, R. Reshmi, M. K. Jayaraj and E. I. Anila, Mater. Today Proc., 2019, 10, 456–465 CrossRef CAS.
- F. Yilmaz and Z. Küçükyavuz, E-Polymers, 2009, 9, 1–10 Search PubMed.
- A. M. Díez-Pascual, Polymers, 2021, 13, 1–15 Search PubMed.
- Z. Guezzout, A. Boublia and N. Haddaoui, J. Polym. Res., 2023, 30, 1–16 CrossRef.
- F. Usman, J. O. Dennis, K. C. Seong, A. Yousif Ahmed, F. Meriaudeau, O. B. Ayodele, A. R. Tobi, A. A. S. Rabih and A. Yar, Results Phys., 2019, 15, 102690 CrossRef.
- V. H. Nguyen, C. Lamiel, D. Kharismadewi, V. C. Tran and J. J. Shim, J. Electroanal. Chem., 2015, 758, 148–155 CrossRef CAS.
- H. K. Ismail, H. F. Alesary and M. Q. Mohammed, J. Polym. Res., 2019, 26, 1–12 CrossRef CAS.
- M. Mitra, S. T. Ahamed, A. Ghosh, A. Mondal, K. Kargupta, S. Ganguly and D. Banerjee, ACS Omega, 2019, 4, 1623–1635 CrossRef CAS PubMed.
- H. Habib, I. S. Wani and S. Husain, J. Energy Storage, 2022, 55, 105732 CrossRef.
- O. Okhay and A. Tkach, Nanomaterials, 2022, 12, 2531 CrossRef CAS PubMed.
- K. Hornik, M. Stinchcombe and H. White, Neural Networks, 1989, 2, 359–366 CrossRef.
- M. Pirdashti, S. Curteanu, M. H. Kamangar, M. H. Hassim and M. A. Khatami, Rev. Chem. Eng., 2013, 29, 205–239 CAS.
- A. Susaimanickam, P. Manickam and A. A. Joseph, Arch. Comput. Methods Eng., 2023, 30, 4831–4853 CrossRef.
- U. Shankar, R. Gogoi, S. K. Sethi and A. Verma, Lecture Notes in Applied and Computational Mechanics, Springer, 2022, vol. 99, pp. 299–313 Search PubMed.
- D. Bousba, C. Sobhi, E. Zouaoui, K. Rouibah, A. Boublia, H. Ferkous, A. Haddad, A. Gouasmia, I. Avramova, Z. Mohammed, V. I. Parvulescu, K. K. Yadav, M. Hasan, M. M. S. Cabral-Pinto, N. Elboughdiri and Y. Benguerba, Energy Convers. Manage., 2024, 300, 118021 CrossRef CAS.
- T. Zhang, Q. Xue, S. Zhang and M. Dong, Nano Today, 2012, 7, 180–200 CrossRef CAS.
- T. Yasmin, A. Mahmood, M. Farooq, U. Rehman, R. M. Sarfraz, H. Ijaz, M. R. Akram, A. Boublia, M. M. Salem Bekhit, B. Ernst and Y. Benguerba, Int. J. Biol. Macromol., 2023, 253, 127032 CrossRef CAS PubMed.
- K. A. Moltved and K. P. Kepp, Chem. Phys. Chem., 2019, 20, 3210–3220 CrossRef CAS PubMed.
- N. Ramdane, Z. Marsa, A. Delimi, A. Sedik, A. Boublia, G. S. Albakri, M. Abbas, K. Kumar Yadav, M. Gabsi, A. Djedouani, K. O. Rachedi, L. Toukal, H. Benzouid, M. Berredjem, H. Ferkous and Y. Benguerba, Inorg. Chem. Commun., 2024, 165, 112479 CrossRef CAS.
- Z. Jebali, H. Ferkous, M. Zerroug, A. Boublia, A. Delimi, A. Bouzid, H. Majdoub, B. Ernst, N. Elboughdiri and Y. Benguerba, J. Environ. Chem. Eng., 2024, 12, 112374 CrossRef CAS.
- T. Himeur, K. Rouibah, H. Ferkous, A. Boublia, K. O. Rachedi, K. Harouche, C. Boulechfar, A. Abdennouri and Y. Benguerba, Process Saf. Environ. Prot., 2024, 187, 1422–1445 CrossRef CAS.
- I. Kaabi, S. Amamra, T. Douadi, M. Al-Noaimi, N. Chafai, A. Boublia, M. Albrahim, N. Elboughdiri and Y. Benguerba, J. Taiwan Inst. Chem. Eng., 2024, 161, 105535 CrossRef CAS.
- A. Mouffok, D. Bellouche, I. Debbous, A. Anane, Y. Khoualdia, A. Boublia, A. S. Darwish, T. Lemaoui and Y. Benguerba, J. Mol. Liq., 2023, 375, 121321 CrossRef CAS.
- D. Uka, B. Blagojević, O. Alioui, A. Boublia, N. Elboughdiri, Y. Benguerba, T. Jurić and B. M. Popović, J. Mol. Liq., 2023, 391, 123411 CrossRef CAS.
- A. Mouffok, A. Boublia, D. Bellouche, S. D. Zed, N. Tabhirt, M. Alam, B. Ernst and Y. Benguerba, Int. J. Environ. Health Res., 2024, 1–22 CrossRef PubMed.
- T. Lemaoui, A. Boublia, A. S. Darwish, M. Alam, S. Park, B. H. Jeon, F. Banat, Y. Benguerba and I. M. Alnashef, ACS Omega, 2022, 7, 32194–32207 CrossRef CAS PubMed.
- A. Boublia, T. Lemaoui, J. AlYammahi, A. S. Darwish, A. Ahmad, M. Alam, F. Banat, Y. Benguerba and I. M. AlNashef, ACS Sustain. Chem. Eng., 2023, 11, 208–227 CrossRef CAS.
- A. Boublia, T. Lemaoui, F. Abu Hatab, A. S. Darwish, F. Banat, Y. Benguerba and I. M. AlNashef, J. Mol. Liq., 2022, 366, 120225 CrossRef CAS.
- T. Lemaoui, A. Boublia, S. Lemaoui, A. S. Darwish, B. Ernst, M. Alam, Y. Benguerba, F. Banat and I. M. AlNashef, ACS Sustainable Chem. Eng., 2023, 11, 9564–9580 CrossRef CAS.
- J. AlYammahi, A. S. Darwish, T. Lemaoui, A. Boublia, Y. Benguerba, I. M. AlNashef and F. Banat, ACS Omega, 2023, 8, 26533–26547 CrossRef CAS PubMed.
- D. R. Dreyer, S. Park, C. W. Bielawski and R. S. Ruoff, Chem. Soc. Rev., 2010, 39, 228–240 RSC.
- S. K. Saha, M. Murmu, N. C. Murmu and P. Banerjee, J. Mol. Liq., 2022, 364, 120033 CrossRef CAS.
- E. R. Johnson, S. Keinan, P. Mori-Sánchez, J. Contreras-García, A. J. Cohen and W. Yang, J. Am. Chem. Soc., 2010, 132, 6498–6506 CrossRef CAS PubMed.
- Y. Islam Touahria, N. Chafai, O. Moumeni, A. Boublia, M. Mehri and Y. Benguerba, J. Mol. Liq., 2024, 403, 124897 CrossRef CAS.
- S. Mandal, S. Bej and P. Banerjee, J. Mol. Liq., 2023, 381, 121789 CrossRef CAS.
- A. Boutouil, M. R. Laamari, I. Elazhary, L. Bahsis, H. Anane and S. E. Stiriba, Mater. Chem. Phys., 2020, 241, 122420 CrossRef CAS.
- S. G. Balasubramani, G. P. Chen, S. Coriani, M. Diedenhofen, M. S. Frank, Y. J. Franzke, F. Furche, R. Grotjahn, M. E. Harding, C. Hättig, A. Hellweg, B. Helmich-Paris, C. Holzer, U. Huniar, M. Kaupp, A. Marefat Khah, S. Karbalaei Khani, T. Müller, F. Mack, B. D. Nguyen, S. M. Parker, E. Perlt, D. Rappoport, K. Reiter, S. Roy, M. Rückert, G. Schmitz, M. Sierka, E. Tapavicza, D. P. Tew, C. Van Wüllen, V. K. Voora, F. Weigend, A. Wodyński and J. M. Yu, J. Chem. Phys., 2020, 152, 184107 CrossRef CAS PubMed.
- T. Lu and F. Chen, J. Comput. Chem., 2012, 33, 580–592 CrossRef CAS PubMed.
- W. Humphrey, A. Dalke and K. Schulten, J. Mol. Graphics, 1996, 14, 33–38 CrossRef CAS PubMed.
- C. Williams and T. Kelley, http://http//www.gnuplot.info.
- B. Qiu, J. Wang, Z. Li, X. Wang and X. Li, Polymers, 2020, 12, 310 CrossRef CAS PubMed.
- Y. Zhou, C. Ding, X. Qian and X. An, Carbohydr. Polym., 2015, 115, 670–676 CrossRef CAS PubMed.
- M. O. Ansari, M. M. Khan, S. A. Ansari, I. Amal, J. Lee and M. H. Cho, Chem. Eng. J., 2014, 242, 155–161 CrossRef CAS.
- D. Li, M. B. Müller, S. Gilje, R. B. Kaner and G. G. Wallace, Nat. Nanotechnol., 2008, 3, 101–105 CrossRef CAS PubMed.
- S. Bhattacharya, A. Ghorai, S. Raval, M. Karmakar, A. Midya, S. K. Ray and P. K. Datta, Carbon, 2018, 134, 80–91 CrossRef CAS.
- J. Abd Razak, H. Hasib, N. A. Khalid, N. Mohamad, M. A. Mahamood, M. S. Mohd Suan and M. M. Ismail, Influence of Graphene Nanoplatelets Loading into Physical and Morphological Characteristics of Polyaniline Nanocomposites, Springer, Singapore, 2021, vol. 1 Search PubMed.
- Y. C. Lin, F. H. Hsu and T. M. Wu, Synth. Met., 2013, 184, 29–34 CrossRef CAS.
- Y. Lu, Y. Song and F. Wang, Mater. Chem. Phys., 2013, 138, 238–244 CrossRef CAS.
- D. Geethalakshmi, N. Muthukumarasamy and R. Balasundaraprabhu, Optik, 2014, 125, 1307–1310 CrossRef CAS.
- R. B. Choudhary and A. Verma, Opt. Mater., 2019, 96, 109310 CrossRef CAS.
- R. Kandulna, R. B. Choudhary and R. Singh, J. Inorg. Organomet. Polym. Mater., 2019, 29, 730–744 CrossRef CAS.
- S. Konwer, J. Mater. Sci.: Mater. Electron., 2016, 27, 4139–4146 CrossRef CAS.
- R. B. Choudhary and R. Kandulna, Mater. Sci. Semicond. Process., 2019, 94, 86–96 CrossRef CAS.
- N. Chaudhary, M. Khanuja and S. S. Islam, Polymer, 2019, 165, 168–173 CrossRef CAS.
- S. Banerjee, S. Sarmah and A. Kumar, J. Opt., 2009, 38, 124–130 CrossRef.
- W. I. Singh, S. Sinha, N. A. Devi, S. Nongthombam, S. Laha and B. P. Swain, Arab. J. Sci. Eng., 2022, 47, 925–934 CrossRef CAS.
- Q. Lai, S. Zhu, X. Luo, M. Zou and S. Huang, AIP Adv., 2012, 2, 032146 CrossRef.
- F. G. Souza, L. Sirelli, R. C. Michel, B. G. Soares and M. H. Herbst, J. Appl. Polym. Sci., 2006, 102, 535–541 CrossRef CAS.
- D. Maruthamani, D. Divakar, M. Harshavardhan and M. Kumaravel, J. Chem. Pharm. Res., 2016, 8, 236–244 CAS.
- J. Bin Wu, M. L. Lin, X. Cong, H. N. Liu and P. H. Tan, Chem. Soc. Rev., 2018, 47, 1822–1873 RSC.
- Z. S. Wu, W. Ren, L. Gao, J. Zhao, Z. Chen, B. Liu, D. Tang, B. Yu, C. Jiang and H. M. Cheng, ACS Nano, 2009, 3, 411–417 CrossRef CAS PubMed.
- M. Kim, C. Lee and J. Jang, Adv. Funct. Mater., 2014, 24, 2489–2499 CrossRef CAS.
- K. Kurniasari, A. Maulana, A. Y. Nugraheni, D. N. Jayanti, S. Mustofa, M. A. Baqiya and D. Darminto, IOP Conference Series: Materials Science and Engineering, IOP Publishing, 2017, vol. 196, p. 12021 Search PubMed.
- H. Wang, Q. Hao, X. Yang, L. Lu and X. Wang, Nanoscale, 2010, 2, 2164–2170 RSC.
- G. Louarn, M. Lapkowski, S. Quillard, A. Pron, J. P. Buisson and S. Lefrant, J. Phys. Chem., 1996, 100, 6998–7006 CrossRef CAS.
- G. Niaura, R. Mažeikiene and A. Malinauskas, Synth. Met., 2004, 145, 105–112 CrossRef CAS.
- R. R. Salunkhe, S. H. Hsu, K. C. W. Wu and Y. Yamauchi, ChemSusChem, 2014, 7, 1551–1556 CrossRef CAS PubMed.
- M. Jain and S. Annapoorni, Synth. Met., 2010, 160, 1727–1732 CrossRef CAS.
- J. E. Pereira Da Silva, D. L. A. De Faria, S. I. Córdoba De Torresi and M. L. A. Temperini, Macromolecules, 2000, 33, 3077–3083 CrossRef CAS.
- V. Kumar, R. K. Gupta, R. K. Gundampati, D. K. Singh, S. Mohan, S. H. Hasan and M. Malviya, RSC Adv., 2018, 8, 619–631 RSC.
- A. Mostafaei and A. Zolriasatein, Prog. Nat. Sci. Mater. Int., 2012, 22, 273–280 CrossRef.
- R. Jain, A. Sinha, N. Kumari and A. L. Khan, Anal. Methods, 2016, 8, 3034–3045 RSC.
- S. M. Imran, Y. Kim, G. N. Shao, M. Hussain, Y. H. Choa and H. T. Kim, J. Mater. Sci., 2014, 49, 1328–1335 CrossRef CAS.
- L. Wang, Y. Ye, X. Lu, Z. Wen, Z. Li, H. Hou and Y. Song, Sci. Rep., 2013, 3, 5019–5026 Search PubMed.
- N. Gospodinova, L. Terlemezyan, P. Mokreva and K. Kossev, Polymer, 1993, 34, 2434–2437 CrossRef CAS.
- L. Vinet and A. Zhedanov, A ‘missing’ family of classical orthogonal polynomials, Springer Science & Business Media, 2011, vol. 44 Search PubMed.
- J. Yan, T. Wei, Z. Fan, W. Qian, M. Zhang, X. Shen and F. Wei, J. Power Sources, 2010, 195, 3041–3045 CrossRef CAS.
- A. Moyseowicz and G. Gryglewicz, Composites, Part B, 2019, 159, 4–12 CrossRef CAS.
- Y. Yu, A. Xu, Y. Zhang, Z. Zhao, S. Ye and Y. Qin, Electrochim. Acta, 2023, 454, 1–9 CrossRef.
- Y. Li, Z. Xia, Q. Gong, X. Liu, Y. Yang, C. Chen and C. Qian, Nanomaterials, 2020, 10, 1–18 Search PubMed.
- C. Vallés, P. Jiménez, E. Muñoz, A. M. Benito and W. K. Maser, J. Phys. Chem. C, 2011, 115, 10468–10474 CrossRef.
- L. Q. Xu, Y. L. Liu, K. G. Neoh, E. T. Kang and G. D. Fu, Macromol. Rapid Commun., 2011, 32, 684–688 CrossRef CAS PubMed.
- Y. Zou, Z. Zhang, W. Zhong and W. Yang, J. Mater. Chem. A, 2018, 6, 9245–9256 RSC.
- A. Fujimoto, Y. Yamada, M. Koinuma and S. Sato, Anal. Chem., 2016, 88, 6110–6114 CrossRef CAS PubMed.
- M. Shabani-Nooshabadi and F. Zahedi, Electrochim. Acta, 2017, 245, 575–586 CrossRef CAS.
- F. Balqis, B. Prakoso, N. Hanif Hawari, C. Eldona and A. Sumboja, ChemNanoMat, 2022, 8, e202200151 CrossRef CAS.
- V. A. Veloso, D. L. Silva, P. L. Gastelois, C. A. Furtado and A. P. Santos, Mater. Chem. Phys., 2022, 285, 126162 CrossRef CAS.
- G. G. Gebreegziabher, A. S. Asemahegne, D. W. Ayele, M. Dhakshnamoorthy and A. Kumar, Mater. Today Chem., 2019, 12, 233–239 CrossRef CAS.
- J. Park, X. Yang, D. Wickramasinghe, M. Sundhoro, N. Orbey, K. F. Chow and M. Yan, RSC Adv., 2020, 10, 26486–26493 RSC.
- M. Li, W. Yin, X. Han and X. Chang, J. Solid State Electrochem., 2016, 20, 1941–1948 CrossRef CAS.
- Y. Li and Y. Zheng, J. Appl. Polym. Sci., 2018, 135, 1–8 Search PubMed.
- B. Gupta, N. Kumar, K. Panda, A. A. Melvin, S. Joshi and S. Dash, Adv. Mater. Interfaces, 2016, 3, 1600161 CrossRef.
- W. Y. Ching and P. Rulis, Electronic Structure Methods for Complex Materials: The orthogonalized linear combination of atomic orbitals, OUP Oxford, 2012, vol. 9780199575800 Search PubMed.
- F. E. Harris, Adv. Quantum Chem., 1967, 3, 61–127 CrossRef CAS.
- T. Clark, R. Koch, T. Clark and R. Koch, Chem. Electron. B. Orbitals, 1999, 5–22 Search PubMed.
- H. Bock, Angew. Chem., Int. Ed. Engl., 1977, 16, 613–637 CrossRef.
- D. C. Fredrickson, Bond through Code, 2020, 55–76 Search PubMed.
- C. Boulechfar, H. Ferkous, A. Delimi, M. Berredjem, A. Kahlouche, A. Madaci, S. Djellali, S. Boufas, A. Djedouani, A. Errachid, A. Ali Khan, A. Boublia, T. Lemaoui and Y. Benguerba, J. Mol. Liq., 2023, 378, 121637 CrossRef CAS.
- O. Moumeni, M. Mehri, R. Kerkour, A. Boublia, F. Mihoub, K. Rebai, A. A. Khan, A. Erto, A. S. Darwish, T. Lemaoui, N. Chafai and Y. Benguerba, J. Taiwan Inst. Chem. Eng., 2023, 147, 104918 CrossRef CAS.
- A. Boublia, N. Elboughdiri, J. Georgin, K. K. Yadav, D. Ghernaout, D. S. P. Franco, M. Benaissa, A. A. M. Salih, M. Albrahim, M. S. Hamdy and Y. Benguerba, Process Saf. Environ. Prot., 2024, 188, 385–397 CrossRef CAS.
- N. Elboughdiri, H. Ferkous, K. Rouibah, A. Boublia, A. Delimi, K. K. Yadav, A. Erto, D. Ghernaout, A. A. M. Salih, M. Benaissa and Y. Benguerba, Int. J. Mol. Sci., 2024, 25 Search PubMed.
- N. Elboughdiri, I. Lakikza, A. Boublia, S. I. Aouni, N. El Houda Hammoudi, J. Georgin, D. S. P. Franco, H. Ferkous, D. Ghernaout and Y. Benguerba, Process Saf. Environ. Prot., 2024, 186, 995–1010 CrossRef CAS.
- A. Neni, A. Boublia, M. Bouras, K. Bentoumi, M. Albrahim, N. Elboughdiri and Y. Benguerba, J. Mol. Liq., 2024, 407, 125272 CrossRef CAS.
- N. Mouats, S. Djellali, H. Ferkous, A. Sedik, A. Delimi, A. Boublia, K. O. Rachedi, M. Berredjem, A. Çukurovali, M. Alam, B. Ernsti and Y. Benguerba, ACS Omega, 2024, 9, 27945–27962 CrossRef CAS PubMed.
- H. Ferkous, A. Sedik, A. Delimi, R. Redjemia, K. Abdesalem, C. Boulechfar, A. Abdennouri, A. Madaci, M. Berredjem, A. Boublia, M. Sajid Ali, B. H. Jeon, K. Kumar Yadav and Y. Benguerba, J. Mol. Liq., 2024, 394, 123781 CrossRef CAS.
- A. E. Zemouri, E. Bentouhami, H. Zaghouane-Boudiaf, Y. I. Touahria, G. Bellil, A. Boublia, N. Daas, T. Dintzer, N. Chafai, M. Albrahim, N. Elboughdiri and Y. Benguerba, J. Environ. Chem. Eng., 2024, 12, 113000 CrossRef CAS.
- T. Lemaoui, A. S. Darwish, G. Almustafa, A. Boublia, P. R. Sarika, N. A. Jabbar, T. Ibrahim, P. Nancarrow, K. K. Yadav, A. M. Fallatah, M. Abbas, J. S. Algethami, Y. Benguerba, B. H. Jeon, F. Banat and I. M. AlNashef, Energy Storage Mater., 2023, 59, 102795 CrossRef.
- K. Paduszyński, J. Phys. Chem. B, 2018, 122, 4016–4028 CrossRef PubMed.
- A. Boublia, T. Lemaoui, G. Almustafa, A. S. Darwish, Y. Benguerba, F. Banat and I. M. AlNashef, ACS Omega, 2023, 8, 13177–13191 CrossRef CAS PubMed.
- A. Szabo and N. L. Ostlund, Modern Quantum Chemistry: Introduction to Advanced Electronic Structure Theory, Courier Corporation, 1996.
- J. Kahlen, K. Masuch and K. Leonhard, Green Chem., 2010, 12, 2172–2181 RSC.
- E. Słupek, P. Makoś-Chełstowska and J. Gębicki, Materials, 2021, 14, 1–20 CrossRef PubMed.
- M. S. Man, M. A. M. Abdullah, S. B. Abdullah and Z. Yaacob, Indian J. Sci. Technol., 2017, 10, 1–6 CrossRef CAS.
- J. J. Prías Barragán, K. Gross, J. Darío Perea, N. Killilea, W. Heiss, C. J. Brabec, H. A. Calderón and P. Prieto, ChemistrySelect, 2020, 5, 11737–11744 CrossRef.
- L. Aroui, S. Madani, I. Bousnoubra, A. Boublia, I. Lakikza, S. I. Aouni, L. Abdelouahed, E. Ernst, M. Alam and Y. Benguerba, J. Mol. Liq., 2024, 125818 CrossRef.
- C. Boulechfar, H. Ferkous, A. Delimi, A. Djedouani, A. Kahlouche, A. Boublia, A. S. Darwish, T. Lemaoui, R. Verma and Y. Benguerba, Inorg. Chem. Commun., 2023, 150, 110451 CrossRef CAS.
- Q. H. Zhang, B. S. Hou, Y. Y. Li, Y. Lei, X. Wang, H. F. Liu and G. A. Zhang, Corros. Sci., 2021, 189, 109596 CrossRef CAS.
- M. Murmu, N. C. Murmu, M. Ghosh and P. Banerjee, J. Adhes. Sci. Technol., 2022, 36, 2732–2760 CrossRef CAS.
- K. Rouibah, H. Ferkous, M. Abdessalam-Hassan, B. L. Mossab, A. Boublia, C. Pierlot, A. Abdennouri, I. Avramova, M. Alam, Y. Benguerba and A. Erto, Molecules, 2024, 29 Search PubMed.
- O. C. Adekoya, G. J. Adekoya, R. E. Sadiku, Y. Hamam and S. S. Ray, ACS Omega, 2022, 7, 33808–33820 CrossRef CAS.
- M. Gabsi, H. Ferkous, A. Delimi, A. Boublia, C. Boulechfar, A. Kahlouche, A. S. Darwish, T. Lemaoui and Y. Benguerba, Environ. Sci. Pollut. Res., 2023, 30, 59081–59105 CrossRef CAS.
- F. Fuster and S. J. Grabowski, J. Phys. Chem. A, 2011, 115, 10078–10086 CrossRef CAS PubMed.
- P. L. A. Popelier, Wiley Blackwell, 2014, 6, 9783527333, 271–308.
- S. Garg and N. Goel, J. Mol. Graph. Model., 2023, 124, 108566 CrossRef CAS PubMed.
- T. Yasmin, A. Mahmood, M. Farooq, R. M. Sarfraz, A. Boublia, U. Rehman, M. U. Ashraf, J. K. Bhutto, B. Ernst, M. Albrahim, N. Elboughdiri, K. K. Yadav, M. A. Alreshidi, H. Ijaz and Y. Benguerba, Int. J. Biol. Macromol., 2024, 268, 131832 CrossRef CAS PubMed.
- T. Yasmin, A. Mahmood, R. M. Sarfraz, U. Rehman, A. Boublia, A. M. Alkahtani, G. S. Albakri, H. Ijaz, S. Ahmed, B. Harron, M. Albrahim, N. Elboughdiri, K. K. Yadav and Y. Benguerba, Int. J. Biol. Macromol., 2024, 133468 CrossRef CAS PubMed.
- N. Sattar, H. Sajid, S. Tabassum, K. Ayub, T. Mahmood and M. A. Gilani, Sci. Total Environ, 2022, 824, 153858 CrossRef CAS PubMed.
Footnotes |
| † Electronic supplementary information (ESI) available. See DOI: https://doi.org/10.1039/d4ma00231h |
| ‡ First authorship: Abir Boublia. |
| This journal is © The Royal Society of Chemistry 2024 |

