 Open Access Article
Preparation of noble metal-free porous CuO–ceria and zirconia mixed oxide catalysts using the ammonia driven deposition precipitation method for toluene combustion†
Wouter
Van Hoey
 a,
Anna
Rokicińska
 b,
Marek
Dębosz
 b,
Izabela
Majewska
 a,
Piotr
Kuśtrowski
 b and
Pegie
Cool
 *a
*a
aLaboratory of Adsorption and Catalysis, Department of Chemistry, University of Antwerp, Universiteitsplein 1, Wilrijk B-2610, Belgium. E-mail: pegie.cool@uantwerpen.be
bDepartment of Chemical Technology, Jagiellonian University, Gronostajowa 2, Krakow 30-387, Poland
First published on 17th July 2024
Abstract
Cu-containing CexZr1−xO2 noble metal-free mixed metal oxide catalysts were obtained using a non-disclosed synthesis protocol that involves a soft template assisted hydrothermal approach for the synthesis of various CexZr1−xO2 supports and the subsequent deposition of Cu with a water-based ammonia driven deposition precipitation (ADP) method. As shown using N2-sorption, X-ray diffraction (XRD), Raman spectroscopy, UV-vis diffuse reflectance spectroscopy (UV-vis-DR) and scanning electron microscopy (SEM), varying the ratio between Ce and Zr resulted in different crystal structures, going from purely cubic CeO2 to tetragonal Ce0.25Zr0.75O2 and finally to ZrO2 with co-existing tetragonal and monoclinic crystal phases. Additionally, the introduction of zirconium to the CeO2 crystal lattice induced the formation of mesopores, yielding a larger available surface for ADP deposition of Cu. The addition of different Cu loadings had an impact on both structural and optical properties of the catalysts, as well as on their reducibility, which was examined via H2-temperature programmed reduction (H2-TPR). During testing of the catalytic performance in the combustion of toluene as a model reaction for aromatic VOC combustion, all catalysts showed extremely high selectivity towards H2O and CO2 and were more active than CuO-modified commercially available CeO2 and ZrO2 supports. The best performance was obtained over the Cu–Ce0.75Zr0.25O2 catalysts whereby the different loadings of Cu yielded nearly identical results. The high activity of these catalysts can be attributed to the successful ADP deposition and the increased amount of oxygen vacancies due to structural defects induced by the incorporation of smaller Zr4+ cations into the cubic crystal structure of ceria. The presence of oxygen vacancies was analyzed using X-ray photoelectron spectroscopy (XPS).
1. Introduction
Volatile organic compounds (VOCs), which by definition are organic compounds with a boiling point ≤250 °C at atmospheric pressure, are amongst the major contributors to global air pollution. VOCs are emitted from a wide variety of sources and play an important role in aerosol, photochemical smog and ground-level ozone formation, hence contributing to global climate change.1,2 Besides their impact on the environment, VOCs also pose a threat towards human health, since many VOCs are carcinogenic, mutagenic and teratogenic.3 Due to their toxic nature, strict regulations regarding VOC emissions have been implemented. More specifically, the European Union and its member states agreed on a new National Emissions Reduction Commitments (NEC) Directive (2016/2284/EU), which is designed to reduce the health impacts of air pollution, in comparison to 2005, by at least 50% by 2030. In order to reach this ambitious target, efficient techniques for VOC elimination from polluted air, including adsorption, membrane separation, thermal oxidation, and (photo)catalytic combustion, have attracted extensive research.4 From these methods, catalytic combustion is believed to be the most promising due to its low cost, low operational temperature (200–500 °C) and limited formation of by-products.5At present, noble metal based catalysts are considered to be the most efficient for VOC abatement.6 In particular, Pt (e.g. Pt–Co3O4,7 Pt/Ce–Al2O3,8 Pt/Eu2O3–CeO29) and Pd (e.g. Pd–CeO2,10 Pd–SiO2,11 Pd–Al2O312) based catalysts exhibit very high catalytic activity at relatively low temperatures. However, the high cost of these materials and the fact that they are prone to deactivation caused by poisoning13 or sintering,1 has led scientific research towards exploring cheaper and more easily accessible transition metal oxide based catalysts. Recent examples of interesting noble-metal-free catalysts include: Ni-doped α-MnO2,14 CuO–CeO2-nanorod,15 CuMn2O4 spinel16 and CoCe0.75Zr0.25–Ni foam monolith.17
Among the interesting catalysts regarding the VOC abatement, ceria-based materials have gained a lot of scientific attention.18 This interest comes from the fact that ceria and its related materials are omnipresent in research concerning oxidative catalytic processes, such as automotive three-way-catalysis,19,20 water–gas shift reaction21,22 and the preferential oxidation of CO (CO-PROX),23,24 due to their high redox activity and exceptional oxygen storage capacity (OSC). The latter is caused by the presence of lattice defects in the crystal structure, which induce oxygen mobility. As a result, besides Langmuir–Hinshelwood (L–H) and Eley–Rideal (E–R), the Mars–van Krevelen (MVK) mechanism, whereby lattice oxygen is involved, can also be activated in oxidation reactions.18,25
According to the literature, the OSC of the widely used ceria can be enhanced significantly by incorporating zirconium ions in the CeO2 crystal lattice. The smaller size of a Zr4+ cation (ionic radii of 0.84 Å compared to 0.97 Å for Ce4+) modifies the cubic fluorite structure of CeO2, which results in an enhanced OSC and oxygen mobility, improving the redox properties of the material.26,27 Moreover, the addition of zirconia also improves the thermal stability of ceria.27,28
In order to further enhance the catalytic performance of Ce/Zr-oxide based materials in the VOC combustion, transition metal oxides, such as CuO,29,30 MnOx31,32 and Co2O3,33 can be added. To date, X–Ce–Zr (X = Cu, Co, Mn) ternary mixed oxide catalysts have already gained tremendous attention regarding other applications, due to their excellent thermal stability and superior redox properties.34 On top of that, it is well known from the literature that the combination of transition metals with Ce/Zr oxides greatly improves the catalytic oxidation of VOCs, due to their enhanced redox properties and enhanced oxygen mobility.32 Zhang et al. recently reported that upon deposition on TiO2 nanoparticles the multi-metal combination of CuCeZr shows the highest toluene removal efficiency and selectivity towards CO2, followed by MnCeZr, NiCeZr, CoCeZr and FeCeZr, respectively.35 Moreover, it was proven that the oxidation process of toluene is dominated by lattice oxygen present in CuO species dispersed on CuCeZrOx catalysts.36 Furthermore, apart from its relatively low price and high reusability with a recycled yield up to 99%, Cu is known to have a strong synergistic effect with CeO2.37,38 As a result, Cu–Ce–Zr mixed oxide catalysts have attracted significant scientific interest for the abatement of VOCs. However, it is known that the catalytic activity of transition metal supported ceria-based catalysts strongly depends on transition metal dispersion and its interaction with the support material, which are often determined by the selection of synthesis parameters.37,39 Therefore, the presented study reports for the first time in the literature the deposition of Cu onto CexZr1−xO2 catalysts using the ammonia driven deposition precipitation (ADP) method.
The ADP method, which was first implemented by Guo et al.40 and further optimized by Xin et al.41 for the improved deposition of Cu onto SBA-15, involves the selective adsorption of a copper tetra-ammonia complex followed by its deposition during drying. Upon drying, the Cu complex is deposited on the support material, followed by a thermal activation step, forming a chemical bond between the Cu-sites and the support surface. Consequently, the ADP method ensures a strong metal-support interaction, high degree of metal dispersion and high stability of the deposited CuO sites.41 Furthermore, ADP is an aqueous based deposition method, hence environmentally friendly and easy for up-scaling.
Due to the valuable characteristics of the ADP method, it has already been successfully applied for Cu deposition onto TiO2 and Al2O3 supports.42,43 However, its application for Cu deposition onto CexZr1−xO2 catalysts is yet to be reported. Therefore, the aim of the presented study is to analyze the influence of the ADP deposition of Cu onto multiple CexZr1−xO2 (x = 0; 0.25; 0.5; 0.75; 1) supports by studying the resulting properties of the active catalyst phase and the catalytic performance in toluene combustion. Two different Cu loadings are examined, namely 10 and 12.5 wt%. These loadings are deliberately selected as a 10 wt% Cu loading is proven to be effective for VOC combustion and 12.5 wt% is the highest attainable Cu loading that ensures a strong metal support interaction with the utilized supports without a significant loss of the active element upon ADP synthesis.5
2. Experimental
Used chemicals: NH4OH (25%); CeCl3·7H2O, 99%, Merck; ZrCl4, 98%, Sigma-Aldrich; Cu(NO3)2·3H2O, >99%, Merck; N-hexadecyl-N,N,N-trimethylammonium bromide, CTAB, >99%, Acros; cerium(IV) oxide powder <5 micrometer (99.9% trace metals basis) Sigma-Aldrich; ZrO2 J.P. Pharma-Chem Industries.2.1. Catalyst preparation
Porous CexZr1−xO2 supports, with x equal to 0, 0.25, 0.5, 0.75 or 1, were designed using a template-based approach. 6.0 g CTAB was dissolved in 50 mL of deionized water at 30 °C to speed up the process. To this solution a second solution containing 50 mL of deionized water and either only ZrCl4 (98%, Sigma-Aldrich) or CeCl3·7H2O (99%, Merck) or a mixture of both metal salt precursors in amounts relative to the desired ratio between Zr and Ce was added under vigorous stirring in a dropwise fashion. After the addition the temperature was raised to 50 °C and the resulting mixture was stirred for 30 min. Subsequently, a solution containing 20 mL 25% NH4OH diluted with 20 mL deionized water was added dropwise. The resulting mixture was stirred overnight at 50 °C and then transferred to a Teflon-lined stainless steel autoclave pressure vessel, where it was kept at 100 °C for 24 h, as advised by Dou et al.44 Next, the obtained slurry was filtered, washed with distilled water and dried at room temperature. Finally, the obtained powder was calcined at 450 °C for 5 h at 1 °C min−1.After the successful synthesis of the desired supports, Cu was deposited using the ammonia driven deposition precipitation approach, whereby, typically 1 g of support was suspended in an appropriate amount of 0.03 M copper nitrate solution to obtain the desired theoretical loading of 10 wt% or 12.5 wt%. Then, ammonia (NH4OH, 28–30% Acros) was added into the mixture to gain a molar Cu/NH3 ratio of 1/6. Subsequently, the obtained solution was stirred for 48 h at room temperature, followed by filtration and washing with a sufficient amount of deionized water. After drying at room temperature the obtained solid was calcined at 550 °C for 6 h at a heating rate of 1 °C min−1. The final samples were referred to as yCu–CexZr1−xO2, where y represents the desired wt% of Cu.
Finally, commercial zirconia and ceria were used as reference supports, onto which 10 wt% of Cu was deposited according to the same ADP synthesis protocol as described above.
2.2. Catalyst characterization
 | (1) |
2.3. Catalytic tests
The catalytic activity of all samples was tested for total oxidation of toluene. Additionally, 10 wt% Cu was deposited onto commercial ZrO2 and CeO2 to serve as a benchmark during the catalytic tests. A fixed bed microreactor system with 8.0 mm diameter was used. The analysis of released products of the reaction was controlled using a Bruker 450 gas chromatograph equipped with two capillary columns (Porapak S and Chromosorb WAW-DMCS), two flame ionization detectors, a thermal conductivity detector and a methanizer. The catalytic reaction temperature was monitored using a thermocouple inserted into the catalytic bed. 100 mg of powder catalyst was placed on quartz wool in a quartz flow microreactor, then degassed at 500 °C for 30 min in air at a flow rate of 100 mL min−1. After that, the reactor was cooled to 100 °C and dosing the toluene concentration of 1000 ppm (diluted by air stream) began through a saturated scrubber filled with a liquid reagent while keeping the vapor pressure. The catalytic results were collected at 100, 150, 200, 225, 250, 275, 300, 325, 350, 400, 450 and 500 °C. Each step was maintained for about 70 min and then the reactor was heated to higher temperature at a heating ramp of 10 °C min−1.3. Results and discussion
3.1. Structural and textural properties of the CexZr1−xO2 supports
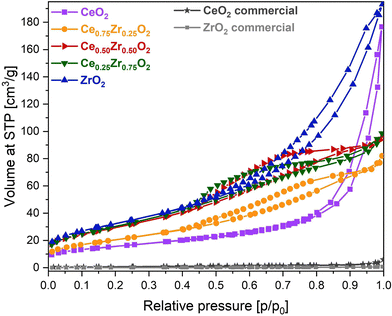
In order to highlight the influence of the catalyst composition on the ADP Cu deposition, various CexZr1−xO2 supports were utilized for the deposition of both 10 and 12.5 wt% of Cu. The usage of different support compositions should lead to varying structural and textural catalyst properties, potentially influencing the distribution of Cu species. To reveal this, N2 adsorption–desorption measurements were performed to gain insight into the porosity and total BET specific surface area of the materials. All obtained isotherms are depicted in Fig. 1 and 2, and the information concerning the corresponding textural parameters is presented in Table 1.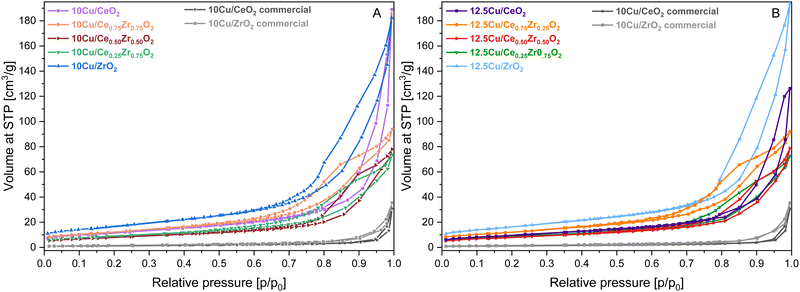 | ||
| Fig. 2 N2-sorption isotherms of the CexZr1−xO2 supports after ADP deposition of 10 wt% Cu (A) and 12.5 wt% Cu (B). | ||
| Theoretical Cu-loading | N.A. | 10 wt% | 12.5 wt% | |||
|---|---|---|---|---|---|---|
| Support material | BET surface area (m2 g−1) | Total pore volume (cm3 g−1) | BET surface area (m2 g−1) | Total pore volume (cm3 g−1) | BET surface area (m2 g−1) | Total pore volume (cm3 g−1) |
| CeO2 | 55 | 0.147 | 41 | 0.107 | 34 | 0.089 |
| Ce0.75Zr0.25O2 | 75 | 0.112 | 44 | 0.118 | 44 | 0.117 |
| Ce0.50Zr0.50O2 | 109 | 0.139 | 28 | 0.096 | 29 | 0.082 |
| Ce0.25Zr0.75O2 | 113 | 0.132 | 32 | 0.082 | 30 | 0.086 |
| ZrO2 | 118 | 0.250 | 60 | 0.180 | 58 | 0.188 |
| CeO2-commercial | 2 | 0.004 | 4.5 | 0.047 | — | — |
| ZrO2-commercial | 0.3 | 0.001 | 6 | 0.055 | — | — |
From Fig. 1, it is clear that a different type of isotherm can be ascribed to the monometallic CeO2 and ZrO2 supports compared to the Ce/Zr mixed oxides. In the case of pure ceria and zirconia, on the one hand, the shape of the adsorption isotherm corresponds with a type II adsorption isotherm, according to the I.U.P.A.C. classification. This type of isotherm represents an unrestricted monolayer–multilayer adsorption, which typically corresponds to non-porous or macroporous materials. For the pure CeO2 support, a steep increase in the adsorbed volume can be noticed near a relative pressure of 0.90. This indicates the presence of interparticle porosity, which is confirmed by the presence of a type H1 hysteresis loop. Unlike CeO2, the adsorption isotherm of ZrO2 shows an increase in adsorbed volume at lower relative pressures in combination with a type H3 hysteresis loop, indicating the presence of intraparticle porosity. As a result, the obtained specific BET surface area of ZrO2 is significantly higher. In the case of the CexZr1−xO2 mixed oxide supports, on the other hand, a type IV(a) isotherm, resembling mesoporous materials, can be assigned. The presence of mesopores is confirmed, on the one hand, by the pore size distribution, determined using the BJH method and presented in Fig. S1 of the ESI,† and, on the other hand, by the fact that a clear capillary condensation is observed between a relative pressure of 0.40 and 0.90. The resulting hysteresis loop in this relative pressure region can be classified as type H4, which is attributed to slit-shaped pores. As a result, it is clear that the bimetallic combination of cerium and zirconium induces mesoporosity.
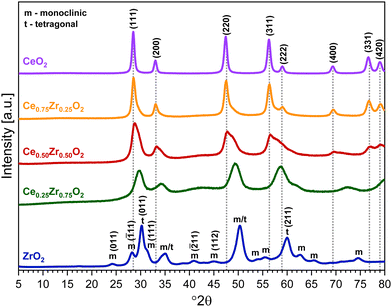
To check the crystallographic structure of the involved supports, X-ray diffraction patterns were collected, which are shown in Fig. 3. For pure ceria, eight diffraction peaks are observed at 2θ = 28.5°, 33.0°, 47.4°, 56.3°, 59.1°, 69.4°, 76.8° and 78.9°. These peaks can be attributed to the (111), (200), (220), (311), (222), (400), (331) and (420) reflections of the cubic fluorite phase of ceria, respectively. In the case of Ce0.75Zr0.25O2, a similar diffraction pattern is found, which implies that the cubic crystal phase is retained. However, the incorporation of 25% Zr causes a slight shift of the diffraction peaks towards higher Bragg angles. This shift can be explained by the replacement of Ce4+ cations (ionic radius of 0.97 Å) with smaller Zr4+ (ionic radius of 0.84 Å), which modifies the cubic fluorite structure of CeO2.26,27 Moreover, the incorporation of Zr also results in peak broadening, which can be ascribed to the formation of smaller crystallite sizes.45 The average crystallite size (D) can be estimated by using the well-established Scherrer equation (see eqn (2)), whereby K represents the shape constant, λ is the wavelength of the utilised Cu-Kα radiation (0.15406 nm), β is the full width at half maximum of the corresponding diffraction peak expressed in radians, and θ refers to the Bragg angle in radians.
 | (2) |
Looking at the diffractogram of Ce0.25Zr0.75O2, the peaks corresponding to the (400), (331) and (420) reflections are no longer detected. This is caused by the presence of a significantly higher amount of Zr compared to Ce, resulting in the fact that the cubic crystal structure is not retained. To understand this it is important to highlight that apart from a cubic crystal structure, zirconia is known to have two other polymorphs, namely, tetragonal and the thermodynamically stable monoclinic crystal phase. The significant diffraction peaks of Ce0.25Zr0.75O2 can be ascribed to a tetragonal crystal structure, implying that Ce is incorporated into a zirconia lattice. According to Yu et al. the presence of lower amounts of cerium in a Ce/Zr mixed oxide stabilizes the tetragonal structure of zirconia.45 However, since a broad signal between 38° and 45° and a shoulder between 60° and 65° are found, the presence of a monoclinic ZrO2 crystal phase cannot be excluded. Finally, in the case of ZrO2, both diffraction peaks corresponding with a monoclinic and tetragonal crystal phase are observed. A cubic crystal structure is not obtained, as it is typically only formed at temperatures exceeding 2370 °C.46
To support the information derived from the XRD patterns, Raman spectroscopy measurements were performed, which are presented in the ESI.† Additionally, SEM micrographs, which offer an excellent visual examination of the structures formed during the synthesis of the CexZr1−xO2 supports are also presented in the ESI.†
3.2. Characterization of Cu-containing catalysts
In order to verify the deposited amount of Cu on the surface of the CexZr1−xO2 supports, X-ray fluorescence analysis was performed. The collected XRF results are presented in Table 2. From these results it can be noticed that the detected contents of Cu on the CeO2 support are in both cases very close to the desired amounts. As N2-adsorption–desorption data proved, CeO2 is the support with the lowest available surface area, which mainly possesses interparticle porosity. Due to the absence of mesoporosity, Cu can only be deposited on the surface of the material. Hence why the detected amounts of Cu validate the utilized deposition protocol. Furthermore, when the XRF data are analyzed in more detail, it can be noted that typically a lower amount of Cu is detected upon an increasing amount of zirconium. This can be correlated to the total specific surface area of the supports, which is represented in Table 1. More specifically, when the zirconium content increases for the CexZr1−xO2 supports, a higher surface area is obtained. Due to the increasing porosity and the fact that XRF is considered to be a rather surface technique, it is believed that higher amounts of Cu are potentially situated deeper within the pores and are therefore covered from the interaction volume of the X-rays.
| Support material | Theoretical loading | |
|---|---|---|
| 10 wt% Cu | 12.5 wt% Cu | |
| CeO2 | 9.28 | 12.36 |
| Ce0.75Zr0.25O2 | 7.57 | 9.57 |
| Ce0.50Zr0.50O2 | 6.41 | 8.70 |
| Ce0.25Zr0.75O2 | 6.12 | 7.86 |
| ZrO2 | 6.72 | 7.60 |
As derived from the N2-adsorption–desorption measurements presented in Fig. 2 and Table 1, the deposition of Cu and the additional required calcination step resulted in a shift of the corresponding isotherms towards higher relative pressures and in a significant decrease of the total specific surface area. However, despite the isotherm shift, no changes are to be reported for the classification of the isotherms and hysteresis loops.
The X-ray diffractograms of the Cu-supported materials are depicted in Fig. 4. First of all, due to an additional calcination step involving an increased temperature of 550 °C, a higher degree of crystallinity is obtained for all supports. This also explains the significant decrease in surface area observed during N2-adsorption–desorption measurements. In accordance with the XRF data, the obtained XRD patterns confirm the successful deposition of CuO on all CexZr1−xO2 supports. More specifically, the reflections originating from the monoclinic CuO tenorite phase (C2/c space group, ICDD card: 00-005-0661), namely (![[1 with combining macron]](https://www.rsc.org/images/entities/char_0031_0304.gif) 11), (111), (
11), (111), (![[2 with combining macron]](https://www.rsc.org/images/entities/char_0032_0304.gif) 02), (
02), (![[1 with combining macron]](https://www.rsc.org/images/entities/char_0031_0304.gif) 13), (
13), (![[3 with combining macron]](https://www.rsc.org/images/entities/char_0033_0304.gif) 11), (113), (311) and (004) can be recognized at 35.5°, 38.7°, 48.7°, 61.6°, 66.2°, 68.1°, 72.5° and 75.1° 2θ, respectively. Additionally, for the 12.5 wt% Cu samples, the (020) and (202) reflections can be identified at 53.6° and 58.3° 2θ, respectively.
11), (113), (311) and (004) can be recognized at 35.5°, 38.7°, 48.7°, 61.6°, 66.2°, 68.1°, 72.5° and 75.1° 2θ, respectively. Additionally, for the 12.5 wt% Cu samples, the (020) and (202) reflections can be identified at 53.6° and 58.3° 2θ, respectively.
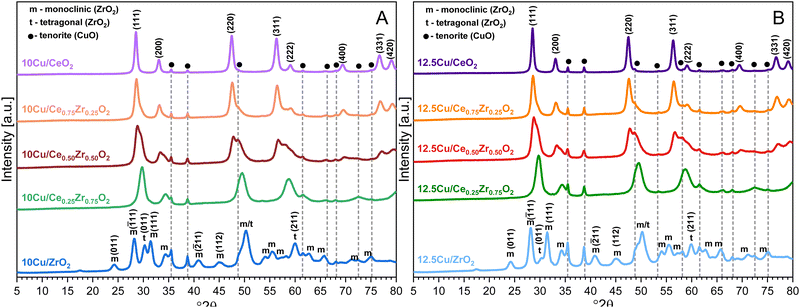 | ||
| Fig. 4 XRD patterns of the CexZr1−xO2 supports after ADP deposition of 10 wt% Cu (A) and 12.5 wt% Cu (B). | ||
In the case of ZrO2 an interesting observation can be made. When the (![[1 with combining macron]](https://www.rsc.org/images/entities/char_0031_0304.gif) 11) reflection from the monoclinic crystal phase and the (011) reflection from the tetragonal phase are analyzed in more detail for the Cu-containing ZrO2 materials and the pure ZrO2 support, it is observed that the diffraction peaks corresponding to the monoclinic crystal phase gain intensity and that those from a tetragonal structure significantly decrease upon an increasing amount of Cu. Consequentially, it can be stated that a higher amount of Cu stabilizes the monoclinic crystal structure, which has been reported in recent studies on similar materials.47
11) reflection from the monoclinic crystal phase and the (011) reflection from the tetragonal phase are analyzed in more detail for the Cu-containing ZrO2 materials and the pure ZrO2 support, it is observed that the diffraction peaks corresponding to the monoclinic crystal phase gain intensity and that those from a tetragonal structure significantly decrease upon an increasing amount of Cu. Consequentially, it can be stated that a higher amount of Cu stabilizes the monoclinic crystal structure, which has been reported in recent studies on similar materials.47
When directly comparing the diffractograms of the two different amounts of Cu on the same support, it is clear that a higher amount of Cu results in an increased intensity of the CuO reflections. Furthermore, an increase in intensity of the reflections can be noticed with an increasing amount of zirconium for both the 10 wt% Cu and the 12.5 wt% Cu samples. Utilizing the isolated (111) reflection of CuO, an estimation of the corresponding particle sizes is made through the Scherrer equation. The resulting values are presented in Table 3. From this table, it can be stated that a higher particle size is obtained after deposition of Cu on a support known to possess a lower available surface area. This complies with the idea that larger surface areas should enhance the dispersion of active elements.48
| Support | 10 wt% Cu | 12.5 wt% Cu |
|---|---|---|
| CeO2 | 26.3 | 33.7 |
| Ce0.75Zr0.25O2 | 28.1 | 31.2 |
| Ce0.50Zr0.50O2 | 20.5 | 17.8 |
| Ce0.25Zr0.75O2 | 20.0 | 22.2 |
| ZrO2 | 21.8 | 20.0 |
In order to support the insights gained through XRD, structural changes and interactions upon the deposition of Cu as the active phase were also studied using Raman spectroscopy. The obtained spectra are presented in Fig. 5. According to the literature, CuO has three Raman active modes, namely one Ag vibration with an estimated position around 290 cm−1 and 2 Bg vibrations positioned around 330 and 620 cm−1.49 However, Fig. 5 indicates that the addition of Cu does not result in the presence of characteristic CuO signals but that it leads to a red shift of the Raman peaks in comparison to the pure supports presented in Fig. S2 of the ESI.† Additionally, in the case of CeO2, Ce0.75Zr0.25O2 and Ce0.50Zr0.50O2 the presence of Cu appears to induce the formation of a weak band centered around 270–280 cm−1, which can be attributed to the displacement of oxygen atoms from their ideal positions in a fluorite like crystal lattice.50 Moreover, for these three materials the addition of Cu also increases the intensity of the band around 600 cm−1, which corresponds to the longitudinal optical mode of ceria that arises due to relaxation of symmetry rules, indicating the formation of more oxygen vacancies.50
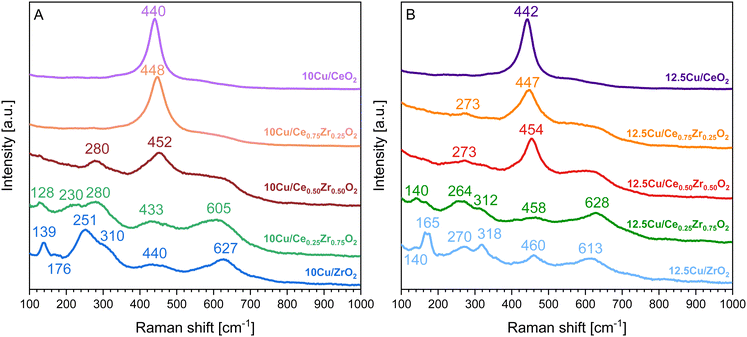 | ||
| Fig. 5 Raman spectra of the CexZr1−xO2 supports after ADP deposition of 10 wt% Cu (A) and 12.5 wt% Cu (B). | ||
In the case of both Cu–Ce0.25Zr0.75O2 catalysts, all expected bands corresponding to a tetragonal structure are present. However, in the Raman spectrum of the catalyst containing 12.5 wt% Cu a weak band is observed at 165 cm−1, which can be attributed to the presence of a monoclinic structure. A similar observation is made for the 10Cu/ZrO2 catalyst where this band is appearing at 176 cm−1. Lastly, when looking at the Raman spectrum of the 12.5Cu/ZrO2 catalyst in Fig. 5B it can be noticed that the same band referring to a monoclinic structure, which occurs at 165 cm−1, has significantly gained in intensity, in comparison to the 10Cu/ZrO2 catalyst. This fortifies the statement that a higher loading of Cu tends to stabilize the monoclinic crystal phase.
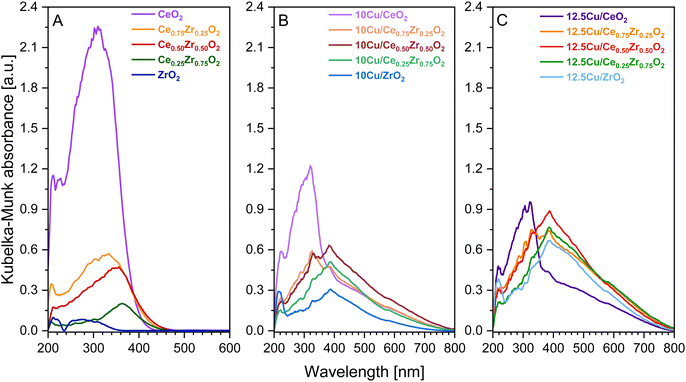 | ||
| Fig. 6 UV-vis-DR spectra of the pure CexZr1−xO2 supports (A) and the corresponding 10 wt% Cu (B) and 12.5 wt% Cu (C) catalysts. | ||
From Fig. 6 it is clear that the addition of Cu2+, yielding CuO after calcination, strongly affects the electronic properties of the pure supports. First of all, it is observed that the absorbance bands of the Cu containing catalysts, with the exception of both Cu–CeO2 catalysts, show an increased intensity when directly compared to the bands of the corresponding pure support. This can be attributed to the higher degree of crystallinity and the resulting bigger particles obtained after the calcination at an increased temperature of 550 °C, because the given absorption spectra in Fig. 6 were obtained after Kubelka–Munk conversion of the measured reflectance spectra, whereby the scattering coefficient (S) is dependent on the grain size.51 Consequentially, diffuse reflectance increases with an increasing particle size. In the case of CeO2, however, it is known that the intensity of the absorbance gradually decreases with increasing calcination temperatures due to enhanced oxygen atom effusion at higher calcination temperatures generating more oxygen vacancies.52 Next, for all Cu-containing catalysts, two absorption maxima related to the copper species can be recognized. The first one is located around 385 nm and can be assigned to the charge transfer from O2− to Cu2+, whereby the Cu-ions occupy isolated positions on the support.47,53,54 The strongest absorbance related to this charge transfer is found for the Cu–Ce0.50Zr0.50O2 catalysts, suggesting the formation of aggregated Cu species and/or bulk CuO. The second maximum is found around 580 nm and indicates the presence of well-dispersed Cu2+ ions, which is the result of the successful ammonia driven deposition precipitation of CuO precursor.47
When analyzing the obtained spectra of the CeO2, Ce0.75Zr0.25O2 and Ce0.50Zr0.50O2 supports in Fig. 6A, which have a defined cubic crystal structure proven by XRD and Raman spectroscopy, two bands can be identified at ca. 260 and 300 nm. These bands can be attributed to the charge transfer transition of O2− to Ce3+ and O2− to Ce4+, respectively.55 Upon introduction of Cu all bands experience a red shift towards higher wavelengths. The same observation can be made after deposition of Cu on Ce0.25Zr0.75O2 and ZrO2. Moreover, in the case of Ce0.25Zr0.75O2, the bands corresponding to the charge transfer transition of O2− to Ce3+ and O2− to Ce4+, can also be identified. However, unlike the catalysts that contain a cubic crystal structure, Ce0.25Zr0.75O2 is known to have a predominantly tetragonal crystal structure, which results in the presence of a band around 300 nm, resembling the charge transfer transition of O2− to Zr4+.56 Finally, when studying the ZrO2-based materials, two bands are identified. The first absorption band occurs around 210 nm, which corresponds to the O2− to Zr4+ charge transfer transition in monoclinic-ZrO2.56,57 The second band arises around 280 nm and reveals the coexistence of tetragonal ZrO2, matching the XRD and Raman spectroscopy data.56 Additionally, XRD provided evidence that the addition of Cu has a stabilizing effect on the monoclinic crystal phase of ZrO2. This is clearly supported by the UV-vis-DR data, as for both 10 and 12.5 wt% Cu–ZrO2 the absorption band of the O2− to Zr4+ charge transfer transition in monoclinic-ZrO2, which has red-shifted to 220 nm, has significantly gained in intensity compared to the pure ZrO2 support.
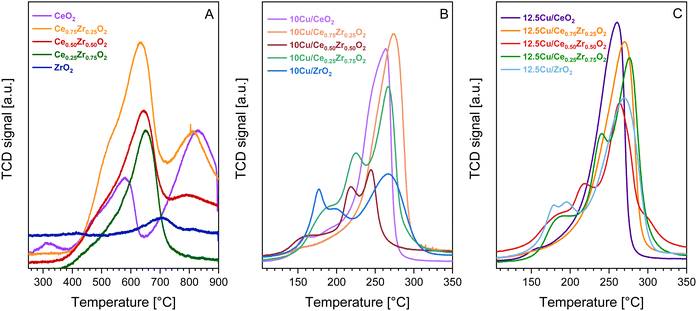 | ||
| Fig. 7 H2-TPR profiles of the pure CexZr1−xO2 supports (A) and the corresponding 10 wt% Cu (B) and 12.5 wt% Cu (C) catalysts. | ||
When comparing Fig. 7A with B and C, it is clear that the reduction peaks of the supports are located at higher temperatures compared to the reduction peaks of their Cu-containing counterparts. This indicates that the addition of Cu significantly enhances the redox behavior of the studied CexZr1−xO2 materials. To get a better understanding of how the addition of Cu enhances the reducibility, a more in-depth description of the resulting reduction profiles is presented. Upon analysis of the H2-TPR measurements of both the 10 and 12.5 wt% Cu catalysts, varying reduction profiles containing either a single or multiple peaks are observed. This implies that the structural and textural differences of the CexZr1−xO2 supports impact the resulting Cu active sites. In general, when comparing multiple reduction peaks, the low-temperature reduction peaks typically belong to well dispersed or smaller Cu species, whereas high-temperature signals can be attributed to particles with a larger size, which inhibit weaker metal–support interactions.47,61 According to the estimated CuO particle sizes presented in Table 3, the CeO2 and Ce0.75Zr0.25O2 supports give rise to larger CuO particles, which is believed to be caused by their lower available surface area. As a result, and knowing that both supports possess a clear cubic crystal structure, the corresponding H2-TPR profiles exhibit one main signal, indicating a uniform Cu distribution. More specifically, the H2-TPR profile of 10Cu/Ce0.75Zr0.25O2 consists of one broad signal centered around 270 °C, which can be attributed to the reduction of bulk CuO and copper species interacting strongly with the support.44,62 The signal of 12.5Cu/Ce0.75Zr0.25O2, on the contrary, is broader and more intense, indicating the presence of more active species. Furthermore, both Cu containing CeO2 materials show similar reduction profiles, with maxima occurring at a slightly lower temperature of around 260 °C. Only one small additional peak is observed around 150 °C. This can be explained by the presence of a low amount of smaller copper particles in close interaction with the ceria lattice.44,62,63 For the remaining materials containing 50% or more zirconium, X-ray diffraction analysis indicated the co-existence of multiple crystal structures. As a result, multiple reduction signals are detected, which implies the formation of different active sites and thus a non-uniform deposition of CuO particles.
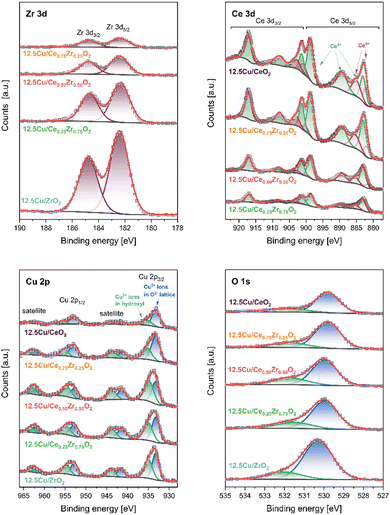
In the XPS Zr 3d spectra two components at 182.4 eV and 184.8 eV, corresponding to spin–orbit splitting of 3d5/2 and 3d3/2 states (Δ = 2.4 eV), confirm the presence of Zr4+ ions in ZrO2 lattice.5 The emission of photoelectrons from Ce atoms is much more complex. The obtained XPS Ce 3d spectra were fitted with 6 peaks at 883.0 eV (v), 889.3 eV (v′′), 898.6 eV (v′′′), 901.3 eV (u), 908.0 eV (u′′), and 917.1 eV (u′′′) assigned to Ce4+ ions (components of 3d5/2 are denoted as v, whereas 3d3/2 as u).64 Furthermore, spin–orbit splitting between Ce 3d5/2 and Ce 3d3/2 in Ce3+ ions results in two additional doublets at 881.9/900.5 eV and 885.4/903.3 eV. In the XPS Cu 2p3/2 region two peaks at 933.2 eV and 935.1 eV followed by intense satellite features, related to Cu2+ ions present in O2− (Cuoxide) and OH− (Cuhydroxyl) species, are observed.65 The occurrence of various surface oxygen forms – oxide lattice (Olatt) and hydroxyls (Oads) – is additionally confirmed in the XPS O 1s spectrum, where photoelectron emission is found at 530.0 eV (Olatt) and 531.7 eV (Oads).
Table 4 shows several quantitative results of XPS surface analysis for the studied Cu-containing catalysts. Elemental analysis indicates expected changes in the relative content of Zr and Ce while maintaining a similar O concentration (38.1–42.0 at%). However, attention should be paid to significant discrepancies in the amount of Cu species deposited on the outermost surface. The highest concentration of these centers is achieved for the 12.5Cu/Ce0.50Zr0.50O2 material. Changing the composition of the support to increase the content of one of the components (CeO2 or ZrO2) leads to a decrease in the presence of surface Cu. The discussed feature is additionally correlated with the type of Cu forms. The higher the concentration of Cu on the surface, the higher the Cuhydroxyl/Cuoxide ratio is observed. At the same time, the value of the Olatt/Oads ratio decreases. The analysis of the surface composition reveals another interesting effect. The degree of reduction of the CeO2 lattice increases with increasing Ce content.
| Catalyst | Content [at%] | Atomic ratios | |||||
|---|---|---|---|---|---|---|---|
| Zr | Ce | Cu | O | Cuhydroxyl/Cuoxide | Ce3+/(Ce3+ + Ce4+) | Olatt/Oads | |
| 12.5Cu/ZrO2 | 39.4 | — | 18.6 | 42.0 | 0.82 | — | 4.61 |
| 12.5Cu/Ce0.25Zr0.75O2 | 24.1 | 6.6 | 29.7 | 39.5 | 0.83 | 0.13 | 3.49 |
| 12.5Cu/Ce0.50Zr0.50O2 | 12.6 | 13.1 | 34.0 | 40.3 | 1.18 | 0.16 | 2.76 |
| 12.5Cu/Ce0.75Zr0.25O2 | 6.4 | 28.2 | 27.2 | 38.1 | 0.58 | 0.21 | 3.84 |
| 12.5Cu/CeO2 | — | 39.9 | 20.3 | 39.8 | 0.43 | 0.28 | 3.47 |
3.3. Catalytic performance of Cu-containing catalysts in toluene combustion
The catalytic performance of the synthesized Cu-supported CexZr1−xO2 materials was tested in the catalytic total oxidation of toluene. Toluene combustion is chosen because it serves as a model reaction for the combustion of aromatic VOCs. The observed toluene conversions in relation to the reaction temperature are presented in Fig. 9. Hereby, it is worth mentioning that for all synthesized catalysts only the desired reaction products, namely CO2 and H2O, are detected, since no noticeable signals corresponding to the formation of by-products, such as CO or benzene, are found. This highlights the selectivity of all studied materials towards complete combustion of toluene.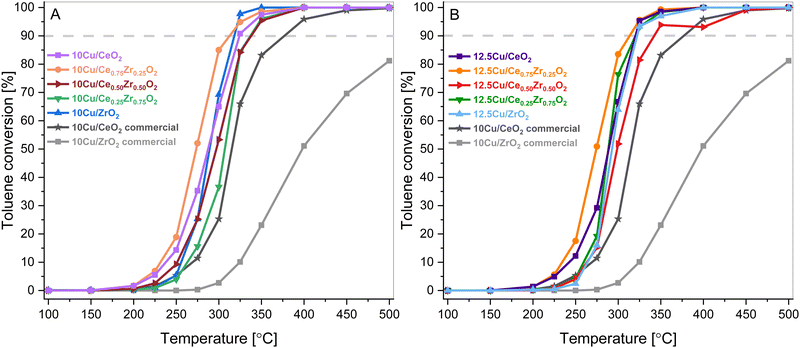 | ||
| Fig. 9 Toluene conversions as a function of reaction temperature over the 10 wt% Cu (A) and 12.5 wt% Cu (B) CexZr1−xO2 materials. | ||
As can be seen in Fig. 9, all catalysts outperform the 10 wt% Cu-loaded CeO2 and ZrO2 commercial supports that are used as reference catalysts. Consequentially, it is believed that the increased surface area due to the hydrothermal synthesis of the supports is beneficial for the VOC combustion. On top of that, the toluene conversion did not exceed 85% for the commercial CeO2 material. This inferior result is also coupled with a CO selectivity of around 4% at 300 °C. Furthermore, when analyzing both the 10 wt% and 12.5 wt% Cu series, Cu supported on Ce0.75Zr0.25O2 shows the best results. This is also clearly visible in Fig. 10, which depicts a graphical representation of the temperatures where a toluene conversion of 20% (T20), 50% (T50) and 90% (T90) is achieved over the different catalysts. It is apparent that for both the 10 wt% Cu and 12.5 wt% Cu supported Ce0.75Zr0.25O2 catalysts, very similar results are obtained. More specifically, in the case of 10 wt% Cu/Ce0.75Zr0.25O2, the T20, T50 and T90 are observed at 251 °C, 273 °C and 313 °C, respectively, and for 12.5 wt% Cu similar conversions are achieved at 252 °C, 274 °C and 313 °C. This indicates that for these materials the presence of an increased amount of Cu does not improve the catalytic performance and the excess of the introduced active phase does not allow the process to be accelerated. A similar statement can be made when analyzing the CeO2, Ce0.50Zr0.50O2 and ZrO2 based catalysts. With the exception of the T90 of CeO2, which is 5 °C higher for 10 wt% Cu (257 °C) in comparison to 12.5 wt% Cu (261 °C), all reported values for the T20, T50 and T90 of the corresponding catalysts are slightly lower or equal. Only in the case of the Ce0.25Zr0.75O2 based catalysts the presence of an increased amount of Cu shows a significant drop in both the T50, which drops over 6% from 307 °C to 288 °C and the T90, which drops around 5% from 337 °C to 320 °C. This can most likely be ascribed to the fact that a higher amount of Cu appears to stabilize the monoclinic crystal structure, as was observed in the X-ray diffraction measurements.
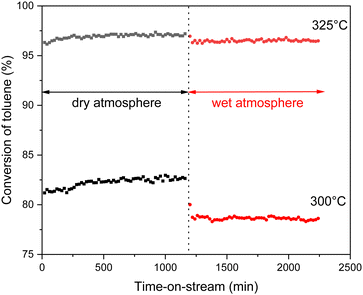 | ||
| Fig. 10 Overview of temperatures at which a toluene conversion of 20% (T20), 50% (T50) and 90% (T90) is reached over the Cu-supported CexZr1−xO2 materials. | ||
As shown in the H2-TPR results, Ce0.75Zr0.25O2 has the highest reducing capacity among the tested supports. This feature is most likely induced by the presence of Zr4+ substituted into the CeO2 lattice, which thus creates smaller, more easily reducible crystallites. Consequently, it may favor the redox equilibrium at the phase boundary: Cu2+ + Ce3+ = Cu+ + Ce4+, which improves the oxygen storage capacity and promotes the surface reaction.
The most active 12.5Cu/Ce0.75Zr0.25O2 catalyst was tested in stability runs performed at two different temperatures, namely 300 °C and 325 °C. The catalytic measurements were carried out for 20 h in a dry atmosphere, after which 10 vol% of water vapor was additionally introduced into the system. Under the wet conditions, the catalytic test was continued for another 20 h. The collected results are presented in Fig. 11 as the toluene conversion vs. time-on-stream. In the initial period of the reaction a slight improvement in activity is clearly visible. In more detail, at 300 °C the toluene conversion increases from 81.2% to 82.7%, and at 325 °C from 96.3% to 97.2%. The system itself needs around 4 to 5 hours for full stabilization. Most likely, during this induction period the surface is reorganized towards the formation of the previously described redox equilibrium. After introducing a relatively high content of water vapor after 20 h, a decrease in activity of 4.1% (up to 78.6%) at 300 °C and 0.8% (up to 96.4%) at 325 °C is noted. However, despite the presence of a huge excess of H2O molecules in the reaction system, the activity of the tested catalyst is still very high.
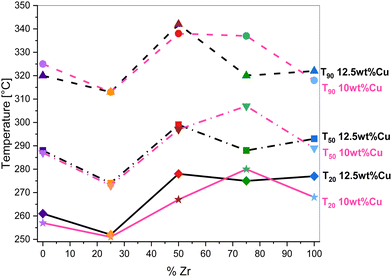 | ||
| Fig. 11 Stability runs over the 12.5Cu/Ce0.75Zr0.25O2 catalyst at 300 °C and 325 °C under a dry atmosphere switched after 20 h to a wet atmosphere (∼10 vol% H2O). | ||
4. Conclusions
This study reports for the first time in the literature the successful deposition of Cu onto CexZr1−xO2 mixed metal oxides using the water-based ammonia driven deposition precipitation (ADP) method. Five different CexZr1−xO2 (x = 0, 0.25, 0.5, 0.75, 1) mixed metal oxide supports were synthesized using a soft template assisted hydrothermal approach. The resulting supports were proven to be mesoporous and highly porous, with a much higher surface area and pore volume compared to commercial ceria and zirconia. In order to study the influence of the varying structural and textural properties of the different supports on the ADP Cu deposition, both 10 wt% and 12.5 wt% of Cu was deposited. These loadings were deliberately selected, because a 10 wt% Cu loading is proven to be effective for VOC combustion and 12.5 wt% is the highest attainable Cu loading that ensures a strong metal support interaction with the utilized supports without a significant loss of the active element upon ADP synthesis.By studying the characteristics of the Cu-based catalysts it was clear that the structure of the support had an impact on the properties of the Cu active phase that was deposited onto the support material, causing differences in the reductive behaviour of the catalysts. However, for all catalysts, the presence of Cu significantly enhanced the redox activity. The strong synergy between Cu and the ceria–zirconia mixed metal oxide supports obtained by using the ADP deposition method resulted in high catalytic conversion of toluene and 100% selectivity towards H2O and CO2. On top of that, all catalysts outperformed the commercial CeO2 and ZrO2 reference samples onto which 10 wt% of Cu was deposited following the same ADP deposition protocol. Cu supported on Ce0.75Zr0.25O2 yielded the best results for the catalytic combustion of toluene with a T90 of 313 °C, which is identical for both the 10 wt% Cu and 12.5 wt% Cu containing samples. Clearly, the catalytic activity tests highlighted that an increased amount of Cu up to 12.5 wt% typically does not yield an improved catalytic performance. Finally, stability runs at 300 °C and 325 °C in the presence of 10 vol% of water vapor for 20 h indicated that the activity of the 12.5Cu/Ce0.75Zr0.25O2 catalyst remains very high. Thus proving the potential of a noble metal-free Cu/Ce0.75Zr0.25O2 catalyst, synthesized using a water-based synthesis protocol that involves the ADP deposition of Cu, for VOC combustion.
Author contributions
W. Van Hoey: conceptualization, methodology, investigation, formal analysis, validation, writing – original draft, writing – review & editing. A. Rokicińska: methodology, investigation, formal analysis, validation, writing – review & editing. M. Dębosz: methodology, investigation, formal analysis, validation, writing – review & editing. I. Majewska: investigation, writing – review & editing. P. Kuśtrowski: conceptualization, funding acquisition, investigation, methodology, writing – original draft, writing – review & editing, supervision. P. Cool: conceptualization, funding acquisition, investigation, methodology, writing – review & editing, supervision.Data availability
Data will be made available upon request to the corresponding author.Conflicts of interest
There are no conflicts to declare.Acknowledgements
W. Van Hoey and P. Cool acknowledge financial support from the UAntwerp BOF GOA (project ID 36083). The research was partially carried out with the X-ray diffraction equipment funded by the UA BOF research infrastructure (project ID 41358) and with the equipment purchased thanks to the financial support of the European Regional Development Fund in the framework of the Polish Innovation Economy Operational Programme (contract no. POIG.02.01.00-12-023/08) and the Smart Growth Operational Programme (contract no. POIR.04.02.00-00-D001/20). The financial support of the Strategic Programme Excellence Initiative at Jagiellonian University, used for servicing measurement systems, is also appreciated.Notes and references
- A. Rokicińska, M. Drozdek, B. Dudek, B. Gil, P. Michorczyk, D. Brouri, S. Dzwigaj and P. Kuśtrowski, Appl. Catal., B, 2017, 212, 59–67 CrossRef.
- Rahul, A. K. Mathur and C. Balomajumder, Bioresour. Technol., 2013, 142, 9–17 CrossRef CAS PubMed.
- T. Kondratowicz, M. Drozdek, M. Michalik, W. Gac, M. Gajewska and P. Kuśtrowski, Appl. Surf. Sci., 2020, 513, 145788 CrossRef CAS.
- P. Kuśtrowski, A. Rokicińska and T. Kondratowicz, Adv. Inorg. Chem., 2018, 72, 385–419 CrossRef.
- T. Kondratowicz, M. Drozdek, A. Rokicińska, P. Natkański, M. Michalik and P. Kuśtrowski, Microporous Mesoporous Mater., 2019, 279, 446–455 CrossRef CAS.
- H. Wang, W. Yang, P. Tian, J. Zhou, R. Tang and S. Wu, Appl. Catal., A, 2017, 529, 60–67 CrossRef CAS.
- X. Hu, Z. Zhang, Y. Zhang, L. Sun, H. Tian and X. Yang, Eur. J. Inorg. Chem., 2019, 2933–2939 CrossRef CAS.
- B. Zhou, Q. Ke, M. Wen, T. Ying, G. Cui, Y. Zhou, Z. Gu and H. Lu, J. Rare Earths, 2023, 41(8), 1171–1178 CrossRef CAS.
- B. Zhao, Y. Jian, Z. Jiang, R. Albilali and C. He, Chin. J. Catal., 2019, 40, 543–552 CrossRef CAS.
- A. Aguirre, E. L. Fornero, A. Villarreal and S. E. Collins, Catal. Today, 2022, 394–396, 225–234 CrossRef CAS.
- H. Wang, Y. Zhang, M. Wu, H. Xu, X. Jin, J. Zhou and Z. Hou, Ind. Eng. Chem. Res., 2020, 59, 20316–20324 CrossRef CAS.
- T. Liu, H. Yan, J. Xu, X. Xu, Y. Lv, X. Fang and X. Wang, Catal. Today, 2023, 421, 114177 CrossRef CAS.
- K. Xie, Z. Wang, B. Jiang, B. Zhao and S. Zuo, Appl. Catal., A, 2022, 639, 118641 CrossRef CAS.
- Y. Dong, J. Zhao, J. Y. Zhang, Y. Chen, X. Yang, W. Song, L. Wei and W. Li, Chem. Eng. J., 2020, 388, 124244 CrossRef CAS.
- J. Yun, L. Wu, Q. Hao, Z. Teng, X. Gao, B. Dou and F. Bin, J. Environ. Chem. Eng., 2022, 10, 107847 CrossRef CAS.
- Y. Zhang, Z. Zeng, Y. Li, Y. Hou, J. Hu and Z. Huang, Fuel, 2021, 288, 119700 CrossRef CAS.
- M. Ma, X. Feng, R. Yang, L. Li, Z. Jiang, C. Chen and C. He, Fuel, 2022, 317, 123574 CrossRef CAS.
- Q. Wang, K. L. Yeung and M. A. Bañares, Catal. Today, 2020, 356, 141–154 CrossRef CAS.
- M. Ozawa, M. Misaki, M. Iwakawa, M. Hattori, K. Kobayashi, K. Higuchi and S. Arai, Catal. Today, 2019, 332, 251–258 CrossRef CAS.
- Y. Liu, J. Yang, J. Yang, L. Wang, Y. Wang, W. Zhan, Y. Guo, Y. Zhao and Y. Guo, Appl. Surf. Sci., 2021, 556, 149766 CrossRef CAS.
- K. J. Kim, Y. L. Lee, H. S. Na, S. Y. Ahn, J. O. Shim, B. H. Jeon and H. S. Roh, Catalysts, 2020, 10, 6–9 Search PubMed.
- S. Y. Ahn, H. S. Na, K. W. Jeon, Y. L. Lee, K. J. Kim, J. O. Shim and H. S. Roh, Catal. Today, 2020, 352, 166–174 CrossRef CAS.
- S. Adak, J. Rabeah, R. Ranjan, T. S. Khan, M. K. Poddar, R. K. Gupta, T. Sasaki, S. Kumar, A. Bordoloi, C. S. Gopinath, A. Brückner and R. Bal, Appl. Catal., A, 2021, 624, 118305 CrossRef CAS.
- C. A. Chagas and M. Schmal, Int. J. Hydrogen Energy, 2022, 47, 8858–8866 CrossRef CAS.
- H. S. Kim, H. J. Kim, J. H. Kim, J. H. Kim, S. H. Kang, J. H. Ryu, N. K. Park, D. S. Yun and J. W. Bae, Catalysts, 2022, 12(1), 63 CrossRef CAS.
- I. Atribak, A. Bueno-López and A. García-García, J. Catal., 2008, 259, 123–132 CrossRef CAS.
- J. I. Gutiérrez-Ortiz, B. de Rivas, R. López-Fonseca and J. R. González-Velasco, Appl. Catal., B, 2006, 65, 191–200 CrossRef.
- E. Mamontov, T. Egami, R. Brezny, M. Koranne and S. Tyagi, J. Phys. Chem. B, 2000, 104, 11110–11116 CrossRef CAS.
- Q. F. Deng, T. Z. Ren, B. Agula, Y. Liu and Z. Y. Yuan, J. Ind. Eng. Chem., 2014, 20, 3303–3312 CrossRef CAS.
- B. Dou, D. Liu, Q. Zhang, R. Zhao, Q. Hao, F. Bin and J. Cao, Catal. Commun., 2017, 92, 15–18 CrossRef CAS.
- Z. Hou, J. Feng, T. Lin, H. Zhang, X. Zhou and Y. Chen, Appl. Surf. Sci., 2018, 434, 82–90 CrossRef CAS.
- C. Zhou, H. Zhang, Z. Zhang and L. Li, Appl. Surf. Sci., 2021, 539, 148188 CrossRef CAS.
- Y. Shen, J. Deng, X. Hu, X. Chen, H. Yang, D. Cheng and D. Zhang, Environ. Sci. Technol., 2023, 57, 1797–1806 CrossRef CAS PubMed.
- B. Dou, R. Zhao, N. Yan, C. Zhao, Q. Hao, K. S. Hui and K. N. Hui, Mater. Chem. Phys., 2019, 237, 121852 CrossRef CAS.
- Z. Zhang, G. Hu, C. Zhao, X. Wei, B. Dou, W. Liang and F. Bin, Fuel, 2023, 341, 127760 CrossRef CAS.
- C. Zhang, C. Zhao, R. Kang, Q. Hao, B. Dou and F. Bin, Carbon Resour. Convers., 2023, 6(4), 255–261 CrossRef CAS.
- P. S. Barbato, S. Colussi, A. Di Benedetto, G. Landi, L. Lisi, J. Llorca and A. Trovarelli, J. Phys. Chem. C, 2016, 120, 13039–13048 CrossRef CAS.
- B. Song, C. Li, X. Du, S. Li, Y. Zhang, Y. Lyu and Q. Zhou, Fuel, 2021, 306, 121654 CrossRef CAS.
- E. Moretti, M. Lenarda, P. Riello, L. Storaro, A. Talon, R. Frattini, A. Reyes-Carmona, A. Jiménez-López and E. Rodríguez-Castellón, Appl. Catal., B, 2013, 129, 556–565 CrossRef CAS.
- X. Guo, A. Yin, W. L. Dai and K. Fan, Catal. Lett., 2009, 132, 22–27 CrossRef CAS.
- Q. Xin, A. Papavasilou, N. Boukos, A. Glisenti, J. P. H. Li, Y. Yang, C. J. Philippopoulos, E. Poulakis, F. K. Katsaros, V. Meynen and P. Cool, Appl. Catal., B, 2018, 223, 103–115 CrossRef CAS.
- A. Papavasiliou, T. Van Everbroeck, C. Blonda, B. Oliani, E. Sakellis, P. Cool, P. Canu and F. K. Katsaros, Fuel, 2022, 311, 122491 CrossRef CAS.
- T. Van Everbroeck, A. Papavasiliou, R. G. Ciocarlan, E. Poulakis, C. J. Philippopoulos, E. O. Jardim, J. Silvestre-Albero, E. Sakellis, P. Cool and F. K. Katsaros, Catalysts, 2022, 12(6), 628 CrossRef CAS.
- B. Dou, D. Yang, T. Kang, Y. Xu, Q. Hao, F. Bin and X. Xu, Carbon Resour. Convers., 2021, 4, 55–60 CrossRef CAS.
- W. Yu, Q. Zhou, H. Wang, Y. Liu, W. Chu, R. Cai and W. Yang, J. Mater. Sci., 2020, 55, 2321–2332 CrossRef CAS.
- O. Mangla and S. Roy, Proceedings, 2019, 3(1), 10 Search PubMed.
- S. N. Basahel, M. Mokhtar, E. H. Alsharaeh, T. T. Ali, H. A. Mahmoud and K. Narasimharao, Catalysts, 2016, 6(4), 57 CrossRef.
- J. L. Ayastuy, A. Gurbani, M. P. González-Marcos and M. A. Gutiérrez-Ortiz, Int. J. Hydrogen Energy, 2010, 35, 1232–1244 CrossRef CAS.
- J. F. Xu, W. Ji, Z. X. Shen, W. S. Li, S. H. Tang, X. R. Ye, D. Z. Jia and X. Q. Xin, J. Raman Spectrosc., 1999, 30, 413–415 CrossRef CAS.
- B. M. Reddy, P. Bharali, P. Saikia, A. Khan, S. Loridant, M. Muhler and W. Grünert, J. Phys. Chem. C, 2007, 111, 1878–1881 CrossRef CAS.
- F. Goubin, X. Rocquefelte, M. Whangbo, Y. Montardi, R. Brec and S. Jobic, Chem. Mater., 2004, 16, 662–669 CrossRef CAS.
- J. Du, W. Chen, G. Wu, Y. Song, X. Dong, G. Li, J. Fang, W. Wei and Y. Sun, Catalysts, 2020, 10, 1–11 Search PubMed.
- A. G. Kong, H. W. Wang, X. Yang, Y. W. Hou and Y. K. Shan, Microporous Mesoporous Mater., 2009, 118, 348–353 CrossRef CAS.
- K. V. R. Chary, G. V. Sagar, C. S. Srikanth and V. V. Rao, J. Phys. Chem. B, 2007, 111, 543–550 CrossRef CAS PubMed.
- R. Si, Y. W. Zhang, S. J. Li, B. X. Lin and C. H. Yan, J. Phys. Chem. B, 2004, 108, 12481–12488 CrossRef CAS.
- T. Tsoncheva, R. Ivanova, J. Henych, M. Dimitrov, M. Kormunda, D. Kovacheva, N. Scotti, V. D. Santo and V. Štengl, Appl. Catal., A, 2015, 502, 418–432 CrossRef CAS.
- G. Ranga Rao and H. Ranjan Sahu, Proc. – Indian Acad. Sci., Chem. Sci., 2001, 113, 651–658 CrossRef.
- X. Yang, X. Ma, X. Yu and M. Ge, Appl. Catal., B, 2020, 263, 118355 CrossRef CAS.
- M. Simonov, Y. Bespalko, E. Smal, K. Valeev, V. Fedorova, T. Krieger and V. Sadykov, Nanomaterials, 2020, 10, 1–19 CrossRef PubMed.
- J. L. Cao, Y. Wang, T. Y. Zhang, S. H. Wu and Z. Y. Yuan, Appl. Catal., B, 2008, 78, 120–128 CrossRef CAS.
- Y. Shao, T. Wang, K. Sun, Z. Zhang, L. Zhang, Q. Li, S. Zhang, G. Hu and X. Hu, Green Energy Environ., 2021, 6, 557–566 CrossRef CAS.
- L. Liu, Z. Yao, B. Liu and L. Dong, J. Catal., 2010, 275, 45–60 CrossRef CAS.
- P. Kaminski, M. Ziolek and J. A. Van Bokhoven, RSC Adv., 2017, 7, 7801–7819 RSC.
- M. M. Natile and A. Glisenti, Surf. Sci. Spectra, 2006, 13, 17–30 CrossRef CAS.
- A. Rokicińska, P. Majerska, M. Drozdek, S. Jarczewski, L. Valentin, J. Chen, A. Slabon, S. Dzwigaj and P. Kuśtrowski, Appl. Surf. Sci., 2021, 546, 149148 CrossRef.
Footnote |
| † Electronic supplementary information (ESI) available. See DOI: https://doi.org/10.1039/d4ma00324a |
| This journal is © The Royal Society of Chemistry 2024 |

