 Open Access Article
Creative Commons Attribution 3.0 Unported Licence
Hydrogen storage capacity of freeze cast microporous monolithic composites
Catherine
Butler
 a,
Timothy J.
Mays
 b,
Vijay
Sahadevan
c,
Rachel
O’Malley
c,
Daniel P.
Graham
c and
Christopher R.
Bowen
 *a
*a
aDepartment of Mechanical Engineering, University of Bath, Claverton Down, Bath BA2 7AY, UK. E-mail: msscrb@bath.ac.uk
bDepartment of Chemical Engineering, University of Bath, Claverton Down, Bath BA2 7AY, UK
cGKN Aerospace, Global Technology Centre, Taurus Rd, Patchway, Filton, Bristol BS34 6FB, UK
First published on 18th July 2024
Abstract
Low carbon hydrogen is a highly effective clean energy carrier due to its high gravimetric energy density (higher heating value of 142 MJ kg−1) and, when it is oxidised to yield power and heat, the only product is water. However, the low volumetric energy density of hydrogen (<14 MJ L−1 under any condition) requires heavy and complex storage tanks when stored as a high pressure gas (70 MPa) or a low pressure liquid (<0.16 MPa, 20 K). Highly adsorbent porous materials show potential to improve tank capacity by increasing the volumetric density, or decreasing the operating pressure, for a given amount of fuel, thereby making it beneficial for use in transport applications. Here, we demonstrate the use of freeze casting to manufacture highly adsorbent 3D structures that consist of a matrix of polymer of intrinsic microporosity 1 (PIM-1) filled with high surface area activated carbons (MSC-30 and MSC-30SS). We present the first reported hydrogen adsorption data for freeze cast monoliths and show that they generally follow a rule of mixtures in terms of hydrogen storage capacities of the matrix and filler, providing a route for the design of these materials. The addition of water into the freeze casting solution is also explored for the first time, which lead to an increased surface area and mass of hydrogen stored above that of PIM-1 powder. The experimental adsorpion data for the monoliths fit well to the Tóth isotherm, which allows their maximum storage capacity to be predicted. It is demonstrated that the monoliths formed are able to store more hydrogen than compression at 77 K for pressures below 0.4 MPa. The composites show potential for use in the ullage region of a liquid hydrogen tank, to reduce boil-off, increasing safety and reliability of storage tanks. Our work provides the first reported data for hydrogen storage capability of adsorptive composites, which show potential to be incorporated as three-dimensional inserts into liquid hydrogen storage tanks.
Introduction
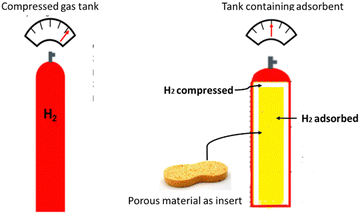
The world's increasing population, industrialisation, and wealth is leading to a rapidly increasing energy demand. According to Züttel,1 energy consumption has increased by a factor of eighty during the twentieth century, although the population of human beings has increased by only six times. Currently, 85% of the world's energy originates from non-renewable sources such as oil, coal, and gas. This resource is finite and depleting rapidly, leading to increased prices1 and atmospheric emissions of carbon dioxide as a result of burning these fuels is a major contributor to global heating and climate change.Hydrogen has been identified as a clean fuel source due to its high energy density per unit mass (142 MJ kg−1![[thin space (1/6-em)]](https://www.rsc.org/images/entities/char_2009.gif) 2) and only producing water as the material product when oxidised. However, hydrogen has an extremely low energy density per unit volume as a gas in ambient conditions (c. 0.08 MJ L−1), which makes it extremely difficult to store without the use of either highly pressurised gas tanks (c. 70 MPa) or cryogenic liquid tanks (c. 20 K). Both storage options are complex and heavy, thereby making them expensive, energy intensive, materials intensive and unsuitable for specific applications. The use of highly porous solid material as adsorbent tank inserts, or liners (see Fig. 1), could allow the storage capacity to be increased, or the pressure decreased for the same mass of fuel.3 A potential application is storing hydrogen in the ullage region of a liquid storage tank at lower pressure, to reduce over pressurisation and boil-off.
2) and only producing water as the material product when oxidised. However, hydrogen has an extremely low energy density per unit volume as a gas in ambient conditions (c. 0.08 MJ L−1), which makes it extremely difficult to store without the use of either highly pressurised gas tanks (c. 70 MPa) or cryogenic liquid tanks (c. 20 K). Both storage options are complex and heavy, thereby making them expensive, energy intensive, materials intensive and unsuitable for specific applications. The use of highly porous solid material as adsorbent tank inserts, or liners (see Fig. 1), could allow the storage capacity to be increased, or the pressure decreased for the same mass of fuel.3 A potential application is storing hydrogen in the ullage region of a liquid storage tank at lower pressure, to reduce over pressurisation and boil-off.
This increase in storage performance is due to hydrogen being attached as a dense layer to the surface of the material by physisorption, which is reversible and requires minimal energy input to desorb the hydrogen. High surface area materials such as metal organic frameworks (MOFs), activated carbons, porous aromatic frameworks (PAFs), and zeolites have been previously investigated.3–7 In addition to a high surface area, the pore size of these materials has been shown to affect the hydrogen storage capacity, where pores of width 0.6–0.7 nm are optimal.8 As a result, microporous materials (pore widths <2 nm) are the most appropriate for storing hydrogen and demonstrate uptakes that are sufficient to meet the system guidelines set by US Department of Energy (DoE) for light duty fuel cell vehicles (5.5 wt%9). However, this level of storage includes the mass of the storage system as a whole, and not only the material itself. Work published to date has primarily focused on the hydrogen uptake of a range of highly microporous materials;3–7 however, the incorporation of powders into storage tanks can lead to fouling, as well as complex handling and safety issues. Little work to date has been published on forming such storage materials into usable geometries with sufficient hydrogen storage, mechanical, and thermal properties to withstand tank conditions. A potential material to form into a usable geometry is the polymer of intrinsic microporosity 1 (PIM-1), which has demonstrated good processability as well as reasonable hydrogen storage capacity due to its constrained spirocentre that prevents polymer chains packing efficiently and creates pores of up to 2 nm in width between them.10 The surface area of the material is, however, relatively low at approximately 700 m2 g−1![[thin space (1/6-em)]](https://www.rsc.org/images/entities/char_2009.gif) 10 compared to materials such as activated carbons, which can store up to four times as much hydrogen.11 Since activated carbons are typically used in the form of powders or grains they are more difficult to process and handle. The potential to combine the processability of PIM-1 with the high storage capacity of activated carbon provides a route to exploit the advantages of each material.
10 compared to materials such as activated carbons, which can store up to four times as much hydrogen.11 Since activated carbons are typically used in the form of powders or grains they are more difficult to process and handle. The potential to combine the processability of PIM-1 with the high storage capacity of activated carbon provides a route to exploit the advantages of each material.
Neville et al.12 developed a method for freeze casting PIM-1 with an activated carbon filler. Freeze casting is a well-established method that typically uses a suspension of solid particles, with water as the solvent. Porosity is developed in freeze cast materials as a result of the expulsion of solid particles from the solvent freeze front. The solvent is then removed by sublimation, using freeze drying, which leaves the structure of the frozen material intact.13 However, for PIM-1 to be freeze cast, it must be dissolved in a solvent, such as chloroform, to form a solution which is subsequently frozen and is different to the established method of freezing a suspension, where particles are expelled from the freezing front.
In this paper we expand on the freeze casting method of Neville et al.12 to produce highly adsorbent 3D structures, that will be termed monoliths; these include monolithic structures of PIM-1, and composite monoliths of PIM-1 doped with activated carbons of MSC-30, and MSC-30SS. Both MSC-30 and MSC-30SS carbons are derived from petroleum coke, where MSC-30SS has a small particle size (5 μm) compared to the larger sized MSC-30 (60–150 μm). In this study, 20 wt% of activated carbon and 80 wt% PIM-1 were used and chloroform was used as a solvent during freeze casting to form monoliths. Neville et al.12 carried out structural and surface characterisation analysis for their monoliths to demonstrate the capability of producing tank inserts using a freeze casting method. Here, we create monoliths using higher surface area activated carbon (MSC-30 and MSC-30SS) materials and incorporate water into the freeze-casting solution to tailor the freezing characteristics and reduce the burden of chemical solvents. We also provide, for the first time, characterisation data of the hydrogen storage properties of these monoliths at low pressures, and fit the experimental data to the Tóth equation14 to predict the maximum capacity of the powders and monoliths, and the pressures required to achieve them. We also provide the first demonstration that the freeze casting method allows tank inserts or liners to retain, or improve, their hydrogen storage capacity and that the monolithic composites follow the rule of mixtures in terms of hydrogen storage. A comparison of the mass of hydrogen that can be stored by a typical activated carbon and the monoliths with compression is also presented. This work therefore leads to the realisation of a practical use for highly adsorbent materials within storage tank environments.
Experimental (methods, techniques & materials)
Materials
Tetrafluoroterephthalonitrile (2,3,5,6-tetrafluoro-1,4-dicyanobenzene) (Alfa Aesar, purity 98%), potassium carbonate (Alfa Aesar, purity 98%), N,N-dimethylformamide (DMF) (Acroseal, purity 99.8%), and methanol (Alfa Aesar, 99%) were used as received from Fischer Scientific. 3,3,3′,3′-tetramethyl-1,1′-spirobisindane-5,5′,6,6′-tetraol (96%) was used as received from Merck Life Science UK Limited. These chemicals are used for the synthesis of PIM-1.Activated carbons, MSC-30 (large particle size, 60–150 μm) and MSC-30SS (small particle size, 5 μm) were used in as received condition from Kansai Coke and Chemicals Co. Ltd, Japan. MSC-30 and MSC-30SS are the materials that have superseded AX21 and are both alkali-activated (potassium hydroxide KOH) carbon manufactured from petroleum coke. However AX21 has a lower specific surface area of c. 2000 m2 g−1 compared to >3000 m2 g−1 for MSC-30 and MSC-30SS.
Synthesis of polymer of intrinsic microporosity (PIM-1)
PIM-1 was prepared following a procedure published by Rochat et al.4 where anhydrous potassium carbonate (K2CO3) (16.59 g, 120 mmol), 3,3,3′,3′-tetramethyl – 1,1′-spirobisindane-5,5′,6,6′ – tetraol (5.11 g, 14.6 mmol), and tetrafluoroterephthalonitrile (3.0 g, 14.7 mmol) were stirred in dry dimethylformamide (DMF, 100 ml) in a round bottomed flask, under 1 bar nitrogen at 65 °C for 72 h. Once cooled, the mixture was poured into a beaker of water (300 ml) and filtered to collect the yellow solid. This was repeated two more times with water and then a third time using acetone. The powder was dried under vacuum before the solid was dissolved in 100 ml chloroform and pipetted into 900 ml of methanol. The powder was collected by filtration and dried. This was repeated two more times before the PIM-1 powder was finally collected and dried under vacuum (1 × 10⁻⁶ MPa) at 80 °C for 6 h.Freeze casting to create PIM-1 and composite monoliths
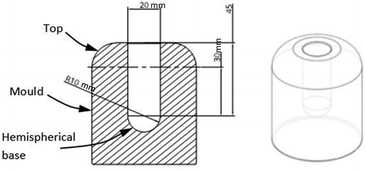
Four monoliths were manufactured following a freeze casting method by Neville et al.,12 where powdered PIM-1 material was dissolved in chloroform to form a solution. An additively manufactured pre-prepared resin cylindrical mould, 20 mm diameter, 45 mm length with 10 mm radius hemispherical bottom (Fig. 2) was frozen using liquid nitrogen. The chloroform solution was poured into the frozen mould (77 K) and left for 20 min. It was then transferred to a freeze drier and left for 24 h (−55 °C and 2 × 10⁻⁶ MPa). The chloroform was removed by sublimation, leaving the solid monolithic structure behind.The four monoliths comprised:
(i) A mass of 2 g of PIM-1 in 10 ml chloroform; this is termed the PIM-1 monolith.
(ii) A mass of 2 g of PIM-1 in 9 ml chloroform and 1 ml water (10 vol%); this is termed the PIM-1 water monolith, where the water increases the freezing point of chloroform (210 K) and changes the solvent templating.
(iii) A mass of 1.6 g of PIM-1 and 0.4 g (20 wt%) MSC-30 in 10 ml chloroform; this is termed the PIM-1 MSC-30 monolith.
(iv) A mass of 1.6 g PIM-1 and 0.4 g (20 wt%) MSC-30SS in 10 ml chloroform; this is termed the PIM-1 MSC-30SS monolith.
Surface characterisation of PIM-1 and activated carbons
Nitrogen adsorption analysis was carried out for the region p/p0 = 0.05–0.315 on a 3Flex Instrument from Micrometrics at 77 K to determine the Brunauer–Emmett–Teller (BET) surface area of the materials; where p is absolute pressure and p0 is saturation pressure. The temperature was maintained at 77 K throughout the experiment using a dewar of liquid nitrogen and an isothermal jacket. Oxygen free nitrogen (UN1066) was used, and an equilibration time of 10 s was allowed for each pressure change. The British Standard (BS ISO 9277:2010) was used to estimate the BET Surface area in m2 g−1. Prior to analysis, a degas process was carried out at 200 °C under vacuum (6.7 × 10⁻⁶ MPa) for 12 h for PIM-1 and the composite monoliths. For MSC-30 and MSC-30SS powders the degas was carried out at 350 °C for 8 h under vacuum (6.7 × 10⁻⁶ MPa), to remove moisture and solvents from the pores of the powder samples.Hydrogen isotherm data of powders and monoliths
Hydrogen adsorption experiments at low pressure (up to 0.1 MPa) were carried out on a 3Flex sieverts type instrument from Micrometrics at 77 K. The temperature was maintained using a dewar of liquid nitrogen and an isothermal jacket. High purity hydrogen (BIP Plus UN1049) was used, and an equilibration time of 45 s was allowed for each pressure change.Samples with a mass of 100 mg were used in the analysis. Prior to analysis, a degas procedure was carried out at 200 °C under vacuum (6.7 × 10⁻⁶ MPa) for 12 h for PIM-1 and composite monoliths. When testing the MSC-30 and MSC-30SS powders the degas was carried out at 350 °C for 8 h under vacuum (6.7 × 10⁻⁶ MPa), to remove moisture and solvents from the pores of the sample.
The experimental data was plotted and fitted to the Tóth isotherm (eqn (1)),14 using a Levenburg–Marquadt16 non-linear curve fit in OriginPro software to predict the isotherm at higher pressure; this was used to identify the maximum hydrogen storage capacity, and determine the pressure at which this would occur. The Tóth isotherm is known to be a good model for many simple (type I) isotherms.8 This isotherm is given by eqn (1)
 | (1) |
Structural characterisation of monoliths
X-ray computed tomography (CT) was used as a non-destructive evaluation technique to examine the internal structure of the monoliths. The four freeze cast monoliths, outlined above, were examined using a Nikon H 225 ST 3D CT scanner, with data processed using Avizo Fire 9.0 software.Modelling of adsorption and compression
Modelling to compare mass of hydrogen stored by adsorption and compression was carried out using Matlab and Excel, where the NIST Chemistry webbook was used to calculate the mass of hydrogen stored by compression. Experimental isotherm data for activated carbon and the monoliths created are used to calculate the mass of hydrogen stored by adsorption at 77 K.Results and discussion
Freeze cast forming of PIM-1 and composite monoliths
Four monoliths, two consisting of PIM-1 and two with 20 wt% activated carbon doped onto PIM-1 (80 wt%) were successfully formed using the freeze casting method described; these are shown in Fig. 3. The monolithic structures formed are of sufficient mechanical strength that they can be readily handled and, although they do not emerge in the exact shape of the mould, they show reasonable correlation to one another. The lines from the mould, which are formed during three-dimensional printing of the mould, are indented onto the surface of the monoliths. The PIM-1 monolith has two distinct colour regions, a darker orange colour and a bright yellow (Fig. 3(a)), which indicates two distinct phases are being formed. However, the PIM-1-water monolith had a more homogeneous yellow colour throughout. The PIM-1 MSC-30 composite monolith and PIM-1 MSC-30SS composite monolith were both relatively homogeneous in appearance (including in colour) but it is more difficult to observe differences due to the dark nature of their colour as a result of the carbon filler. The PIM-1 MSC-30SS composite monolith exhibits more defects on its surface than the other monoliths. The diameter of each of the monoliths was approximately 12 mm, but they varied in length from 25 mm to 30 mm (Fig. 3). | ||
| Fig. 3 PIM-1 and composite monoliths formed from freeze casting (a) PIM-1, (b) PIM-1 water, (c) PIM-1 MSC-30, (d) PIM-1 MSC-30SS. | ||
X-ray computed tomography images of the four monoliths were obtained to analyse their internal structure, which are shown in Fig. 4.
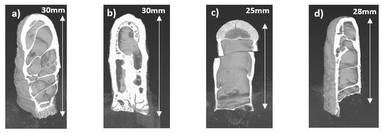 | ||
| Fig. 4 Computer tomography (CT) scans of monoliths formed from freeze casting (a) PIM-1, (b) PIM-1 water, (c) PIM-1 MSC-30, (d) PIM-1 MSC-30SS. | ||
The CT scan of the PIM-1 monolith exhibited a thick wall at the hemispherical base of mould (see top of monolith in Fig. 4) and large voids within the structure. This could be due to the PIM-1 settling during the freezing process and the external wall structure is created from material freezing directly onto the walls of the mould. The voids inside the monolith have some similarity to those obtained by Neville et al.12 which may be due to a phenomenon observed in hemispherical convection models where a central void is created as the warm solution rises.12 The PIM-1 water monolith in Fig. 4(b) has a more solid internal structure compared to the other monoliths, with some hexagonal shaped voids. These characteristics could be due to the presence of the water in the solution which would increase the freezing point of the chloroform solution allowing it to freeze more quickly.17 These microstructural differences could be due to different templating from the freeze front of water, as chloroform and water are immiscible.17 The PIM-1 MSC-30 monolith in Fig. 4(c) is almost fully hollow, with an agglomeration of carbon particles visible at the top of the monolith; this was the hemispherical shape located at the bottom of the mould (Fig. 2). This indicates that the carbon has settled due to gravity prior to the solution being frozen. This is not desirable as a networked homogeneous structure is expected to be optimal for both storage and strength. The PIM-1 MSC-30SS monolith (Fig. 4(d)) is similar in structure to the PIM-1 monolith but has defects on its surface. The carbon particles are not visible, implying that they are more evenly spread throughout the structure than for the PIM-1 MSC-30 monolith which uses a larger carbon particle size. Therefore, the smaller particle sized MSC-30SS activated carbon is more desirable for freeze casting the monoliths than the MSC-30 since the smaller particles remain more homogeneously distributed throughout the structure during the freeze casting process.
Surface characteristics of monoliths
Nitrogen isotherms at 77 K were analysed for both the powdered materials and the monoliths formed using the method set out in the experimental methods section. The linear form of the BET equation (for p/p0 = 0.05–0.315) for each of the powdered materials and monoliths are presented in Fig. 5, where hollow symbols represent the initial powdered materials and the filled symbols represent the freeze cast monoliths. The ratio p/p0 (y axis) is relative pressure and na is the amount of gas adsorbed.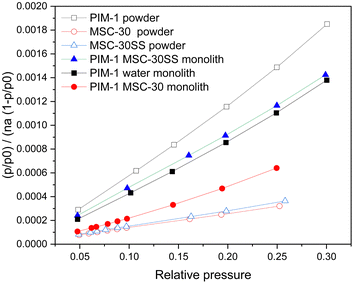 | ||
| Fig. 5 Nitrogen isotherm linear form of BET equation for PIM-1 Powder, MSC-30, MSC-30SS powder and monoliths. Hollow symbols represent powders and filled symbols represent monoliths. | ||
The MSC-30 and MSC-30SS carbon powders exhibit the shallowest gradient in Fig. 5, indicating a higher surface area, while the PIM-1 powder has the steepest gradient indicating a lower surface area. The addition of 1 ml of water into the solution to form the PIM-1 water monolith reduced the gradient compared to the PIM-1 powder. The BET surface areas calculated are presented in Table 1. The PIM-1 powder has the lowest BET surface area of 737.5 m2 g−1, which is similar to that reported in the literature.10 The MSC-30 activated carbon powder has the highest BET surface area of 3571 m2 g−1 and the smaller particle size MSC-30SS is slightly lower at 3068 m2 g−1. The surface areas for these materials have not been reported in the literature, but the values calculated here are higher than some other activated carbons; for example, AX21 2513 m2 g−1.11 The BET surface areas for the PIM-1 MSC-30 monolith (1404 m2 g−1) and PIM-1 MSC-30SS monolith (961 m2 g−1) follow the rule of mixtures (eqn (2))
| nc = (wt%p × np) + (wt%ac × nac) | (2) |
| Material | BET surface area (m2 g−1) |
|---|---|
| PIM-1 powder | 737.5 |
| MSC-30 powder | 3571.4 |
| MSC-30SS powder | 3068.4 |
| PIM-1 water monolith | 1013.1 |
| PIM-1 MSC-30 monolith | 1404.2 |
| PIM-1 MSC-30SS monolith | 961.8 |
The addition of water into the freeze-casting solution increased the BET surface area of the PIM-1 water monolith above that of the original PIM-1 powder (1013 m2 g−1). This could be due to an increase in the number of micropores due to the freeze casting, or an improvement in the overall pore network, thereby allowing easier access to micropores that already exist. The addition of activated carbon into the freeze casting solution did not increase the BET surface area above that predicted by the rule of mixtures which indicates that the freeze casting process only increases the surface area of materials if water is included in the solution. The addition of carbon particles appeared to have disrupted the skin that is formed by the PIM-1 monolith.
Hydrogen adsorption isotherms
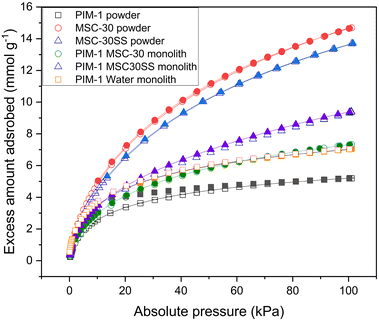
Hydrogen isotherms were analysed for both the powdered PIM-1 polymer and carbon materials, and the freeze cast monoliths formed. The resulting isotherms are presented in Fig. 6. The hollow symbols represent adsorption, while the filled symbols represent desorption. The symbols represent experimental data and the lines represent fitting to the Tóth isotherm, see eqn (1).The MSC-30 and MSC-30SS carbon powders adsorbed the most hydrogen (14.69 mmol g−1 and 13.72 mmol g−1 respectively, both at p = 100 kPa) since they have the largest surface areas. However, while the larger particle size MSC-30 has the higher surface area, it adsorbs slightly less hydrogen. This could be due to presence of more pores less than 1 nm in width for the smaller sized MSC-30SS particles.3 Both of these carbons exhibit reversible type I isotherms. The PIM-1 powder adsorbs the smallest amount of hydrogen (5.19 mmol g−1 at p = 100 kPa) since it has the smallest surface area (737.5 m2 g−1). PIM-1 also shows hysteresis, which indicates that some of the hydrogen remains in the pores after desorption has occurred. It was not possible to obtain results for the PIM-1 monolith, and this implies that the pores are blocked by the freeze casting method for the darker, glassier region (see Fig. 3). When water was added to the freeze-casting solution this affect was reduced and hydrogen isotherms were obtained, where the amount of hydrogen adsorbed was greater than that for the PIM-1 powder (7 mmol g−1). This is likely due to the introduction of water to the freezing process increasing the freezing temperature of the chloroform and allowing it to freeze more rapidly. The microstructure of the monolith has also been changed, which is likely due to the presence of water which would change the solvent templating, as chloroform and water are immiscible.17 More pores have therefore been created, which is corroborated by the BET surface area calculation which shows that the PIM-1 water monolith has a higher surface area than the powdered material (1013 m2 g−1). There is also the possibility of the manufacturing process creating a networked porous structure that has allowed easier access to the pores of the material. The amount of hydrogen adsorbed by the PIM-1 MSC-30 monolith and PIM-1 MSC-30SS monolith (6.15 mmol g−1 and 9.4 mmol g−1) agree well with the values predicted by the rule of mixtures (eqn (2)) where nc is the amount of hydrogen adsorbed by the composite monolith (mmol g−1), wt%p is percentage weight of polymer in composite monolith, np is amount of hydrogen adsorbed by the polymer powder (mmol g−1), wt%ac is percentage weight of activated carbon in the composite monolith and nac is amount of hydrogen adsorbed by the activated carbon powder (mmol g−1). The graph shows that the addition of the filler material into the composite monoliths, removes the hysteresis displayed by the PIM-1 powder. This is important for the practical application of storing hydrogen within these monoliths.
The experimental hydrogen adsorption data were fitted to the Tóth isotherm (eqn (1)). Best fit parameters are presented in Table 2, along with the pressure that would be required to achieve 99% of the adsorption capacity qmax. The PIM-1 powder has the lowest level of hydrogen storage (1.75 wt% at 478 kPa), with MSC-30SS exhibiting the highest (12.70 wt% at a pressure of 2.56 MPa). The MSC-30 has a predicted capacity of 10.7 wt% at a pressure of 2.3 MPa; although it should be noted that this pressure is approximately four times that used in the experiment and only provides a guideline on the achievable level of hydrogen storage. The predicted capacity of the monoliths follows the same trend as the hydrogen storage at low pressure, namely that the largest capacity is for the MSC-30SS powder, and the lowest capacity is for the PIM-1 powder. These materials show promise to meet the Department of Energy (DoE) guidelines for light duty fuel cell vehicles as the wt.% of hydrogen stored is significantly larger than that required.9 These results have not been verified experimentally but have been compared to literature values. Ref. 3 shows that at 0.1 MPa the hydrogen uptake of AX21 is 2.5 wt% and at 10 MPa it is 9.24 wt%. For MSC-30 the amount of hydrogen adsorbed is 13.67 mmol g−1, which is equivalent to 2.75 wt%. The fitting to the Tóth isotherm predicted that the capacity would be 12.2% at 2.5 MPa, this is similar to ref. 3 and therefore assumed to be a suitable prediction.
| Material | K (kPa−1) | n (−) | q max (wt%) | Pressure to reach 99% qmax (kPa) |
|---|---|---|---|---|
| PIM-1 powder | 0.207 | 0.447 | 1.75 | 477.96 |
| MSC-30 powder | 0.040 | 0.333 | 12.80 | 2467.60 |
| MSC-30SS powder | 0.039 | 0.331 | 12.20 | 2557.48 |
| PIM-1 water monolith | 0.442 | 0.220 | 2.36 | 450.53 |
| PIM-1 MSC-30 monolith | 0.390 | 0.117 | 2.56 | 294.51 |
| PIM-1 MSC-30SS monolith | 0.172 | 0.075 | 4.30 | 1842.20 |
Other porous materials such as carbon nanotubes have shown hydrogen storage capacities of 10.36 wt%18 at 77 K which are comparable to that of the activated carbon. Zeolites show capacities of 1–1.82 wt%19 which is more comparable to the lower storage capacity of the PIM-1 powder.
The enthalpy of adsorption of both the monoliths and powders was calculated from the Van’t Hoff plot of adsorption isotherms at three different temperatures of 77 K, 195 K, and 273 K; these are presented in Table 3.
| Material | Enthalpy of adsorption (kJ mol−1) |
|---|---|
| PIM-1 powder | 7.69 |
| MSC-30 powder | 6.74 |
| MSC-30SS powder | 6.71 |
| PIM-1 water monolith | 8.03 |
| PIM-1 MSC-30 monolith | 7.22 |
| PIM-1 MSC-30SS monolith | 8.50 |
From the slope of the van’t Hoff plots it is determined that the enthalpy of adsorption for PIM-1 is 7.69 kJ mol−1, for MSC-30 is 6.74 kJ mol−1 and MSC-30SS is 6.71 kJ mol−1. The literature has reported the enthalpy of adsorption for PIM-1 as 7–7.5 kJ mol−1![[thin space (1/6-em)]](https://www.rsc.org/images/entities/char_2009.gif) 20 and as 6.4 kJ mol−1 for the activated carbon AX21.21 These data therefore corroborate the literature values. For the monoliths, the enthalpies of adsorption are the following (i) the PIM-1 water monolith is 8.03 kJ mol−1, (ii) the PIM-1 MSC-30 monolith is 7.22 kJ mol−1 and (iii) the PIM-1 MSC-30SS monolith is 8.5 kJ mol−1. The results show that the adsorption enthalpies have increased slightly from their powdered form, however, they remain in the range expected for nanoporous adsorbents (<10 kJ mol−1). These adsorption enthalpies are relatively low and highlight a weak adsorption strength when compared to kinetic energy of molecules at ambient temperature. Since adsorption is an exothermic reaction a lower enthalpy of adsorption produces a smaller amount of heat when adsorption occurs; this is beneficial for applications where the temperature needs to remain constant or low. Other microporous materials such as zeolites exhibit adsorption enthalpies of 6–10 kJ mol−1,22,23 and carbon nanotubes are 4–8 kJ mol−1,18,24 which are in the same range as for the PIM-1 and activated carbon powders, and the resulting monoliths.
20 and as 6.4 kJ mol−1 for the activated carbon AX21.21 These data therefore corroborate the literature values. For the monoliths, the enthalpies of adsorption are the following (i) the PIM-1 water monolith is 8.03 kJ mol−1, (ii) the PIM-1 MSC-30 monolith is 7.22 kJ mol−1 and (iii) the PIM-1 MSC-30SS monolith is 8.5 kJ mol−1. The results show that the adsorption enthalpies have increased slightly from their powdered form, however, they remain in the range expected for nanoporous adsorbents (<10 kJ mol−1). These adsorption enthalpies are relatively low and highlight a weak adsorption strength when compared to kinetic energy of molecules at ambient temperature. Since adsorption is an exothermic reaction a lower enthalpy of adsorption produces a smaller amount of heat when adsorption occurs; this is beneficial for applications where the temperature needs to remain constant or low. Other microporous materials such as zeolites exhibit adsorption enthalpies of 6–10 kJ mol−1,22,23 and carbon nanotubes are 4–8 kJ mol−1,18,24 which are in the same range as for the PIM-1 and activated carbon powders, and the resulting monoliths.
Modelling of hydrogen storage (adsorption and compression)
Modelling of the mass of hydrogen stored in a tank was carried out to estimate the difference between the mass of hydrogen that could be stored in a 1.4 l tank using either compression or adsorption at the same temperature and pressure. This identifies the range of potential conditions at which the composite monoliths formed could store more hydrogen by adsorption than by simple compression at the same temperature and pressure, which allows identification of suitable applications. Fig. 7 shows the mass of hydrogen predicted to be stored by different conditions of compression (green lines) and adsorption (blue lines) and is calculated based on a 1.4 l tank.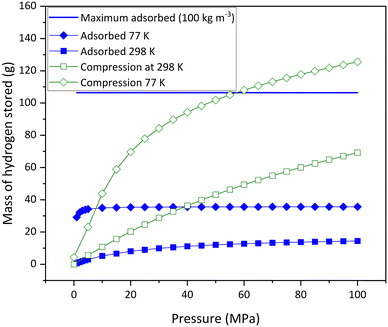 | ||
| Fig. 7 Mass of hydrogen stored by compression at 77 K and 298 K vs. mass of hydrogen stored by adsorption on AX21 at 77 K, 298 K and an upper limit. | ||
The unfilled green compression lines assume that the tank contains no adsorbent and highlights how much hydrogen can be simply stored by compression at 77 K and 298 K respectively (data available in the literature11), over a range of pressures and calculated using the NIST Chemistry Webbook. The solid blue line shows the mass of hydrogen stored, assuming the density of hydrogen in the pores of the activated carbon is 100 kg m−3; this value represents a maximum density of adsorbed hydrogen that has been observed experimentally8 and is used simply as an upper limit of what could be achievable. The blue diamond and square filled symbols show the mass of hydrogen that can be stored by adsorption at 77 K and 298 K respectively, over a range of pressures. Both lines are calculated using experimental isotherm data for an activated carbon, AX21.11Fig. 7 shows that the upper limit of adsorption (solid blue line) is beneficial over compression at 77 K at pressures up to approximately 60 MPa and compressed gas at 298 K at pressures higher than 100 MPa. The experimental data shows that adsorption at 77 K (blue diamond) is beneficial over compressed gas at 77 K at pressures up to approximately 8 MPa and at 298 K at pressures up to approximately 40 MPa. However, experimental adsorption at 298 K (blue square) is not beneficial over any of the other conditions at any pressures.
The modelling demonstrates that there are some conditions where using adsorptive material in a hydrogen storage tank can provide a benefit over the amount of hydrogen that can be stored by compression alone, at the same temperature and pressure. The analysis shows that the largest gain for a typical activated carbon would be for an adsorptive material at 77 K and low pressure <8 MPa. However, assuming the upper limit of experimental hydrogen storage in adsorptive material (density of 100 kg m−3) would mean that adsorption could be beneficial over compression up to a pressure of 60 MPa at a temperature of 77 K. Outside of these conditions, compression would be able to store more hydrogen than adsorption.
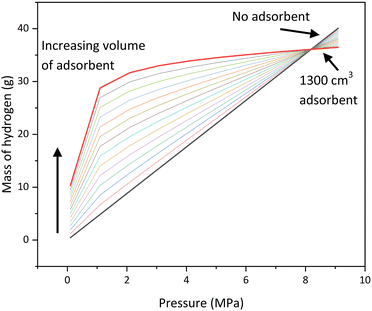
The next step is to determine how the mass of hydrogen stored varies with the volume of adsorbent in the tank at pressures from 0–10 MPa. In Fig. 8 the lower straight diagonal black line represents compression as a storage mechanism for comparison. Each consecutive line represents an increase in volume of adsorbent in the tank, ranging from 100 cm3 to 1300 cm3. The mass of hydrogen in the volume of the tank, where there is no adsorbent present, is calculated using the ideal gas law, as it is at low pressure (<10 MPa) where the law is still obeyed. The mass of hydrogen adsorbed is calculated from the experimental isotherm data for AX2111 and the total mass of hydrogen is the sum of the hydrogen adsorbed and the hydrogen compressed. It is assumed that there is no compressed gas present in the pores.
The results demonstrate that at a pressure of approximately 8 MPa, the mass of hydrogen stored is equal for all volumes of adsorbent and compressed gas. At low pressures (0–4 MPa) the amount of adsorbent has a significant effect on the mass of hydrogen stored in the tank, but at higher pressures (>6 MPa) the effect becomes less significant. Above approximately 8 MPa, the lines intersect, and compression becomes beneficial compared to adsorption. The maximum pressure at which adsorption is beneficial is not influenced by the volume of adsorbent in the tank. The reason for this is that as pressure increases, the mass of hydrogen stored by adsorption increases until the capacity of the material is reached. Once this capacity is reached, no more hydrogen can be stored in the material. However, for compression, the mass of hydrogen stored will increase with the increasing pressure.
The analysis provides a guide for when adsorption on a representative activated carbon provides a benefit for the mass of hydrogen stored compared to compression at the same temperature and pressure. Although this modelling approach is based on a specific activated carbon (AX21), the method developed can be used for any material combination or monolith for which isotherm data is available. The model was therefore adapted to compare the mass of hydrogen stored by the monoliths to that for compression at 77 K, where the results are presented in Fig. 9.
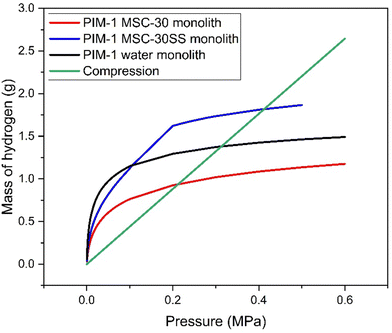 | ||
| Fig. 9 Mass of hydrogen stored by compression at 77 K vs. mass of hydrogen stored by adsorption on monoliths at 77 K. | ||
The green line represents the mass of hydrogen stored in a 1.4 l tank using compression at 77 K. The red line shows the mass of hydrogen stored by adsorption on 1.4 l of the PIM-1 MSC30 monolith at 77 K. The black line shows the mass of hydrogen stored by adsorption on 1.4 l of the PIM-1 water monolith and the blue line shows the mass of hydrogen stored by adsorption on 1.4 l of the PIM-1 MSC-30SS monolith. The results show that adsorption is favourable over compression up to approximately 0.2 MPa for PIM-1 MSC-30 monolith, up to approximately 0.3 MPa for the PIM-1 water monolith and 0.4 MPa for PIM-1 MSC-30SS monolith. This shows that adsorption on these monoliths is favourable over compression at low pressures (<0.4 MPa), which makes storing hydrogen using these monoliths in a high pressure compression tank (∼70 MPa) unlikely. However, hydrogen stored in liquid form is required to have an ullage region within the tank with a pressure requirement of 0.145 MPa.25 At this pressure, the PIM-1 MSC-30SS monolith can store 1.89 times as much hydrogen as could be stored by compression at 77 K. Therefore, these monoliths show potential for inclusion in the ullage region of a liquid hydrogen tank to allow more hydrogen to be stored in gaseous form, reducing boil-off, thereby resulting in increased efficiency and safety for use of liquid hydrogen tanks.
Conclusions
This research demonstrates successful formation of monolithic composite adsorbents consisting of a polymer matrix that is filled with activated carbons by a freeze casting method. The mass of hydrogen stored in composite monoliths follows the rule of mixtures, providing a route for the design of these materials. The composite monoliths comprise of a polymer of intrinsic microporosity (PIM-1) and activated carbons (MSC-30 and MSC-30SS) as fillers to improve the storage. Freeze casting of these high surface area activated carbon materials has not been published before, nor has the addition of water into the mixture. The addition of water increased the surface area of the monoliths and the mass of hydrogen stored was above that of the raw PIM-1 powder. Fitting of the experimental data to the Toth isotherm predicted a maximum storage capacity of more than 12 wt% at pressures of 5 MPa for MSC-30SS. We have demonstrated that at low pressures, adsorption can store a greater mass of hydrogen than using compression alone at the same pressure and temperature. It has also been observed that the forming method can potentially increase the amount of hydrogen stored compared to the initial powdered material. This is the first data presented for hydrogen storage capability of adsorptive materials which have the potential for incorporation as three-dimensional inserts into liquid storage tanks to provide reduced boil-off and increased safety and efficiency of tanks. The hydrogen storage capacities have also been compared to other porous materials such as zeolites and carbon nanotubes. The materials exhibit comparable enthalpies of adsorption, and carbon nanotubes show comparable hydrogen storage capacities to the activated carbons; however the zeolites are more comparable to the PIM-1 powder. The freeze casting method has been developed such that other fillers can be added to the monoliths, should higher surface area materials be available. The next stage of development would be to assess the viability of scale up and integration of the monolithic inserts. Freezing is a well-established industrial method, for products such as food processing, however, reproducibility is one of the most important factors to enable successful scale-up of this process. More in depth knowledge of the parameters defining the process and how they affect the structure and properties of the products is required. Once scalability is established, a life-cycle and cost analysis assessment can be performed to assess the viability of this process for industrial scale.Author contributions
Catherine Butler: methodology, software, validation, writing – original draft. Timothy J. Mays: conceptualisation, supervision, writing – review and editing. Vijay Sahadevan: review and editing. Rachel O’Malley: review and editing. Dan Graham: supervision, writing – review and editing, funding acquisition. Christopher R. Bowen: conceptualisation, supervision, writing – review and editing.Data availability
All data created during this research is openly available from the University of Bath Research Data Archive at https://doi.org/10.15125/BATH-01419.Conflicts of interest
There are no conflicts to declare.Acknowledgements
This work was supported financially by GKN Aerospace (Global Technology Centre, Bristol) and the University of Bath. Support for the work was also provided via Engineering and Physical Sciences Research Council grants EP/X025403/1 and EP/X038963/1. The authors would like to thank University of Bath colleagues Hugh Davies, Dr George Neville, Dr Rajan Jagpal, Dr Joe Paul-Taylor, and Dr Lawrence Shere for their generous support in the experiments that are included in this paper. We would also like to thank Dr John Noble for his help and support in the modelling work.Notes and references
- A. Zuttel, et al., Hydrogen: The future energy carrier, Philos. Trans. R. Soc., A, 2010, 3329–3342 CrossRef CAS PubMed.
- A. M. Abdalla, et al., Hydrogen production, storage, transportation and key challenges with applications: A review, Energy Convers. Manage., 2018, 165, 602–627 CrossRef CAS.
- M. Tian, et al., Nanoporous polymer-based composites for enhanced hydrogen storage, Adsorption, 2019, 25(4), 889–901 CrossRef CAS.
- S. Rochat, et al., Hydrogen storage in polymer-based processable microporous composites, J. Mater. Chem. A, 2017, 5(35), 18752–18761 RSC.
- J. Alcaniz-Monge and M. C. Roman-Martinez, Upper limit of hydrogen adsorption on activated carbons at room temperature: A thermodynamic approach to understand the hydrogen adsorption on microporous carbons, Microporous Mesoporous Mater., 2008, 112(1–3), 510–520 CrossRef CAS.
- M. Hirscher, et al., Materials for hydrogen-based energy storage e past, recent progress and future outlook, J. Alloys Compd., 2020, 827, 153548 CrossRef CAS.
- J. Purewal, et al., Estimation of system-level hydrogen storage for metal–organic frameworks with high volumetric storage density, Int. J. Hydrogen Energy, 2019, 44(29), 15135–15145 CrossRef CAS.
- V. P. Ting, A. J. Ramirez-Cuesta, N. Bimbo, J. E. Sharpe, A. Noguera-Diaz, V. Presser, S. Rudic and T. J. Mays, Direct Evidence for Solid-like Hydrogen in a Nanoporous Carbon Hydrogen Storage Material at Supercritical Temperatures, ACS Nano, 2015, 9(8), 8249–8254 CrossRef CAS PubMed.
- Target Explanation Document: Onboard Hydrogen Storage forLight-Duty Fuel Cell Vehicles https://www.energy.gov/sites/default/files/2017/05/f34/fcto_targets_onboard_hydro_storage_explanation.pdf accessed March 2023.
- P. M. Budd, B. S. Ghanem, S. Makhseed, N. B. McKeown, K. J. Msayib and C. E. Tattershall, Polymers of intrinsic microporosity (PIMs): robust, solution-processable, organic nanoporous materials, Chem. Commun., 2004, 230–231 RSC.
- M. Jorda-Beneyto, F. Surez-Garca and C. Lozano, Hydrogen storage on chemically activated carbons and carbon nanomaterials at high pressures, Carbon, 2007, 45(2), 293–303 CrossRef CAS.
- J. R. Neville G, J. Paul-Taylor, M. Tian, A. D. Burrows, C. R. Bowen and T. J. Mays, Freeze casting of porous monolithic composites for hydrogen storage, Mater. Adv., 2022, 8934–8946 RSC.
- D. Sylvain, Freezing Colloids: Observations, Principles, Control, and Use Applications in Materials Science, Life Science, Earth Science, Food Science, and Engineering, 2017 Search PubMed.
- K. Vasanth Kumar, M. Monteiro de Castro, M. Martinez-Escandell, M. Molina-Sabio and F. Rodriguez-Reinoso, A site energy distribution function from Toth isotherm for adsorption of gases on heterogeneous surfaces, Phys. Chem. Chem. Phys., 2011, 5753–5759 RSC.
- J. Rouquerol, P. Llewellyn and F. Rouquerol, Is the bet equation applicable to microporous adsorbents, Stud. Surf. Sci. Catal., 2007, 160, 49–56 CrossRef CAS.
- H. P. Gavin, The Levenberg–Marquardt algorithm for nonlinear least squares curve-fitting problems, 2020 Search PubMed.
- H.-S. Hu, Determination of vapour–liquid and vapour–liquid–liquid equilibrium of the chloroform–water and trichloroethylene–water binary mixtures, Fluid Phase Equilib., 2010, 80–89 CrossRef.
- S. Mishra, et al., Atomistic insights into the H2 adsorption and desorption behaviour of noel Li-functionalised polycrystalline CNTs, Carbon, 2023, 207, 23–35 CrossRef CAS.
- H. W. Langmi, et al., Hydrogen storage in ion-exchanged zeolites, J. Alloys Compd., 2005, 404–406, 637–642 CrossRef CAS.
- S. Rochat, et al., Enhancement of gas storage and separation properties of microporous polymers by simple chemical modifications, Multifunct. Mater., 2021, 4, 025002 CrossRef CAS.
- S. P. Tedds, Microporous Materials for Hydrogen Storage, 2010 Search PubMed.
- G. Turnes Palomino, et al., Thermodynamics of hydrogen adsorption on the zeolite Ca–Y, Catal. Today, 2008, 138, 249–252 CrossRef CAS.
- S. Karki, et al., Hydrogen adsorption in Si-LTA and LTA-4A zeolites: A Gibbs Ensemble Monte Carlo simulation study, Mater. Chem. Phys., 2024, 313, 128722 CrossRef CAS.
- A. Anson, et al., Hydrogen adsorption studies on single wall carbon nanotubes, Carbon, 2004, 42, 1237–1241 CrossRef.
- A. J. Colozza, Hydrogen Storage for Aircraft Applications Overview, B.P. Analex Corporation, Ohio, 2002, NASA Search PubMed.
| This journal is © The Royal Society of Chemistry 2024 |

