DOI:
10.1039/D4MA00357H
(Paper)
Mater. Adv., 2024,
5, 8017-8033
A poly-vinyl alcohol aided multiphase Z-scheme ZnO–AgI–CuO nanocomposite as an efficient photocatalyst for dye photodegradation†
Received
4th April 2024
, Accepted 28th July 2024
First published on 14th August 2024
Abstract
Single-phase ZnO and CuO photocatalysts as well as a multiphase PVA-assisted ZnO–AgI–CuO nanocomposite were synthesized by sol–gel method. In contrast, a AgI photocatalyst was synthesized by precipitation. The calcination temperature (500 °C) was determined using the TGA-DTA technique. FTIR, XRD, DLS, DRS, BET, and SEM techniques were used to characterized the synthesized nanomaterials. The ZnO–AgI–CuO nanocomposite was also characterized using SEM-EDS, TEM, HRTEM, and SAED. The HRTEM and SAED findings reveal the intimate contact of the AgI and CuO photocatalysts on the surfaces of ZnO. The photocatalytic efficiency of CuO is higher than that of the two pristine AgI and ZnO. This is probably due to the lower band gap energy of CuO photocatalyst. Furthermore, the ZnO–AgI–CuO nanocomposite shows outstanding catalytic performance, and its activity is 2.1, 1.64, and 1.46 times higher than those of ZnO, CuO, and AgI, respectively. This catalytic enhancement could be attributed to the synergistic effect of its components. The photocatalytic performance of the ZnO–AgI–CuO nanocomposite was also explored in industrial wastewater collected from KK textile factory, Addis Ababa, Ethiopia. The findings obtained for ZnO–AgI–CuO were 95% and 82% for MB and industrial wastewater, respectively. The higher efficiency of ZnO–AgI–CuO for the MB dye than the industrial wastewater may be due to the presence of many pollutants in industrial wastewater. Reuse experiments for five cycles were examined using the ZnO–AgI–CuO nanocomposite, and nearly the same efficiency was observed. The ZnO–AgI–CuO nanocomposite was analyzed using FTIR, XRD, and DRS techniques before and after the photocatalytic experiments. The results demonstrate that the phases and structural characteristics of the ZnO–AgI–CuO nanocomposite remain largely unchanged before and after reuse. Besides, a conceivable photocatalytic Z-scheme mechanism was proposed. This could offer novel findings in the design of stable Z-scheme heterojunctions using ZnO, CuO, and AgI photocatalysts.
1. Introduction
Water is essential for life and plays a crucial role in maintaining the structure and function of biological systems.1 However, it can be contaminated by numerous hazardous pollutants, including organic and inorganic contaminants.2,3 These contaminants have the potential to significantly impact the quality and availability of water for living organisms.4 This contamination can lead to health issues and environmental problems. Organic dyes, among these pollutants, have received particular attention and can originate from various industrial sources, such as the textile, paper, food, and leather industries.5 Textile factories significantly contribute to water pollution due to the discharge of organic dyes,5 toxic chemicals,2–7 and heavy metals,6 posing risks to both aquatic life and human health.7 Among these dyes, methyl blue (MB) is an important dye commonly used in textile industries to color textiles. However, MB is a hazardous compound that can harm human health and the environment.1 To overcome this concern, creating sustainable approaches for treating wastewater is essential.2,6 Among these methods, photocatalytic degradation is an up-and-coming technique to break organic pollutants into harmless substances8,9 due to its ease of operation, cost-effectiveness, and environmentally friendly nature.
Single-phase semiconductor-based materials have attracted attention for degrading organic pollutants into harmless products.7,10 Nevertheless, the low light absorption,11 high electron–hole recombination,12 and poor stability of the single-phase photocatalysts are significant challenges.13,14 To conquer these problems, different techniques such as single metal15,16 and non-metal-doping,16 metal–metal,17 metal–nonmetal,18 or nonmetal–nonmetal co-doping,19 coupling or combining single-phase photocatalysts with other various single-phase photocatalysts20,21 have been proposed. Techniques like the formation of heterojunctions using various semiconductor materials with narrow band gap energies are under investigation.22 Among the various single-phase semiconductor materials, zinc oxide (ZnO), copper oxide (CuO),23 and silver iodide (AgI) have attracted much attention due to their non-toxicity, high stability, and relatively good photocatalytic performance.24 However, the ZnO material has some drawbacks, such as low utilization of visible light, poor dispersion, wide band gap energy, swift recombination of electron–hole pairs, and low surface area.25,26 Consequently, it is paramount to synthesize composite nanomaterials that can combine the benefits of these materials to overcome limitations. Recently, ZnO-based nanocomposites of type-I, ZnO–MoS2 and 27 ZnO–Co3O4 (ref. 28), and type-II such as ZnO–In2O3,29 ZnO–ZnS,30 and ZnO–CuO (ref. 31) heterojunctions have been reported for the degradation of toxic dyes. However, the oxidation and reduction potential of the charge carriers are weakened in these types of heterojunctions.32,33 To conquer the aforementioned problems, the notion of direct contact Z-scheme photocatalysis was introduced.34,35 Hence, Z-scheme ZnO-based binary composites with CdS,36 CuO,37 Ag2O,38 AgI,25 CuS,39 and other materials were reported to remove organic pollutants from wastewater. In all cases, the authors have observed higher photocatalytic efficiency for composites compared to single ZnO. Dual Z-scheme ZnO-based ternary nanocomposites such as ZnO–AgI–WO3,35 Cs2O–Bi2O3–ZnO,40 and ZnO–CuO-g-C3N4 (ref. 33) were also reported for more enhanced photodegradation of organic pollutants than single ZnO and its derived binary systems. Nevertheless, nanocomposite materials have a high surface area and surface energy.41 This can challenge achieving uniform dispersion and good interfacial linking between components.42,43 High surface area particles may also agglomerate or cluster together.42 To intercept this problem, various methods have been proposed, such as surface modification, functionalization, or capping of the particles or using suitable supporting agents like polymers.44 Among these polymers, polyvinyl alcohol (PVA) has attracted attention due to its environmentally safety, green nature, low thermal stability, and cost-effectiveness.41 These methods aim to improve the compatibility, adhesion, and stability of the components and enhance the performance of the composite materials.
One possible way to achieve this is to use PVA as a capping agent and a stabilizer, which can improve the composite material's dispersion, stability, and photocatalytic activity.45,46 In this study, the synthesis of a PVA-assisted Z-scheme ZnO–AgI–CuO nanocomposite, un-assisted pristine ZnO, AgI, and CuO photocatalysts, and the optimized calcination temperature (500 °C) were reported. The photocatalytic performance of the photocatalysts was investigated in synthetic water using MB dye. A PVA-assisted ternary ZnO–AgI–CuO nanocomposite was used to test its efficiency in textile wastewater treatment. The effect of different parameters, such as PVA-assisted Z-scheme ZnO–AgI–CuO nanocomposite dosage, initial MB dye concentration, and pH, on the photodegradation efficiency of the composite material was investigated. The photocatalytic efficiency of pristine ZnO, AgI, and CuO photocatalysts and the ZnO–AgI–CuO nanocomposite were explored. The efficiency of ZnO was lower than that of AgI and CuO photocatalysts. The superior efficiency for the PVA-assisted ZnO–AgI–CuO nanocomposite was obtained due to the cumulative effect of its components. The PVA-assisted Z-scheme ZnO–AgI–CuO nanocomposite exhibits enhanced photocatalytic activity and stability for the degradation of methylene blue dye in industrial wastewater collected from Addis Ababa (KK) textile industry under visible light irradiation. The synthesized nanocomposite degraded a higher % of MB than industrial wastewater due to the mixed pollutants in the real sample. The outcomes display the potential application of the Z-scheme ZnO–AgI–CuO composite for effective textile dye photodegradation.
2. Methodology
2.1. Chemicals
Chemicals and reagents like polyvinyl alcohol ((C4H6O2)n = 99.9%) and sodium hydroxide (NaOH = 97%) were purchased from Merck, India. Zinc nitrate hexahydrate (Zn(NO3)2·6H2O = 99.9%), silver nitrate (AgNO3 = 99%), potassium iodide (KI = 99.5%), and copper nitrate trihydrate [Cu(NO3)2·3H2O ≥ 99%] were obtained from Merck, Sigma Aldrich. The used chemicals are research-grade and utilized in the absence of additional purification. Distilled water (DW) and ethanol were used in this research work for dissolving and washing purposes.
2.2. Synthesis of nanocomposites
2.2.1. Synthesis of single-phase nanoparticles.
ZnO nanoparticles were synthesized by the sol–gel method.26 First, 2 mg of zinc nitrate was dissolved in a ratio of 1![[thin space (1/6-em)]](https://www.rsc.org/images/entities/char_2009.gif) :
:![[thin space (1/6-em)]](https://www.rsc.org/images/entities/char_2009.gif) 1 (20
1 (20![[thin space (1/6-em)]](https://www.rsc.org/images/entities/char_2009.gif) :
:![[thin space (1/6-em)]](https://www.rsc.org/images/entities/char_2009.gif) 20) L of distilled water and ethanol. A 0.5 mol L−1 sodium hydroxide solution was prepared and dropwise added to the zinc nitrate solution until pH 12. The resulting white suspension was settled down after 12 h, washed with ethanol and distilled water, dried, and oven-dried at 100 °C and calcined at 500 °C, respectively, to obtain the desired ZnO nanoparticles. Similarly, copper acetate was used to synthesize CuO photocatalysts using the same procedure. Moreover, for synthesizing AgI (by precipitation method), 0.02 mol L−1 of silver nitrate was dissolved in 0.05 L of distilled water. An equal amount of KI solution was added to the silver nitrate solution. The resulting yellow precipitate was filtrated, washed with distilled water, and dried in a closed oven at 100 °C.
20) L of distilled water and ethanol. A 0.5 mol L−1 sodium hydroxide solution was prepared and dropwise added to the zinc nitrate solution until pH 12. The resulting white suspension was settled down after 12 h, washed with ethanol and distilled water, dried, and oven-dried at 100 °C and calcined at 500 °C, respectively, to obtain the desired ZnO nanoparticles. Similarly, copper acetate was used to synthesize CuO photocatalysts using the same procedure. Moreover, for synthesizing AgI (by precipitation method), 0.02 mol L−1 of silver nitrate was dissolved in 0.05 L of distilled water. An equal amount of KI solution was added to the silver nitrate solution. The resulting yellow precipitate was filtrated, washed with distilled water, and dried in a closed oven at 100 °C.
2.2.2. Synthesis of the PVA-assisted ZnO–AgI–CuO nanocomposite.
The PVA-assisted ZnO–AgI–CuO ternary nanocomposite was synthesized using a method developed by B. Abebe et al.42 (see Scheme 1). Three solutions, Cu(NO3)2·3H2O, Zn(NO3)2·6H2O, and AgNO3, were typically prepared and mixed in different beakers. In the mixed solution, 0.5 mol L−1 NaOH solution was added by stirring until there was a pH of 12. And then, potassium iodide solution was added. Moreover, the solution was added to a solution containing dissolved PVA in hot distilled water. The resulting solution was stirred for 1 h and settled down after 48 h and filtered, washed three times with distilled water and ethanol, and dried in an oven for about 12 h at 100 °C, and then calcined at 500 °C to produce a ZnO–AgI–CuO ternary nanocomposite.
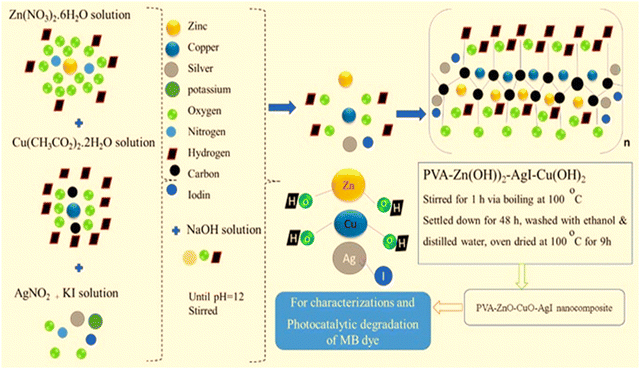 |
| | Scheme 1 Scheme for the synthesis of the PVA-supported ZnO–AgI–CuO nanocomposite. | |
2.3. Characterization of the nanocomposites
We used various characterization techniques to study the nanocomposites’ surface chemistry, structure, properties, and performance. One of these techniques was thermal gravimetric analysis–differential thermal analysis, TGA–DTA (DTG, 60 H, Shimadzu, Japan), to measure the weight change of the nanocomposites as a function of temperature or time and to study their thermal stability, decomposition, and mass loss. The functional groups within the composites were identified by Fourier transform infrared (FTIR) spectroscopy (FT-IR, IS50, ABX, Perkin Elmer, USA) within the range of 400 to 4000 cm−1 wave number. We also performed diffuse reflectance spectroscopy, DRS (JASCO.V-770, Shimadzu, Japan), to measure the optical band for the synthesized samples. Photoluminescence (PL) spectroscopy (FL 6500 Fluorescence Spectrophotometer, PerkinElmer, USA) was also used to study the lifetime of the photogenerated electrons and the effective interfacial charge transfer among the prepared samples. The synthesized nanomaterials’ particle size distribution and surface area with pore volume were explored by dynamic light scattering (DLS) and Brunauer–Emmett–Teller (BET) analysis, respectively. The internal structure of the nanocomposites was determined by transmission electron microscopy, HR-TEM, and SAED (JEOL JEM-F200, Japan). Additionally, we employed scanning electron microscopy, or SEM (ZEISS Gemini SEM 300, Germany). Finally, energy-dispersive X-ray spectroscopy and EDS were used to produce a magnified image and determine the nanocomposites’ elemental composition.
2.4. Photocatalytic activity test
The photodegradation efficiency of the as-synthesized nanomaterials was studied under visible light irradiation. 400–700 nm was the output visible light irradiation source. Typically, 100 mL of aqueous solutions of MB dye (10 mg) and 50 mg of catalyst load were placed in the dark through stirring and kept for 30 minutes to achieve equilibrium between adsorption and desorption. The solution was irradiated by visible light, and the sample was collected at 30 min intervals to estimate the MB dye concentration. The suspension was separated by centrifuge to collect the nanomaterial sample. At various reaction time intervals, samples were obtained by repeating this process. The degradation efficiency was evaluated using a UV-vis spectrophotometer (JASCO.V-770) to analyze the absorbance of MB dye. The following method was used for obtaining the dye's percent degradation (%) and rate constant:| |  | (1) |
where C0 is the initial dye concentration, C is the concentration of dye at the irradiation time, Ao is the dye's initial absorbance before irradiation, A is the absorbance of dye at the irradiation time, and kapt is the rate constant.
2.5. Textile wastewater analysis
The chemical oxygen demand (COD) concentration of industrial waste collected from the Addis Ababa (KK) textile industry was evaluated. Experimentally, 0.25 mol L−1 of potassium dichromate and 0.5 mol L−1 of sulfuric acid were prepared separately. A sample of wastewater was taken and filtered to remove any suspended solids. Then, 20 mL of the filtered sample was taken and digested in a COD digestion vial. To enhance the oxidation process, 1 mL of silver sulfate was added as a catalyst. A measured amount of the prepared potassium dichromate solution was added to the sample. The prepared sulfuric acid solution was carefully added to the vial while swirling to ensure complete digestion. The vial was sealed and placed in a CR 4200 COD reactor for 2 h at 155 °C to promote the oxidation of organic compounds. After digestion, the bottle was allowed to cool down to room temperature. Subsequently, the sample was cooled to ambient temperature and mixed by inverting to measure the COD concentration in mg. The COD concentration in the wastewater was estimated using the HI 83099 COD detector. A series of standard solutions with known concentrations of a COD standard were prepared to plot the calibration curve for determining the COD value of MB in industrial waste. Then afterwards, degradation of MB is presented in textile wastewater.
3. Results and discussion
3.1. Thermal analysis
TGA/DTA was utilized to evaluate the weight variation as a function of temperature and thermal properties of the nanomaterials. Fig. 1 reveals the TGA/DTA results for the PVA-assisted nanocomposites. As can be seen, the as-synthesized composite loses its mass in two steps. The weight losses of the composite are 0.048 and 0.509 mg, respectively, with a mass loss of 0.688% and 7.292%. This mass loss is possibly due to the removal of adsorbed water, which begins at room temperature as water dehydrated.41 The highest corresponding decomposition temperatures are 75, 230, 380, and 475 °C. There are double exothermic reactions for PVA-assisted materials in the DTA results (Fig. 1). Also, the endothermic reaction was confirmed with the decomposition of zinc and copper precursors.26 A broad, sharp downward peak indicates the materials’ dehydration reaction and crystallinity change. Beyond the endothermic reaction, the temperature becomes minimal and thermodynamically stable due to the almost complete decomposition that occurred, and the material is stable after 480 °C. TGA analysis is paramount for obtaining the temperature stability of the as-prepared materials. Accordingly, the temperature needed for calcination of the PVA-assisted ZnO–AgI–CuO nanocomposites is around 500 °C.
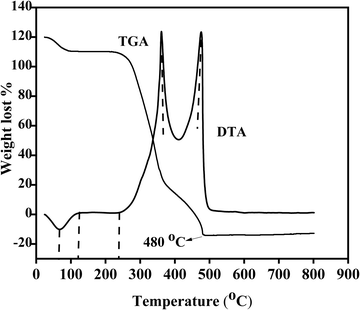 |
| | Fig. 1 Thermal gravimetric analysis-differential thermal analysis of PVA-supported ZnO–AgI–CuO nanocomposites. | |
3.2. FTIR analysis of the nanocomposites
As shown in Fig. 2, the functional groups and stretching bands in the pristine ZnO, AgI, CuO, and ZnO–AgI–CuO samples were explored by FTIR spectroscopy within the range of 400 to 4000 cm−1 wave number. The O–H bond stretching resulted in the absorption bands around 3406 and 3390 cm−1. Almost the same absorption bands were observed for pristine phases ZnO, AgI, CuO, and ZnO–AgI–CuO (2390.42 cm−1). This shows the presence of OH stretching bands in the prepared samples. The weak peak observed at 2885.48 cm−1 is for AgI and mixed-phase ZnO–AgI–CuO nanomaterials. This is ascribed to the confirmation of the occurrence of C–H stretching vibration.47 2390.42 cm−1 is the absorption peak in the ZnO, AgI, CuO, and ZnO–AgI–CuO samples. The wave numbers of 1643 cm−1 appeared in ZnO and ZnO–AgI–CuO and 1632.62 cm−1 appeared in AgI and CuO samples related to the C–O bond stretching. This may correspond to the absorption band of the C–O bond found between 1670 and 1632 cm−1. In this study, the prepared nanomaterials exhibited a broad peak at 1117.11 cm−1, which indicates the absence of carbon-based compounds. The absorption band of 614.15 cm−1 corresponds to the stretching vibration of the ZnO, AgI, and CuO bond. The absorption peaks in the region 429–445 cm−1 possibly suggested Zn–O and Cu–O bond stretching, confirming the metal oxide's presence.48,49
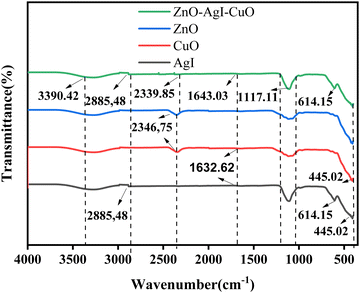 |
| | Fig. 2 FT-IR analysis for ZnO, AgI, CuO, and the ZnO–AgI–CuO nanocomposites. | |
3.3. XRD and DLS analysis
The crystal structure of the synthesized nanomaterials was analyzed using X-ray diffraction. The XRD patterns of ZnO, CuO, AgI, and the ZnO–AgI–CuO nanomaterials are shown in Fig. 3a. The diffraction peak patterns for ZnO at 2θ are 31.91, 34.56, 36.39, 47.68, 56.68, 62. 99, 66.51, 68.08, 69.21, 72, and 77.08° corresponding to the (100), (002), (101),(103), (102), (110), (200), (112), (201), (004), and (105) planes, respectively, of the hexagonal wurtzite structure of ZnO (JCPDS No. 00-036-1451)50 with a space group of P63mc. The corresponding planes for the peaks such as 32.61, 35.61, 38.18, 48.87, 53.55, 58.39, 61.63, 65.88, 66.32, 68.10, 72.49, and 75.40 (JCPDS No. 00.048-1548)51 that represent the monoclinic structure of CuO (space group C2/C) are from the diffraction planes (002), (111), (020), (200), (022), (113), (311), (222), (202), (220), (004), and (331), respectively. 2θ values of 22.45, 23.8, 25.43, 32.88, 39.32, 42.74, and 46.4° (JCPDS No. 00 009-0399)52 with corresponding planes of (040), (111), (101), (102), (110), (103), and (201) are obtained and represent the cubic structure of AgI (F![[4 with combining macron]](https://www.rsc.org/images/entities/char_0034_0304.gif) 3m space group). Furthermore, broad diffraction peaks of the ZnO–AgI–CuO nanocomposites that appeared at 22.44, 23.79, 31.84, 34.51,35.54, 36.33, 38.16, 39.71, 46.40, 47.62, 56. 68. 62.93 and 68.32° are respectively indexed to (100), (111), (100), (002), (
3m space group). Furthermore, broad diffraction peaks of the ZnO–AgI–CuO nanocomposites that appeared at 22.44, 23.79, 31.84, 34.51,35.54, 36.33, 38.16, 39.71, 46.40, 47.62, 56. 68. 62.93 and 68.32° are respectively indexed to (100), (111), (100), (002), (![[1 with combining macron]](https://www.rsc.org/images/entities/char_0031_0304.gif) 11), (101), (111), (102), (321), (102), (110), (102), and (200). The major peaks observed in ZnO also appeared in the ZnO–AgI–CuO composite material with slight shifts in their positions that might be due to the experimental setup. After loading the pristine samples, the broadening of the ZnO diffraction peaks was also observed to some extent. As the broadness of the diffraction peaks increases, it typically indicates that the crystallite size is decreasing. This leads to high structural imperfections, such as dislocations and grain boundaries (Fig. S1, ESI†). In the prepared nanocomposite, the diffraction peaks at 2θ values of 22.44, 23.79, 39.71, and 46.40° indicate the hexagonal structure of β-AgI.53 2θ values appeared at 35.54, 38.16, 62.93, and 68.10° revealing the presence of CuO. The other diffraction peaks are 31.84, 34.51, 36.33, 46.40, 47.62, and 56. 68, 62.93, and 68.32°, and confirm the hexagonal wurtzite structure of ZnO. The results show that the prevailing diffraction peaks of ZnO are apparent. On the other hand, the majority of ZnO diffraction peaks have appeared in the composite, compared to AgI and CuO. This is possibly due to a high zinc salt content during synthesizing the composite. All diffraction peaks located in ZnO–AgI–CuO are documented to be cubic, monoclinic, and hexagonal wurtzite structures for AgI, CuO, and ZnO, respectively. The obtained data reveals that AgI and CuO were dispersed well in forming a heterojunction (co-occurrence of ZnO, CuO, and AgI in the nanocomposite).
11), (101), (111), (102), (321), (102), (110), (102), and (200). The major peaks observed in ZnO also appeared in the ZnO–AgI–CuO composite material with slight shifts in their positions that might be due to the experimental setup. After loading the pristine samples, the broadening of the ZnO diffraction peaks was also observed to some extent. As the broadness of the diffraction peaks increases, it typically indicates that the crystallite size is decreasing. This leads to high structural imperfections, such as dislocations and grain boundaries (Fig. S1, ESI†). In the prepared nanocomposite, the diffraction peaks at 2θ values of 22.44, 23.79, 39.71, and 46.40° indicate the hexagonal structure of β-AgI.53 2θ values appeared at 35.54, 38.16, 62.93, and 68.10° revealing the presence of CuO. The other diffraction peaks are 31.84, 34.51, 36.33, 46.40, 47.62, and 56. 68, 62.93, and 68.32°, and confirm the hexagonal wurtzite structure of ZnO. The results show that the prevailing diffraction peaks of ZnO are apparent. On the other hand, the majority of ZnO diffraction peaks have appeared in the composite, compared to AgI and CuO. This is possibly due to a high zinc salt content during synthesizing the composite. All diffraction peaks located in ZnO–AgI–CuO are documented to be cubic, monoclinic, and hexagonal wurtzite structures for AgI, CuO, and ZnO, respectively. The obtained data reveals that AgI and CuO were dispersed well in forming a heterojunction (co-occurrence of ZnO, CuO, and AgI in the nanocomposite).
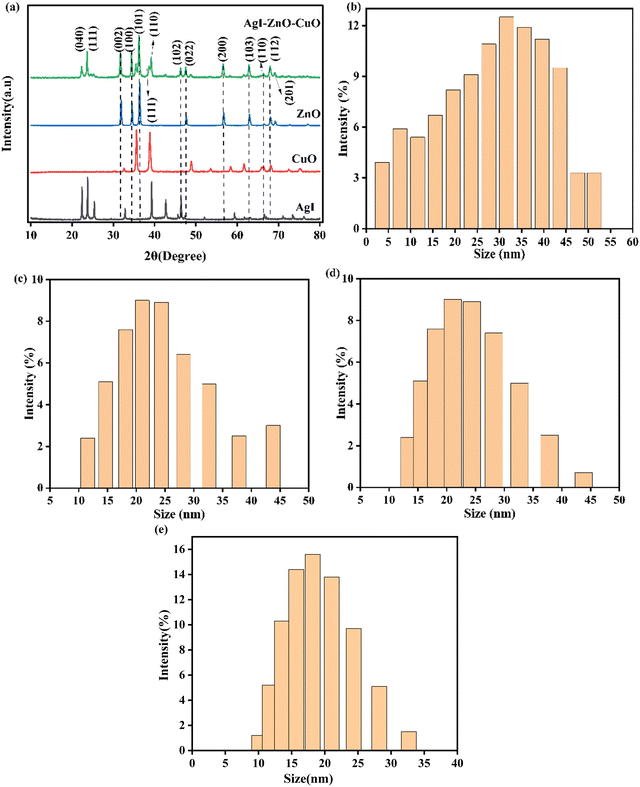 |
| | Fig. 3 (a) XRD diffraction patterns of ZnO, CuO, AgI, and the ZnO–AgI–CuO nanocomposite, and DLS analysis of (b) ZnO, (c) CuO, (d) AgI, and (e) the ZnO–AgI–CuO nanocomposites. | |
The average crystallite sizes of all as-synthesized nanocomposites were calculated from the Scherer equation. Accordingly, the estimated average crystalline sizes of the as-synthesized ZnO, CuO, AgI, and ZnO–AgI–CuO nanocomposites are 44, 29, 66, and 24 nm (details are presented in a ESI† file (Tables S1 and S2). The results indicate that assisting and combining ZnO with other suitable semiconductors improved the average particle size and enhanced the composite surface area. DLS analysis in a liquid suspension also examined the particle size distribution of the synthesized samples. The sizes of single ZnO, CuO, and AgI nanoparticles and the mixed-phase ZnO–AgI–CuO nanocomposite were found to be in the range of 2–60, 10–45, 12–45 and 5–35 nm, respectively (Fig. 3b–e). The intensity fluctuations were observed in all cases due to the Brownian motion of the particles. From these fluctuations, the hydrodynamic size of the particles can be inferred, representing the effective size of the particles in solution. 19, 25, 25.6, and 27 nm are estimated particle sizes of ZnO, AgI, CuO and ZnO–CuO–AgI, respectively. The average particle size of the ternary nanocomposite of ZnO–CuO–AgI is relatively higher than that of the ZnO, AgI, and CuO photocatalysts. This may be because multiple components in the composite material can lead to interactions between the particles. These interactions may include chemical bonding, electrostatic forces, or physical adsorption, which can form larger particles.
3.4. BET analysis
The textural properties of the synthesized materials play a substantial role in determining their photocatalytic performance. The nitrogen adsorption–desorption data of the ZnO, AgI, CuO, and ZnO–AgI–CuO nanomaterials were analyzed (Fig. 4 and Table S3, ESI†) using Brunauer–Emmett–Teller, which provided insights into the specific surface area, pore size distribution, and pore volume of the nanomaterials. This is vital for evaluating their potential as photocatalysts and predicting their performance in dye degradation. All the synthesized samples displayed Type IV isotherms with an H3 hysteresis loop that assures the presence of mesopores. This is characterized by an adsorption step that occurs at relatively low relative pressures (P/P0), indicating the filling of the mesopores. The availability of the mesoporous enhances the accessibility of the active sites and facilitates the diffusion of reactants, allowing for improved dye degradation performance. The mesoporous structures also contribute to the overall stability and reusability of the photocatalysts. The BET surface areas of the ZnO, AgI, CuO, and ZnO–AgI–CuO nanomaterials were estimated to be 5.21, 12.31, 15.01, and 46.11 m2 g−1, respectively. The ZnO–AgI–CuO nanocomposite has an enhanced surface area relative to the single photocatalysts, making it an efficient material in photodegradation. This is in good agreement with the findings obtained by XRD.
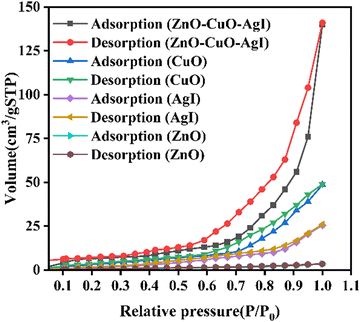 |
| | Fig. 4 Nitrogen adsorption–desorption plots of ZnO, CuO, AgI, and the ZnO–AgI–CuO nanocomposite. | |
3.5. SEM and TEM analysis
SEM, TEM, and HRTEM were used to investigate the surface morphology of the prepared photocatalyst nanomaterials. Fig. 5a–d depicts SEM images of individual ZnO, AgI, CuO, and ZnO–AgI–CuO nanomaterials. The SEM findings reveal that the pristine ZnO and CuO photocatalysts exhibit a spherical shape with agglomerated particles, as shown in Fig. 5a and b. At the same time, Fig. 5c depicts a few rod shapes and more irregular shapes of AgI with an aggregated particle micrograph. Furthermore, Fig. 5d shows the SEM image of ZnO–AgI–CuO, displaying the mixed phase of its component photocatalysts with less agglomeration. The decreased agglomeration or aggregation in the mixed phase of ZnO–AgI–CuO might be due to the usage of PVA as a capping agent for the preparation of the photocatalyst.
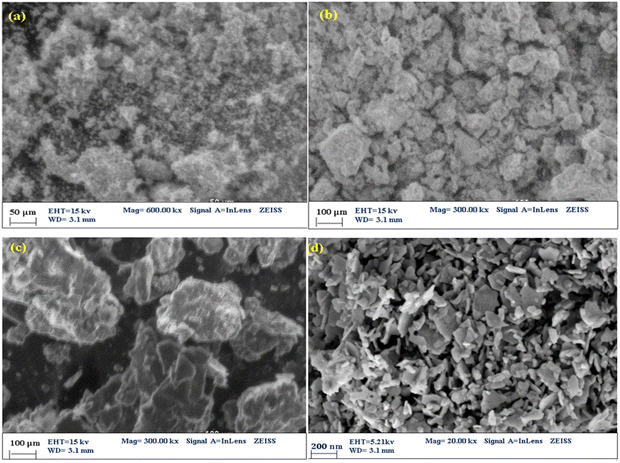 |
| | Fig. 5 SEM images of (a) ZnO, (b) CuO, (c) AgI, and (d) the ZnO–AgI–CuO nanocomposites. | |
TEM is a powerful technique that allows for direct observation and characterization of a material's microstructure at the nanoscale. By transmitting a beam of high-energy electrons through a thin specimen, TEM provided detailed information about the crystal structure, morphology, and composition of the sample. Fig. 6a depicts the TEM analysis of the mixed-phase ZnO–AgI–CuO nanocomposite. The result reveals the intimate contact of AgI and CuO nanoparticles on the surface of the ZnO photocatalyst. These particles exhibit a favorable arrangement with minimal clustering or agglomeration. For further study, the internal structure of the ZnO–AgI–CuO nanocomposite was reported using the HR-TEM image as indicated in Fig. 6c. The estimated average particle size from the histogram of the particle sizes is 54 nm (Fig. 6d). These values are higher than the value obtained from XRD. The calculated lattice fringe d-spacing from HR-TEM is 0.172, attributed to the AgI (100) plane. Also, the 0.212, 0.241, and 0.316 nm d-spacing values are attributed to ZnO (100), (002), and (101), respectively. Additionally, d-spacings of 0.251 and 0.231 nm are attributed to CuO (111) and (200), respectively, revealing the effective formation of the ZnO–AgI–CuO heterojunction nanocomposite. The stacking faults on the IFFT analysis represent the crystalline nature of the composite material. To obtain information about the crystal structure of a material, selected area electron diffraction (SAED) was utilized (Fig. 6d). The obtained result shows the different concentric rings assigned to (100), (002), and (101) planes of ZnO in addition to the (100) plane of AgI, and (111) and (200) of CuO nanoparticles.
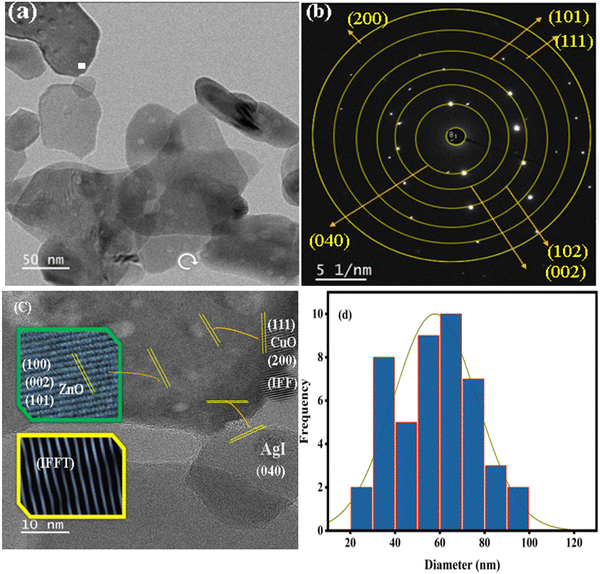 |
| | Fig. 6 (a) TEM, (b) SAED, (c) HR-TEM images with line spaces and (d) particle size distribution plot of the ZnO–AgI–CuO nanocomposite. | |
3.6. Elemental analysis
The elemental composition of the ZnO–AgI–CuO nanocomposite was studied using EDS elemental analysis. The elemental composition analysis showed that the expected elements such as Zn, O, Cu, Ag, and I were observed with percentage weights of 56.09, 11.96, 11.92, 6.88, and 6.15%, respectively, in the ZnO–AgI–CuO nanocomposite. The EDS spectrum reveals the successful synthesis of ZnO–AgI–CuO nanocomposite without impurities (Fig. 7a). Elemental mapping also confirmed the presence of all estimated elements such as Zn, Cu, Ag, O, and I in the synthesized sample, as shown in Fig. 7b–f.
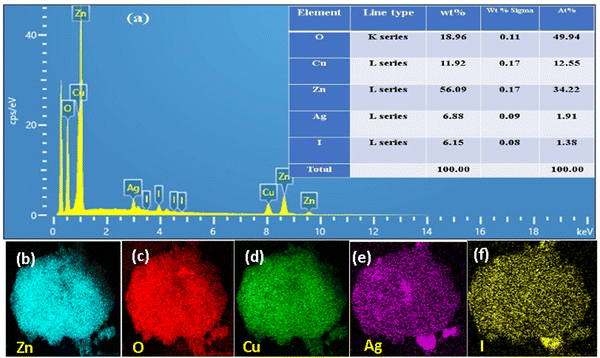 |
| | Fig. 7 (a) Elemental composition and % of each element and atom, (b–f) EDS elemental mapping of the ZnO–AgI–CuO composite: Zn (white–green), O (red), Ag (purple), Cu (green), and I (yellow). | |
3.7. DRS and photoluminescence (PL) analysis
The optical properties of the ZnO, CuO, AgI, and ZnO–AgI–CuO photocatalysts were investigated using the UV-vis diffuse reflectance spectroscopy (DRS) technique, and the results are displayed in Fig. 8a–d. Fig. 8a shows that the pristine ZnO photocatalyst was absorbed in the UV region up to 383 nm, consistent with previous studies.54 AgI and CuO nanoparticles, on the other hand, are absorbed in the visible region, with absorption peaks at 466 nm and 624 nm, respectively (see Fig. 8b and c).55Fig. 8d demonstrates that the nanocomposites of ZnO–AgI–CuO can absorb photon energy in the visible region up to 565 nm. This finding suggests that by combining ZnO with AgI and CuO photocatalysts, the light absorption performance of ZnO can be shifted from the UV region to the visible region.
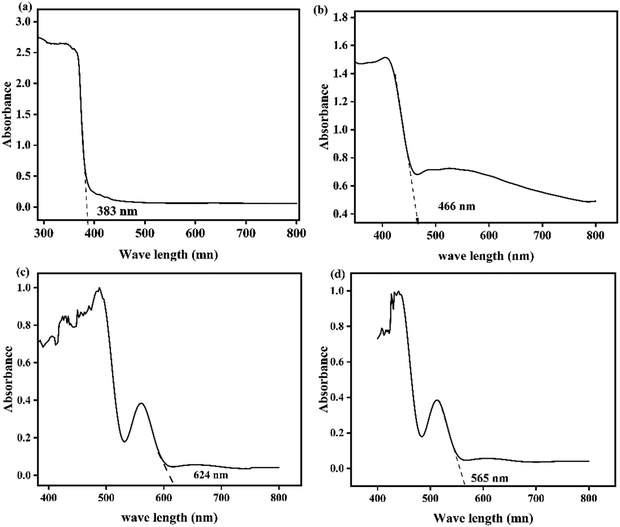 |
| | Fig. 8 UV-vis analysis of (a) ZnO, (b) AgI, (c) CuO, and (d) the ZnO–AgI–CuO nanocomposite. | |
The band gap energy of the synthesized nanomaterials was obtained from a plot of absorbance versus wavelength.56 This method will give confounding results of band gap energy due to light scattering during DRS analysis. This problem can be reduced by converting the obtained value from a plot of absorbance versus wavelength using the Kubelka–Munk equation to (αhν)2versus hν.57 The band gap of the prepared photocatalysts was determined from the plot of (αhν)1/2versus hν as indicated in Fig. 9a–d. Consequently, the calculated band gap energy for ZnO is 3.25 eV (Fig. 9a), for AgI is 2.67 eV (Fig. 9b), and for CuO is 1.98 eV as illustrated in Fig. 9c. Furthermore, the estimated band gap energy of the ZnO–AgI–CuO nanocomposite was found to be 2.13 eV (Fig. 9d). The obtained outcome exhibited that the ZnO sample is found in the UV region. In contrast, CuO and AgI were found in the visible region. In the cases of the ZnO–AgI–CuO nanocomposite, coupling ZnO with CuO and AgI nanoparticles has modified the band gap energies, consistent with the average crystallite size obtained by XRD analysis. In general, ZnO in the combined form of the nanocomposite exhibits a redshift, which enables the composite to absorb in the visible region due to their amendment of the band gaps of ZnO.54 This improvement of the ZnO photocatalyst leads to enhancing the photocatalytic degradation reactions. Fig. 10 presents a PL study of ZnO, AgI, CuO, and ZnO–AgI–CuO nanomaterials to explore their photoexcited e−/h+ pair recombination rate. 350 nm excitation wavelength was used to evaluate the PL emission peaks of the ZnO, AgI, CuO, and ZnO–AgI–CuO nanomaterials. The emission peak at 557 nm was produced for all as-prepared samples. The strongest and weakest emission peaks were observed for single-phase ZnO and mixed-phase ZnO–AgI–CuO samples. The observed outcomes indicated that rapid e−–h+ recombination produces a stronger PL peak, while lower e−–h+ recombination leads to a weaker PL peak intensity. In other words, the mixed-phase ZnO–AgI–CuO nanocomposites can ratify light absorption, delaying the fast recombination rate of charge carriers and reducing the prevention of electron transfer.
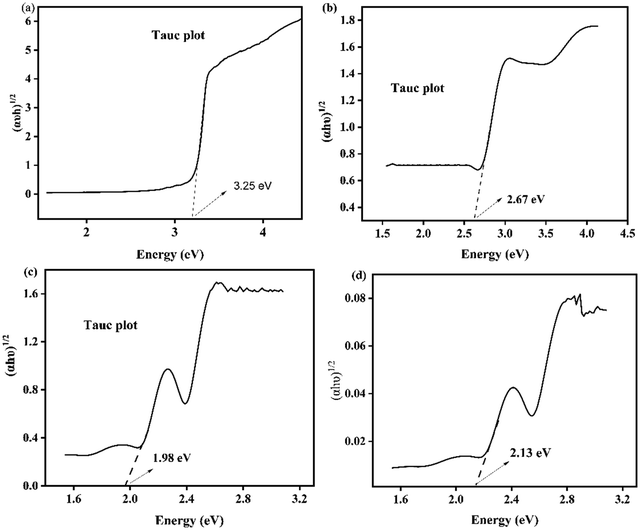 |
| | Fig. 9 Tauc plot of (a) ZnO, (b) AgI, (c) CuO, and (d) the ZnO–AgI–CuO nanocomposite. | |
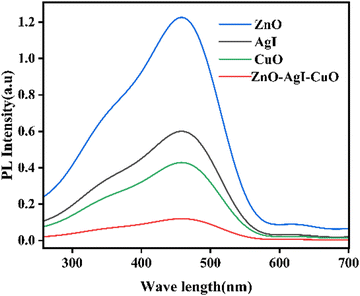 |
| | Fig. 10 PL signals of the ZnO, AgI, CuO, and ZnO–AgI–CuO photocatalysts in ethanol under 350 nm excitation. | |
3.8. Photocatalytic activities of the synthesized nanomaterials
The photocatalytic efficiency of the prepared nanomaterials such as ZnO, CuO, AgI, and ZnO–AgI–CuO was studied towards methylene blue (MB) dye degradation (Fig. 11a–d). Hence, the degradation efficiency of the synthesized materials was achieved using 100 mL aqueous solutions of initial MB dye (10 mg) and 110 mg of catalyst load within 3 h under visible light irradiation. The mixed sample solution stayed in the dark for 0.5 h with stirring before the experiment was run. No change in MB dye concentration was observed in the dark within the 0.5 h. This suggests that the dye underwent no significant degradation without light irradiation. During the light irradiation process, a change in MB dye concentration was observed within 3 h for all photocatalysts used. Fig. 11a and b illustrate that the degradation rate of MB using the ZnO–AgI–CuO nanocomposite was higher than that of the single ZnO, CuO, and AgI nanocomposites. The performance of MB using the ZnO–AgI–CuO nanocomposite was nearly 95% within 3 h, while the ZnO, CuO, and AgI photocatalysts degraded 37, 52, and 56% MB (Fig. 11c). In addition, the photocatalytic activities of ZnO, CuO, AgI, and ZnO–AgI–CuO concerning MB dye follow pseudo-first-order kinetics, as expressed by ln(Co/C) = kapt, where kapt is the rate constant and Co and C are the initial and final concentrations, respectively. The calculated kinetic rate constants for MB, ZnO, CuO, AgI, and theZnO–AgI–CuO nanocomposite were 0.00011, 0.0026, 0.0035, 0.0062, and 0.0155 per min, respectively. The rate constants of the pure ZnO, CuO, and AgI photocatalysts were lower than that of the ZnO–CuO–Ag nanocomposite, as depicted in Fig. 11b. This result is in good agreement with the result estimated by XRD and DRS. Comparatively, the ZnO–AgI–CuO nanocomposite parades the highest kinetic rate constant among all of the other nanomaterials, which was 7.5, 4.1, and 2.5 times greater than those of ZnO, AgI, and CuO, respectively. This is possibly due to the sum or accumulation of their effects.
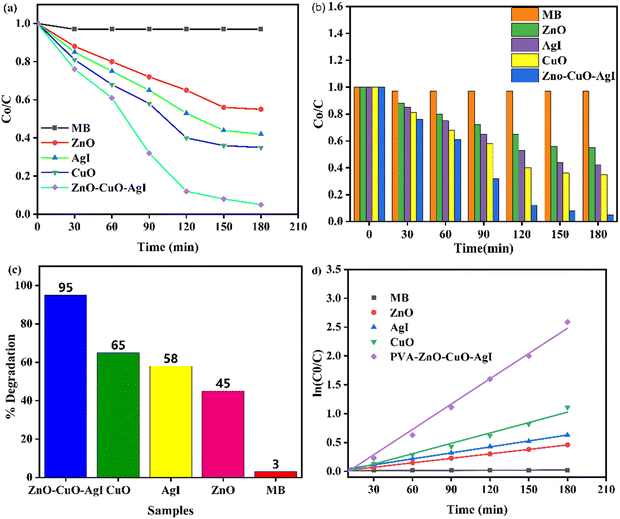 |
| | Fig. 11 (a) C/C0versus time in min, (b) C/C0versus time in min at each 30 min interval, (c) highest % degradation, and (d) kinetic rate of MB as a function of time using 10 mg of MB and 110 mg of ZnO–AgI–CuO nanocomposite under visible light irradiation. | |
3.8.1. Initial dye concentration.
The initial dye concentration plays a significant role in photocatalysis because it affects the reaction kinetics and the overall efficiency of the process. The degradation efficiency of the ZnO–AgI–CuO nanocomposite was explored using 100 mL aqueous solutions of initial MB dye concentration (10, 15, 20, 25, 30, and 35 mg) and 110 mg of catalyst load (Fig. 12a–d). The experimental results showed that the highest degradation efficiency achieved was 95% when the initial concentration of the MB dye was 10 mg. In contrast, the lowest efficiency of 62% was observed when the initial concentration was 35 mg (Fig. 12b–d). These findings suggest that the degradation efficiency increases as the initial dye concentration decreases. The explored absorbance for the optimized initial dye content was conducted under visible light radiation. The results indicate that the absorbance increased from 0 to 180 min (Fig. 12a). This may be due to the higher concentration of dye molecules, which can impede the accessibility of active sites on the nanocomposite catalyst. A more significant number of dye molecules may hinder the penetration of photon light into the surface. Consequently, the photocatalytic reaction may be impeded, resulting in lower degradation efficiency.
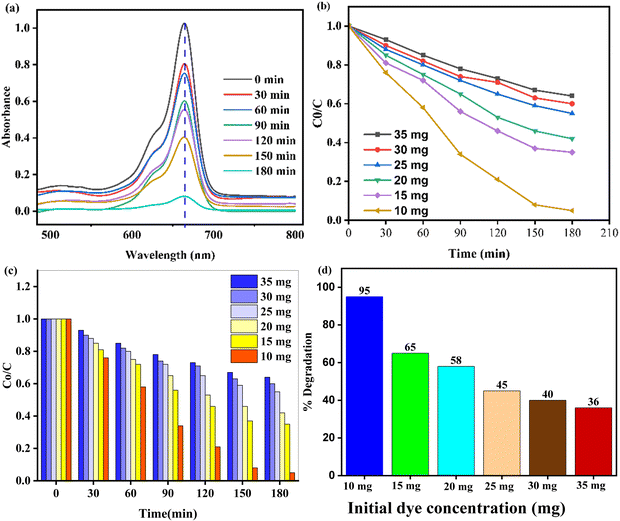 |
| | Fig. 12 (a) UV spectra with 10 mg of MB and 110 mg of catalyst load, (b) and (c) initial dye concentration, and (d) % degradation efficiency of the ZnO–AgI–CuO nanocomposite. | |
3.8.2. Photocatalyst load.
The photocatalytic efficiency of the ZnO–AgI–CuO nanocomposite was investigated using 100 mL aqueous solutions of 50, 70, 90, 110, 130, and 150 mg of its loads, along with an initial MB dye concentration of 10 mg (Fig. 13a–d). Typically, the experiments were started in the dark for the desorption–adsorption process. No change was observed in the dark. The efficiency was higher when a catalyst load of 110 mg was used. In this study, the degradation efficiency increased as the catalyst content increased from 50 to 110 mg and declined beyond 110 mg catalyst load, as Fig. 13b and c illustrated. The dye concentration decreased in the beaker's solution as a time change occurred from 0 to 180 min (Fig. 13b and c). This means that higher photocatalyst loads can potentially enhance the reaction rate. The decrease in dye concentration can be attributed to more available active sites and high surface area on the catalyst. However, excessive photocatalyst loads can lead to aggregation or insufficient light penetration.58 Furthermore, the absorbance for the selected photocatalyst load was investigated using UV-vis spectroscopy (Fig. 13a). The obtained result reveals that the absorbance increased as the time duration increased from 0 to 180 min. This is because the photodegrading potential of the synthesized photocatalyst increases over time. The highest efficiency at each catalyst load is depicted in Fig. 13d.
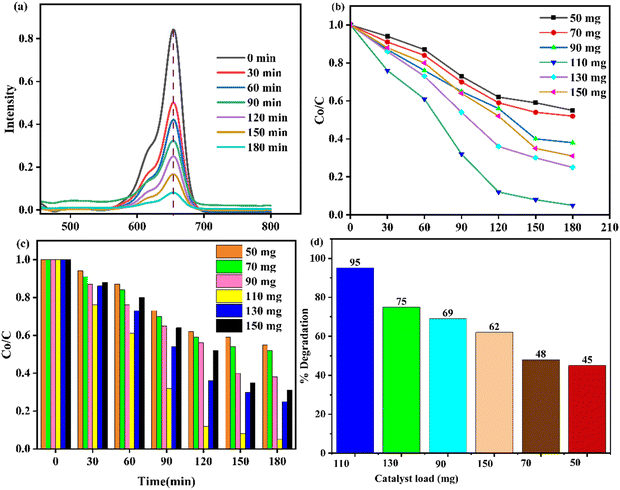 |
| | Fig. 13 (a) UV spectra, (b) and (c) 110 mg of catalyst load concentration, and (d) % degradation efficiency of the ZnO–AgI–CuO nanocomposite. | |
3.8.3. Recyclability and stability.
We examined the durability of the ZnO–AgI–CuO nanocomposite by reusing it for five repeated reaction cycles, and the results are presented in Fig. 14a and b. The results show that the ZnO–AgI–CuO nanocomposite maintains nearly similar activity in five subsequent cycles, showing that the nanocomposite has good photocatalytic stability. For the stability confirmation of the ZnO–AgI–CuO nanocomposite, we performed FTIR, XRD, and DRS analyses to determine the functional groups and band gap energy after degradation reactions were completed. We found that the ZnO–AgI–CuO nanocomposite had efficacy before and after the degradation reaction, as shown in Fig. 14c–e. This suggests that the functional groups and band gap energy of the ZnO–AgI–CuO nanocomposite do not change significantly during the degradation. This is probably due to the strong binding ability of PVA.
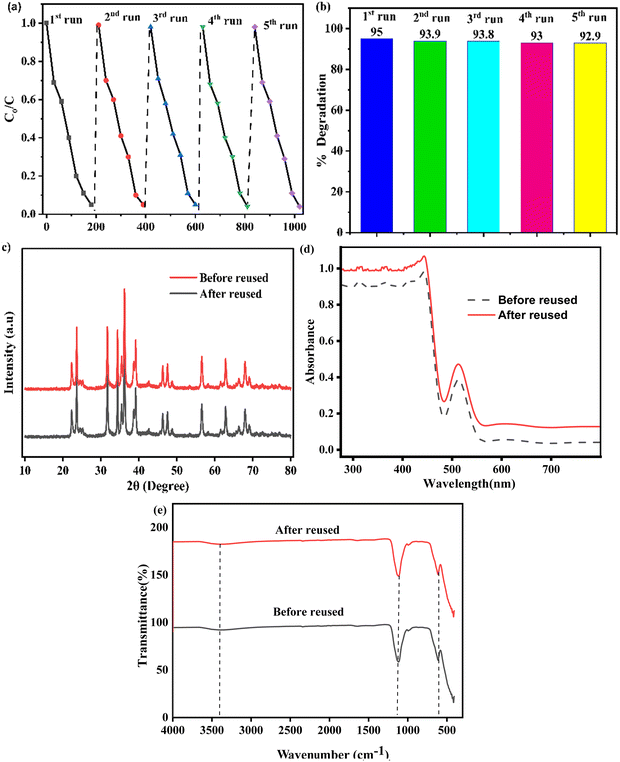 |
| | Fig. 14 Plots of (a) recyclability and stability, (b) % degradation vs. time, (c) diffraction patterns after and before reuse, (d) DRS before and after reuse, and (e) FTIR before and after reuse of PVA-supported ZnO–CuO–AgI. | |
3.8.4. Role of active species.
To explore the main active species responsible for degradation reactions, we used a ZnO–AgI–CuO nanocomposite along with different scavengers, such as holes (h+), superoxide ion radicals (O2˙−), and hydroxyl free radicals (˙OH). In this study, we utilized 15 mg of ethylenediaminetetraacetic acid (EDTA) to scavenge holes, 2-phenol (PN) to scavenge electrons, 1,4-benzoquinone (BQ) to scavenge superoxide ion free radicals, and ascorbic acid (ASA) to scavenge hydroxyl free radicals. Fig. 15a displays the degradation efficiency of a ZnO–AgI–CuO nanocomposite versus MB using EDTA, PN, BQ, and ASA scavengers. It is evidenced that the degradation efficiency of MB reached 95% in 3 h without scavengers (Fig. 15a). However, the degradation efficiency decreased to 40% when BQ was added. The addition of EDTA and PN resulted in a degradation rate of 48% and 51%, respectively, whereas the addition of ASA reduced it to 46%. These outcomes exhibit that superoxide ion free radicals and hydroxyl free radicals are the most important reactive species in the degradation reaction.37 Also, we designed the possible photodegradation mechanism to describe the condition of electron–hole separation in the ZnO–AgI–CuO nanocomposite surface. The estimated Eg values for ZnO, AgI and CuO were 3.25, 2.67, and 1.98 eV, respectively. The band positions and energy gap of each photocatalyst were calculated using eqn (3)–(5):25| |  | (4) |
where χ is the absolute electronegativity of the photocatalyst, E is the energy of free electrons on the hydrogen scale (4.5 eV) vs. NHE, and Eg is the band gap energy. EVB is valence band edge potential, ECB is the conduction band edge potential, (a, b, and c) are the number of atoms, whereas (A, B, and C) are the sum of the ionization energy (EIE) and electron affinity (EEA) of each atom present in the compound. Consequently, the estimated χ values were 5.79 eV (ref. 56 and 59) for ZnO, 5.48 eV (ref. 60) for AgI, and 5.81 eV (ref. 61) for CuO, and the calculated values of ECB and EVB are presented in Table S4 (ESI†). Two possible schematic mechanisms were proposed based on the estimated energy values (Fig. 15b and c). As shown in Fig. 15b, when the ZnO–AgI–CuO nanocomposite is irradiated with light, a hole is created at the VB, and an electron is excited at the CB of three phases. The CB edge of CuO is less negative than that of ZnO and AgI. Meanwhile, the EVB value of ZnO was more positive than those of the CuO and AgI photocatalysts. Moreover, the CB edge potentials of ZnO and AgI are more negative than those of the CuO photocatalysts. In this investigation, the photoexcited electrons found at the CB of AgI transfer to the CB of ZnO, and the electron of ZnO transfers to the CB of the CuO photocatalyst, leaving holes in the VB of AgI and ZnO, as indicated in Fig. 15b. In contrast, the photoexcited holes from VB of ZnO transfer to VB of the CuO and AgI photocatalysts. The electrons accumulated at the CB of CuO cannot participate in the reduction of oxygen. This is due to the lower reductive potential of the CB of CuO as compared to the standard reduction potential of O2/O2˙− (E° = −0.33 eV).62 The accumulated holes at the VB of AgI can oxidize H2O to produce hydroxyl radicals (˙OH). This is due to their higher oxidative potential compared to the standard oxidative potential (˙OH/H2O; E° = +1.98).63 Therefore, these types of heterojunction schematic diagram proposed for the ZnO–AgI–CuO nanocomposite are not consistent with the results obtained from the reactive species detection experiment (Fig. 15a).64
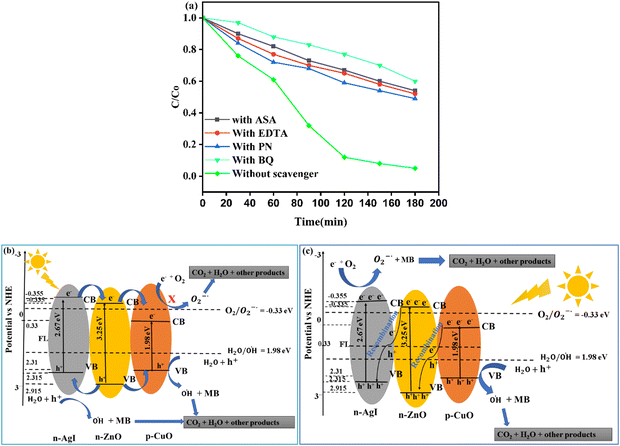 |
| | Fig. 15 (a) Without scavenger, and with the effects of EDTA, SN, PN, and ASA scavengers on the photodegradation efficacy of MB, (b) proposed heterojunction structure of the electron–hole and transfers in the photodegradation reaction, and (c) proposed double Z-scheme mechanism of the electron–hole and transfers in the photodegradation reaction over ZnO–AgI–CuO. | |
On the other hand, for the proposed Z-scheme mechanism, the n-ZnO,56 n-AgI,65 and p-CuO56 can generate e−/h+ pairs when exposed to light.66 When the n-AgI,65,67 and n-ZnO14 semiconductors are brought into contact with the p-CuO semiconductor14 to form a n–n–p heterojunction, the Fermi levels (FLs) of the n-AgI65 and ZnO14 move downward and the FL of the p-CuO material moves upward.14 This movement of the FL continues until it reaches an equilibrium state across the heterojunction (Fig. 15c). At equilibrium, an internal electric field is directed to n-ZnO from the n-AgI and p-CuO photocatalysts. As a result, the photogenerated electrons could be transferred from the CB of CuO to the VB of ZnO and recombined with photogenerated holes in the EVB of ZnO. Furthermore, the photogenerated electrons in the ECB of ZnO could also be transferred and recombined with holes in the EVB of the AgI photocatalyst by the internal electric field at the interfacial junction.24,25 This is due to the relative positions of the ECB and EVB, resulting in the efficient separation of electrons and hole pairs.68,69 Thus, the accumulated electrons in the CB of AgI can easily reduce the O2 to produce the O2˙− and the O2˙− could participate in the MB degradation process. Concurrently, the holes in the EVB of CuO can directly contribute to the oxidative reaction by producing hydroxyl radicals due to their potentials being more positive than the (˙OH/H2O; E° = +1.98).63 Therefore, the proposed double Z-scheme mechanism of the ZnO–AgI–CuO nanocomposite is consistent with the results obtained from the reactive species detection experiment (Fig. 15a). As a result, the proposed Z-scheme system would be closer to the actual photocatalytic mechanism, which in turn, greatly increased the photocatalytic activity of the ZnO–AgI–CuO nanocomposite related to degrading MB (Fig. 15c).
3.8.5. Industrial wastewater analysis.
The ZnO–AgI–CuO nanocomposite effectively degraded dye pollutants from industrial wastewater under UV-vis light radiation within 3 h (Fig. 16a and b). Typically, UV-vis light radiation was used as the energy source to activate the nanocomposite, generate charge carriers in the composite, drive the photocatalytic reactions, and initiate the degradation process. Fig. 16a reveals an enlarged degradation rate after 3.5 h, while Fig. 16b proves that the synthesized material degraded 82% of the dyes from the wastewater. These findings indicate that the ZnO–AgI–CuO nanocomposite performed well on the real sample, consistent with a previous study by R. Saravana et al.,70 and A. M. Tadesse et al.2 A comparison of the ZnO–AgI–CuO nanocomposite's performance using the real sample and MB dye revealed that its degradation efficiency towards the real sample is lower than that of MB, likely due to multiple organic dyes in the industrial wastewater.71 Nevertheless, the ZnO–AgI–CuO nanocomposite is an effective and promising material for removing dye pollutants from industrial wastewater.
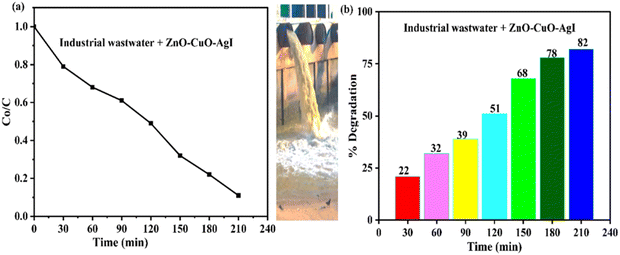 |
| | Fig. 16 Plots of (a) C0/C versus time, and (b) % degradation versus time of wastewater analysis of the ZnO–AgI–CuO nanocomposite. | |
4. Conclusion
Single phases of ZnO and CuO, and a multiphase ZnO–AgI–CuO nanocomposite were successfully synthesized using a sol–gel synthesis method at 500 °C. Meanwhile, the AgI photocatalyst was synthesized using the precipitation method. The prepared nanomaterials were characterized via various techniques to examine their thermal stability, functional groups, crystallite size, morphology, and optical properties. The HRTEM and SAED findings reveal the intimate contact of AgI and CuO photocatalysts on the surfaces of ZnO. The sample's photocatalytic performance was assessed by measuring the degradation efficiency of MB under visible-light irradiation. The photocatalytic efficiency of a single ZnO photocatalyst is lower than that of AgI and CuO. The efficiency of CuO is higher than that of the two pristine AgI and ZnO. This is probably due to the lower band gap energy of CuO photocatalysts. In this study, the ZnO–AgI–CuO nanocomposite revealed 2.11, 1.62, and 1.46 times higher photocatalytic efficiency than the ZnO, AgI, and CuO photocatalysts. This catalytic enhancement could be attributed to the synergistic effect of its components. The photocatalytic efficiency of ZnO–AgI–CuO towards MB and industrial wastewater was carried out. The efficiency of the synthesized nanocomposite towards MB dye is much higher than that of real samples. This is probably due to the presence of several pollutants in industrial wastewater. Reuse experiments for five cycles were studied using the ZnO–AgI–CuO nanocomposite with virtually the same performance after five successive runs. This indicates a highly stable performance and a high efficiency of the ZnO–AgI–CuO nanocomposite. This will inspire researchers to engage in interesting activities. A photocatalytic mechanism was also designed. In this study, hydroxyl free radicals significantly affect the reaction. Therefore, they are the main species involved in photodegradation.
Author contributions
This manuscript was written and conceptualized by Teketel Girma Gindose, Enyew Amare Zereffa, and Tsegaye Belege Atismea. They contributed to the design of the methodology and supervised, edited, and revised the work. Gebrehiwot Gebreslassie and Abera Beyene Gebreslassie participated in laboratory work, surface characterizations, and data interpretation.
Data availability
We confirm that the data that supports the findings of this study are available within the article, and its ESI.† Raw data that support the findings of this study are available from the corresponding author upon realistic request.
Conflicts of interest
There are no conflicts to declare.
Acknowledgements
Wolkite and Addis Ababa Science and Technology Universities supported this study. The authors are also grateful to Adama Science and Technology University for supporting the microstructure characterization and the Large Scientific Research Services Institution, China, for the surface characterizations.
References
- D. A. Yaseen and M. Scholz, Int. J. Environ. Sci. Technol., 2019, 16, 1193–1226 CrossRef CAS.
- A. M. Taddesse, M. Alemu and T. Kebede, J. Environ. Chem. Eng., 2020, 8, 104356 CrossRef CAS.
- T. Shindhal, P. Rakholiya, S. Varjani, A. Pandey, H. Hao, W. Guo, H. Y. Ng and M. J. Taherzadeh, Bioengineered, 2021, 12, 70–87 CrossRef CAS PubMed.
- M. Z. A. Warshagha and M. Muneer, ACS Omega, 2022, 7, 30171–30183 CrossRef CAS PubMed.
- T. Slama, H. B. Pourhassan, Z. Alenezi, F. N. Silini, A. Bouket, A. C. Luptakova, L. Silini, H. C. Golinska, P. Belbahri and L. Oszako, Appl. Sci., 2021, 11, 6255 CrossRef.
- S. A. M. Abdullah, P. John, Z. Ahmad, M. N. Ashiq, S. Manzoor, M. I. Ghori, M. U. Nisa, A. G. Abid and K. Y. Butt, Appl. Nanosci., 2021, 11, 2361–2370 CrossRef.
- P. L. Meena and J. Kumar Saini, Results Chem., 2023, 5, 100764 CrossRef.
- F. Achouri, S. Corbel, A. Aboulaich, L. Balan, A. Ghrabi, M. Ben Said and R. Schneider, J. Phys. Chem. Solids, 2014, 75, 1081–1087 CrossRef CAS.
- A. M. Taddesse, T. Bekele, I. Diaz and A. Adgo, J. Photochem. Photobiol., A, 2021, 406, 113005 CrossRef CAS.
- D. C. Ashiegbu, N. Moloto and H. Potgieter, Environ. Sci.: Adv., 2023, 2, 1–26 Search PubMed.
- Y. Cuia, L. Nengzib, J. Goua, Y. Huanga, B. Lia and X. Cheng, Sep. Purif. Technol., 2020, 232, 115959 CrossRef.
- Y. Yuan, G. F. Huang, W. Y. Hu, D. N. Xiong, B. X. Zhou, S. Chang and W. Q. Huang, J. Phys. Chem. Solids, 2017, 106, 1–9 CrossRef CAS.
- J. P. Shubha, S. F. Adil, M. Khan, M. R. Hatshan and A. Khan, ACS Omega, 2021, 6, 3866–3874 CrossRef CAS PubMed.
- P. L. Meena, K. Poswal, A. K. Surela and J. Saini, Water Sci. Technol., 2021, 84, 2615–2634 CrossRef CAS PubMed.
- M. Pirhashemi and A. H. Yangjeh, Sep. Purif. Technol., 2018, 193, 69–80 CrossRef CAS.
- S. Chattopadhyay, S. Dutta, A. Banerjee, D. Jana, S. Bandyopadhyay, S. Chattopadhyay and A. Sarkar, Phys. B, 2009, 404, 1509–1514 CrossRef CAS.
- A. Safeen, K. Safeen, M. Shafique, Y. Iqbal, N. Ahmed, M. A. Rauf Khan, G. Asghar, K. Althubeiti, S. Al Otaibi, G. Ali, W. H. Shah and R. Khan, RSC Adv., 2022, 12, 11923–11932 RSC.
- T. Welderfael, M. Pattabi, R. M. Pattabi and G. Arun Kumar Thilipan, J. Water Process Eng., 2016, 14, 117–123 CrossRef.
- V. Kumari, A. Mittal, J. Jindal and S. Yadav, Front. Mater. Sci., 2019, 13, 1–23 CrossRef.
- A. Hezam, K. Namratha, Q. A. Drmosh, Z. H. Yamani and K. Byrappa, Ceram. Int., 2017, 43, 5292–5301 CrossRef CAS.
- S. Ganesan, R. Gurunathan, R. Rao, P. Hans and U. Dahms, Appl. Nanosci., 2021, 13, 859–869 CrossRef.
- F. Mukhtar, T. Munawar, M. S. Nadeem, M. Naveed, M. Riaz and F. Iqbal, Mater. Chem. Phys., 2021, 263, 124372 CrossRef CAS.
- Z. Wang, Y. Gao, J. Wang, X. Jin, L. Fang, L. Zhang, M. He and G. Sun, J. Sol-Gel Sci. Technol., 2018, 88, 172–180 CrossRef.
- H. D. C. Ding, K. Fu, M. Wu, S. Gong, J. Liu and J. Shi, J. Photochem. Photobiol., A, 2021, 414, 113283 CrossRef.
- X. Wu, Y. Zhang, H. Wu, J. Guo, K. Wu and L. Zhang, J. Mater. Sci.: Mater. Electron., 2021, 32, 26241–26257 CrossRef CAS.
- B. Abebe, H. C. A. Murthy and E. A. Zereffa, Res. Express, 2020, 2020, 1–14 Search PubMed.
- Y. H. Zhou, Z. Bin Zhang, P. Xu, H. Zhang and B. Wang, Nanoscale Res. Lett., 2019, 14, 1–10 CrossRef CAS PubMed.
- C. Wang, H. Ni, J. Dai, T. Liu, Z. Y. Wu, X. Chen, Z. Dong, J. Qian and Z. Wu, Chem. Phys. Lett., 2022, 803, 1–9 Search PubMed.
- A. Das, M. Patra, M. Kumar P, M. Bhagavathiachari and R. G. Nair, Mater. Chem. Phys., 2021, 263, 124431 CrossRef CAS.
- X. Qi, L. Ting, Z. Qianhe, L. Liangyu, C. Chuntao, G. Dawei, L. Danyang and Y. Feifei, Chem. Res. Chin. Univ., 2024, 40, 484–489 CrossRef.
- R. S. Shinde, S. D. Khairnar, M. R. Patil, V. A. Adole, P. B. Koli, V. V. Deshmane, D. K. Halwar, R. A. Shinde, T. B. Pawar, B. S. Jagdale and A. V. Patil, J. Inorg. Organomet. Polym. Mater., 2022, 32, 1045–1066 CrossRef CAS.
- W. Zhu, Q. Yang, J. Du, P. Yin, J. Yi, Y. Liu, X. Wu and Z. Zhang, Curr. Appl. Phys., 2022, 39, 113–121 CrossRef.
- M. A. Hanif, J. Akter, Y. S. Kim, H. G. Kim, J. R. Hahn and L. K. Kwac, Catalysts, 2022, 12, 1–17 CrossRef.
- G. Gebreslassie, P. Bharali, U. Chandra, A. Sergawie, P. K. Baruah, M. R. Das and E. Alemayehu, Appl. Organomet. Chem., 2019, 33, 1–12 CrossRef.
- S. Ghattavi and A. Nezamzadeh-ejhieh, J. Mol. Liq., 2020, 324, 114563 Search PubMed.
- S. Wang, B. Zhu, M. Liu, L. Zhang, J. Yu and M. Zhou, Appl. Catal., B, 2019, 243, 19–26 CrossRef CAS.
- A. A. M. Sakib, S. M. Masum, J. Hoinkis, R. Islam and M. A. I. Molla, J. Compos. Sci., 2019, 3, 91 CrossRef.
- M. Song, K. Qi, Y. Wen, X. Zhang, Y. Yuan, X. Xie and Z. Wang, Sci. Total Environ, 2021, 793, 148519 CrossRef CAS PubMed.
- X. Ning, D. Jia, S. Li, M. F. Khan and A. Hao, Ceram. Int., 2023, 49, 21658–21666 CrossRef CAS.
- H. Abdo, K. Namratha, D. Ponnamma, Q. A. Drmosh, A. M. N. Saeed, C. Cheng and K. Byrappa, ACS Omega, 2018, 3, 12260–12269 CrossRef PubMed.
- B. Abebe, M. H. C. Ananda, E. Zerefa and E. Abdisa, Mater. Res. Express, 2020, 7, 1–16 Search PubMed.
- B. Abebe, A. C. H. Murthy, Z. Enyew and E. Yeshaneh, Mater. Res. Express, 2020, 7, 045011 CrossRef CAS.
- P. K. Gupta, S. Palanisamy, T. Gopal, R. Rajamani, S. Pandit, S. Sinha and V. K. Thakur, J. Compos. Sci., 2021, 5, 1–9 Search PubMed.
- R. Viswanatha, S. Sapra, S. S. Gupta, B. Satpati, P. V. Satyam, B. N. Dev and D. D. Sarma, J. Phys. Chem. B, 2004, 108, 6303–6310 CrossRef CAS PubMed.
- V. Soltaninejad, M. R. Ahghari, R. Taheri-ledari and A. Maleki, Langmuir, 2021, 37, 4700–4713 CrossRef CAS PubMed.
- J. K. Santosh Kumar, Balu Krishnakumar and Abilio J. F. N. Sobral, Carbohydr. Polym., 2018, 18, 0144–8617 Search PubMed.
- M. W. Alam, H. S. A. Qahtani, B. Souayeh, W. Ahmed, H. Albalawi, M. Farhan, A. Abuzir and S. Naeem, Antioxidants, 2022, 11, 1–17 CAS.
- M. K. Demssie Dejen, E. A. Zereffa and H. C. A. Murthy, Rev. Adv. Mater. Sci., 2020, 59, 464–476 Search PubMed.
- M. Maryudi, S. Amelia and S. Salamah, Reaktorn, 2019, 19, 168–171 CrossRef.
- A. Papadopoulou, N. Chalmpes, D. Gournis, N. Kostopoulou and E. K. Efthimiadou, Dalton Trans., 2022, 51, 3452–3461 RSC.
- J. K. S. Panimalar, R. Uthrakumar, E. Tamil Selvi, P. Gomathy, C. Inmozhi and K. Kaviyarasud, Surf. Interfaces, 2020, 20, 100512 CrossRef.
- J. Zhang and Z. Ma, Mater. Lett., 2018, 216, 216–219 CrossRef CAS.
- M. S. Mahnoush Malmir and A. Mosayebi, Desalin. Water Treat., 2019, 165, 124–133 CrossRef.
- C. Wang, H. Ni, J. Dai, T. Liu, Z. Wu and X. Chen, Chem. Phys. Lett., 2022, 803, 139815 CrossRef CAS.
- I. Ahmad, M. Muneer, A. S. Khder and S. A. Ahmed, ACS Omega, 2023, 8, 22708–22720 CrossRef CAS PubMed.
- K. Mubeen, A. Irshad, A. Safeen, U. Aziz, K. Safeen, T. Ghani, K. Khan, Z. Ali, I. ul Haq and A. Shah, J. Saudi Chem. Soc., 2023, 27, 101639 CrossRef CAS.
- A. E. Morales, E. S. Mora and U. Pal, Rev. Mex. Fis., 2017, 53, 18–22 Search PubMed.
- S. Balachandran and M. Swaminathan, J. Phys. Chem. C, 2012, 116, 26306–26312 CrossRef CAS.
- S. Zhang, S. Chen, L. He, J. Zhang, G. Chen, S. Meng, Y. Fan and X. Zheng, J. Phys. Chem. C, 2020, 124, 27916–27929 CrossRef.
- M. S. Gohari and A. H. Yangjeh, J. Colloid Interface Sci., 2016, 461, 144–153 CrossRef PubMed.
- J. Ni, J. Lei, Z. Wang, L. Huang, H. Zhu, H. Liu, F. Hu, T. Qu, H. Yang, H. Yang and C. Gong, Nanomaterials, 2023, 13, 1–16 Search PubMed.
- G. Gebreslassie, P. Bharali, U. Chandra and A. Sergawie, J. Photochem. Photobiol., A, 2019, 382, 111960 CrossRef CAS.
- G. Gebreslassie, P. Bharali, U. Chandra and A. Sergawie, Appl. Organomet. Chem., 2019, 1–12 Search PubMed.
- A. Alsulmi, N. N. Mohammed, A. Soltan, M. F. A. Messih and M. A. Ahmed, RSC Adv., 2023, 13, 13269–13281 RSC.
- S. Zarezadeh, A. Habibi-Yangjeh, M. Mousavi and S. Ghosh, Mater. Sci. Semicond. Process., 2020, 119, 105229 CrossRef CAS.
- C. Ding, K. Fu, Y. Pan, J. Liu, H. Deng and J. Shi, Catalysts, 2020, 10, 1097 CrossRef CAS.
- X. G. Zhang, D. L. Guan, C. G. Niu, Z. Cao, C. Liang, N. Tang, L. Zhang, X. J. Wen and G. M. Zeng, Sci. Total Environ, 2019, 668, 730–742 CrossRef CAS PubMed.
- C. Du, J. Song, S. Tan, L. Yang, G. Yu, H. Chen, L. Zhou, Z. Zhang, Y. Zhang, Y. Su, X. Wen and S. Wang, Mater. Chem. Phys., 2021, 260, 124136 CrossRef CAS.
- S. Ruan, W. Huang, M. Zhao, H. Song and Z. Gao, Mater. Sci. Semicond. Process., 2020, 107, 104835 CrossRef CAS.
- R. Saravanan, S. Karthikeyan, V. K. Gupta, G. Sekaran, V. Narayanan and A. Stephen, Mater. Sci. Eng., C, 2013, 33, 91–98 CrossRef CAS PubMed.
- H. Tedla, I. Díaz, T. Kebede and A. M. Taddesse, J. Environ. Chem. Eng., 2015, 3, 1586–1591 CrossRef CAS.
|
| This journal is © The Royal Society of Chemistry 2024 |
Click here to see how this site uses Cookies. View our privacy policy here.  Open Access Article
 abe,
Tsegaye Belege
Atisme
 ab,
Gebrehiwot
Gebreslassie
 abd,
Abera Beyene
Gebresilassie
abd and
Enyew Amare
Zereffa
 *c
*c
![[thin space (1/6-em)]](https://www.rsc.org/images/entities/char_2009.gif) :
:![[thin space (1/6-em)]](https://www.rsc.org/images/entities/char_2009.gif) 1 (20
1 (20![[thin space (1/6-em)]](https://www.rsc.org/images/entities/char_2009.gif) :
:![[thin space (1/6-em)]](https://www.rsc.org/images/entities/char_2009.gif) 20) L of distilled water and ethanol. A 0.5 mol L−1 sodium hydroxide solution was prepared and dropwise added to the zinc nitrate solution until pH 12. The resulting white suspension was settled down after 12 h, washed with ethanol and distilled water, dried, and oven-dried at 100 °C and calcined at 500 °C, respectively, to obtain the desired ZnO nanoparticles. Similarly, copper acetate was used to synthesize CuO photocatalysts using the same procedure. Moreover, for synthesizing AgI (by precipitation method), 0.02 mol L−1 of silver nitrate was dissolved in 0.05 L of distilled water. An equal amount of KI solution was added to the silver nitrate solution. The resulting yellow precipitate was filtrated, washed with distilled water, and dried in a closed oven at 100 °C.
20) L of distilled water and ethanol. A 0.5 mol L−1 sodium hydroxide solution was prepared and dropwise added to the zinc nitrate solution until pH 12. The resulting white suspension was settled down after 12 h, washed with ethanol and distilled water, dried, and oven-dried at 100 °C and calcined at 500 °C, respectively, to obtain the desired ZnO nanoparticles. Similarly, copper acetate was used to synthesize CuO photocatalysts using the same procedure. Moreover, for synthesizing AgI (by precipitation method), 0.02 mol L−1 of silver nitrate was dissolved in 0.05 L of distilled water. An equal amount of KI solution was added to the silver nitrate solution. The resulting yellow precipitate was filtrated, washed with distilled water, and dried in a closed oven at 100 °C.


![[4 with combining macron]](https://www.rsc.org/images/entities/char_0034_0304.gif) 3m space group). Furthermore, broad diffraction peaks of the ZnO–AgI–CuO nanocomposites that appeared at 22.44, 23.79, 31.84, 34.51,35.54, 36.33, 38.16, 39.71, 46.40, 47.62, 56. 68. 62.93 and 68.32° are respectively indexed to (100), (111), (100), (002), (
3m space group). Furthermore, broad diffraction peaks of the ZnO–AgI–CuO nanocomposites that appeared at 22.44, 23.79, 31.84, 34.51,35.54, 36.33, 38.16, 39.71, 46.40, 47.62, 56. 68. 62.93 and 68.32° are respectively indexed to (100), (111), (100), (002), (![[1 with combining macron]](https://www.rsc.org/images/entities/char_0031_0304.gif) 11), (101), (111), (102), (321), (102), (110), (102), and (200). The major peaks observed in ZnO also appeared in the ZnO–AgI–CuO composite material with slight shifts in their positions that might be due to the experimental setup. After loading the pristine samples, the broadening of the ZnO diffraction peaks was also observed to some extent. As the broadness of the diffraction peaks increases, it typically indicates that the crystallite size is decreasing. This leads to high structural imperfections, such as dislocations and grain boundaries (Fig. S1, ESI†). In the prepared nanocomposite, the diffraction peaks at 2θ values of 22.44, 23.79, 39.71, and 46.40° indicate the hexagonal structure of β-AgI.53 2θ values appeared at 35.54, 38.16, 62.93, and 68.10° revealing the presence of CuO. The other diffraction peaks are 31.84, 34.51, 36.33, 46.40, 47.62, and 56. 68, 62.93, and 68.32°, and confirm the hexagonal wurtzite structure of ZnO. The results show that the prevailing diffraction peaks of ZnO are apparent. On the other hand, the majority of ZnO diffraction peaks have appeared in the composite, compared to AgI and CuO. This is possibly due to a high zinc salt content during synthesizing the composite. All diffraction peaks located in ZnO–AgI–CuO are documented to be cubic, monoclinic, and hexagonal wurtzite structures for AgI, CuO, and ZnO, respectively. The obtained data reveals that AgI and CuO were dispersed well in forming a heterojunction (co-occurrence of ZnO, CuO, and AgI in the nanocomposite).
11), (101), (111), (102), (321), (102), (110), (102), and (200). The major peaks observed in ZnO also appeared in the ZnO–AgI–CuO composite material with slight shifts in their positions that might be due to the experimental setup. After loading the pristine samples, the broadening of the ZnO diffraction peaks was also observed to some extent. As the broadness of the diffraction peaks increases, it typically indicates that the crystallite size is decreasing. This leads to high structural imperfections, such as dislocations and grain boundaries (Fig. S1, ESI†). In the prepared nanocomposite, the diffraction peaks at 2θ values of 22.44, 23.79, 39.71, and 46.40° indicate the hexagonal structure of β-AgI.53 2θ values appeared at 35.54, 38.16, 62.93, and 68.10° revealing the presence of CuO. The other diffraction peaks are 31.84, 34.51, 36.33, 46.40, 47.62, and 56. 68, 62.93, and 68.32°, and confirm the hexagonal wurtzite structure of ZnO. The results show that the prevailing diffraction peaks of ZnO are apparent. On the other hand, the majority of ZnO diffraction peaks have appeared in the composite, compared to AgI and CuO. This is possibly due to a high zinc salt content during synthesizing the composite. All diffraction peaks located in ZnO–AgI–CuO are documented to be cubic, monoclinic, and hexagonal wurtzite structures for AgI, CuO, and ZnO, respectively. The obtained data reveals that AgI and CuO were dispersed well in forming a heterojunction (co-occurrence of ZnO, CuO, and AgI in the nanocomposite).


