 Open Access Article
Studies of a novel nano sustained-released drug delivery system with a hydroxyapatite core and polysuccinimide coating structure
Fengbo
Yu
a,
Qiang
Wang
b,
Dan
Liu
a,
Xingjun
Fan
a,
Lei
Tong
a,
Guangzhi
Shen
a and
Fengguo
Zhai
 *a
*a
aSchool of Pharmacy, Mudanjiang Medical University, Mudanjiang 157011, China. E-mail: fengguozh@126.com
bHongqi Hospital, Mudanjiang Medical University, Mudanjiang 157011, China
First published on 29th August 2024
Abstract
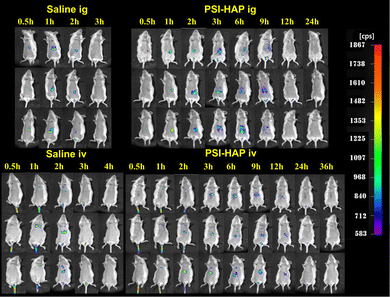
In this study, a nano drug delivery system for sustained release (PSI–HAP) with spherical or near-spherical particles and a negative zeta potential was established. PSI–HAP was prepared using polysuccinimide (PSI) as the coating material and hydroxyapatite (HAP) as the drug adsorption core. By simply mixing PSI and HAP in solution, uniformly size non-agglomerated nanoparticles could be generated rapidly via a facile preparation process. Herein, HAP was prepared using the micro-emulsion method (MEM), liquid phase reaction (LPR), precipitation method (PM), or hydrothermal method (HM). The effects of the HAP preparation process on PSI–HAP were investigated. The optimal formulations and preparation processes of PSI–HAP were determined using single-factor experiments and the Box–Behnken design (BBD) response surface method with different model drugs. Additionally, the drug-loading and release features of PSI–HAP preparations were measured, and the distribution of SCE–PSI–HAP (Schisandra chinensis extract, SCE) in vivo was determined. The in vitro drug release test showed that PSI–HAPs were pH-sensitive, showing complete drug release around pH 7. Meanwhile, in vivo experiment demonstrated that in animals, the retention time was significantly longer in the SCE–PSI–HAP preparation group than in the saline group, irrespective of whether the formulation was administered orally or injected. The findings showed that the proposed drug delivery system is easy to prepare and sterilize, making large-scale production feasible, which could be used clinically for multi-modal drug delivery.
1. Introduction
Hydroxyapatite (HAP), a weakly alkaline calcium phosphate salt that is slightly soluble in water, is a major component of human teeth and bones. The surface of HAP has an extremely high affinity for human tissues and can adhere well to them. HAP can then gradually be dissolved by bodily fluids or absorbed by tissues, showing excellent biocompatibility, osteoconductivity, good cell adhesion, excellent biodegradability, and non-inflammatory properties.1,2 In medicine, HAP has commonly been used as a material for orthopedic and dental implants.3,4 Various methods for HAP preparation have been reported, and the raw materials required are cost-effective, yet readily available. Porous HAP is an efficient adsorbent, available as a carrier for nucleic acid and protein drug.5,6 HAP exhibits different in vivo distribution and drug release behaviors according to its particle size. When the size of HAP reaches the nanometer scale, it exhibits a series of unique properties, showing a large specific surface and thus a strong drug-adsorption and -carrying capacity. Additionally, due to their small particle size, HAP nanoparticles can enter cancer cells via cell membrane channels and inhibit their growth.7 Nevertheless, HAP nanoparticles are not appropriate for use as independent nanodrug carriers for drug delivery in our study, especially injection administration, owing to severe aggregation. HAP nanoparticles can be used to carry drugs only when the following objectives are achieved: (1) relief of aggregation and enhancement of their physicochemical stability: HAP nanoparticles are highly prone to aggregation owing to their large specific surface area, which results in undesirable alterations in physical and chemical properties of the product; (2) enhancement of drug loading rate: the clinical efficacy of preparations is proportional to their drug loading rate; (3) stabilization of drug release: HAP nanoparticles tend to suddenly release the drugs adsorbed on their surface or bound to the surface layer via weak forces during the drug release process; (4) improvement of tissue delivery efficiency and cell transfection ability. The results of this study established that the use of PSI and its derivatives as coating films for drug-loading HAP smoothened their surface, solved the problem of aggregation, and avoided the sudden release phenomenon.Polysuccinimide (PSI) is a biodegradable, non-toxic, amorphous polymer that can be produced via direct condensation from aspartic acid monomers following dehydration by organic solvent-free methods, following green chemistry principles. During its synthesis, no harmful compounds are synthesized, renewable raw materials are used, and few by-products are released,8 making the production of PSI easily scalable. PSI undergoes a ring-opening reaction with OH− in solution to produce poly aspartic acid (PAA), a water-soluble derivative with a protein-like structure that can be biodegraded in the presence of lysosomal enzymes in vivo.9 PSI derivatives are often used for drug loading and the preparation of pH-sensitive and controlled-release gels,10–13 pH- and temperature-sensitive gels,14 pH-sensitive and controlled-release micelles,15–17 and CO2-responsive gels.18 PSI has a low polarity and is a membrane-directed polymer that easily penetrates tumor cells. Upon entry into tumor cells, the acyl imide bond of PSI is hydrolyzed, significantly changing the intracellular pH. This blocks the main enzymatic pathways of tumor cell metabolism and apoptosis, thereby inhibiting tumor development. The anti-tumor effect of PSI has been demonstrated in a variety of tumor cells, both in vitro and in vivo.19 Hence, PSI and HAP are very suitable for the delivery of anti-tumor drugs in vivo. PSI derivatives have also been described as adsorbent materials for the removal of anionic azo dyes from solutions20 and as green and potent inhibitors of the crystallization of calcium salts in water.21,22 Hence, PSI and its derivatives were selected as HAP coating materials. This interaction between PSI and its derivatives and calcium ions can lead to the formation of an organic polymer film on the surface of HAP (Ca10(PO4)6(OH)2). It can prevent the aggregation of HAP and reduce the size of HAP particles, thus generating a PSI–HAP nanocarrier. PSI has been demonstrated to be unsuitable for independent use as a drug carrier owing to severe nanoparticle aggregation (Fig. 3B). Furthermore, PSI derivatives, if used alone as drug-loading micelles, face problems of low drug loading rate, easy drug leakage, and poor physical stability.23 However, the PSI–HAP nano-delivery system, which is prepared by using solid HAP as the drug adsorption core and PSI as the coating, can overcome the problems of using HAP and PSI separately. The X–PSI–HAP delivery system prepared using PSI derivatives modified with different functional molecules (X–PSI) can further achieve active targeting, thus immensely improving the drug delivery efficiency.
In this study, a novel nano-sustained-release drug delivery system (DDS) PSI–HAP was established. The proposed DDS has an HAP core and PSI coating structure and mainly requires two excipients for preparations: a coating material consisting of PSI condensed from aspartic acid and a core consisting of HAP as the supporting core for drug loading and preparation. The drug-loading and release performance of as-prepared PSI–HAPs were validated using Schisandra chinensis extract (SCE) as a model drug to determine the best PSI–HAP formulation. Pharmacological studies have reported that SCE exhibits various pharmacological activities, including hepatoprotective, anti-inflammatory, anticancer, antiviral, antioxidant, and detoxification.24 In addition, based on the biopharmaceutics classification system (BCS), matrine (high solubility, high permeability), itraconazole (ITZ, low solubility, high permeability), atenolol (high solubility, low permeability), and ketoprofen (KPF, low solubility, low permeability) were also selected to investigate the drug loading and release capacities of the optimal PSI–HAP delivery system.
2. Experimental methods and materials
2.1. Materials
SCE (Schisandra chinensis extract) was purchased from Shaanxi Kepler Biotech Co., Ltd, Shanxi, China. Matrine, itraconazole, atenolol and ketoprofen were purchased from Shanghai Macklin Biochemical Co., Ltd, Shanhai, China. All the other chemicals such as toluene, N,N-dimethylformamide, tween-80, ammonia, phosphoric acid, anhydrous ethanol, crystalline calcium chloride, disodium hydrogen phosphate, sodium hydroxide, calcium nitrate, diammonium hydrogen phosphate and calcium hydroxide are all analytical grade obtained locally.2.2. Preparation of HAP core using different methods
The currently available preparation methods for nanoscale HAP mainly include dry and wet methods. The preparation process for HAP nanoparticles varies, and there are also certain differences in their morphology and structure. Preparing HAP nanoparticles using the dry method requires a relatively high reaction temperature and a long reaction time and also necessitates grinding. By contrast, the wet synthesis method requires a relatively low reaction temperature, which makes it easier to produce the nanoparticles.25,26 In this study, according to the principles of four wet synthesis methods for HAP nanoparticles, namely, microemulsion method (MEM),27–29 liquid phase reaction (LPR),30 precipitation method (PM),31 and hydrothermal method (HM),32 the preparation conditions in the PSI–HAP drug delivery system were determined via experimental exploration. The specific methods are as follows:![[thin space (1/6-em)]](https://www.rsc.org/images/entities/char_2009.gif) :
:![[thin space (1/6-em)]](https://www.rsc.org/images/entities/char_2009.gif) mHAP = 2
mHAP = 2![[thin space (1/6-em)]](https://www.rsc.org/images/entities/char_2009.gif) :
:![[thin space (1/6-em)]](https://www.rsc.org/images/entities/char_2009.gif) 1, 1
1, 1![[thin space (1/6-em)]](https://www.rsc.org/images/entities/char_2009.gif) :
:![[thin space (1/6-em)]](https://www.rsc.org/images/entities/char_2009.gif) 1, and 1
1, and 1![[thin space (1/6-em)]](https://www.rsc.org/images/entities/char_2009.gif) :
:![[thin space (1/6-em)]](https://www.rsc.org/images/entities/char_2009.gif) 2) in water under sonication (50 W, 35 kHz) for 1 min.
2) in water under sonication (50 W, 35 kHz) for 1 min.
2.3. Preparation of PSI for soft coating
L-Aspartic acid (10.0 g) was mixed with phosphoric acid (85%, 6 mL) and distilled water (1 mL) in a 250 mL round bottom flask at 170 °C for 1 h under reduced pressure in a ZFQ 85A rotary evaporator (EYELA, Beijing, China). After the reaction was complete, the solution was cooled to 100 °C, and 60 mL of N,N-dimethylformamide was added. The solution was then slowly dropped into 500 mL of distilled water under stirring (700 rpm). The precipitate was collected by filtration, washed with distilled water and dichloromethane or n-butanol to pH neutrality, and dried at 80 °C.2.4. Determination of the mass ratio of PSI coating and HAP and drug-loading capacity of PSI–HAPs
The findings from this study indicated that PSI and HAP could form non-aggregated, uniformly sized spherical or spherical-like PSI–HAP nanoparticles only in a certain mass range. If the mass ratio was too low and the amount of PSI was insufficient, coating the HAP and breaking its aggregation to form nanoparticles was difficult. Similarly, if the mass ratio was too high, the nanoparticles formed were prone to adhesion and aggregation. Therefore, it is necessary to examine the amount of PSI and HAP. The PSI and HAP powders were weighed out at different mass ratios (PSI![[thin space (1/6-em)]](https://www.rsc.org/images/entities/char_2009.gif) :
:![[thin space (1/6-em)]](https://www.rsc.org/images/entities/char_2009.gif) HAP = 1
HAP = 1![[thin space (1/6-em)]](https://www.rsc.org/images/entities/char_2009.gif) :
:![[thin space (1/6-em)]](https://www.rsc.org/images/entities/char_2009.gif) 1, 2
1, 2![[thin space (1/6-em)]](https://www.rsc.org/images/entities/char_2009.gif) :
:![[thin space (1/6-em)]](https://www.rsc.org/images/entities/char_2009.gif) 1, 3
1, 3![[thin space (1/6-em)]](https://www.rsc.org/images/entities/char_2009.gif) :
:![[thin space (1/6-em)]](https://www.rsc.org/images/entities/char_2009.gif) 1, and so on), and the PSI powder was added to a dimethylformamide or dimethylacetamide solution (concentration = 50 mg mL−1). The solution was then sonicated to achieve complete dissolution and stored. HAP prepared using different methods was dissolved in distilled water to prepare a HAP suspension (concentration = 5 mg mL−1), followed by sonication (50 W, 35 kHz, 1 min) to achieve homogeneity. The PSI solution was dripped into the HAP suspension under stirring (800 rpm) at room temperature. The precipitate was collected by centrifugation, washed repeatedly with distilled water and ethanol, and dried (drying, freeze-drying, or spray-drying depending on the purpose of the preparation). In this study, the samples were dried at 70 °C for 12 h. FT-IR and SEM were employed to characterize as-prepared PSI–HAPs and determine the mass ratio of PSI coating and HAPs of PSI and HAP. When the mass ratio of PSI coating and HAP was confirmed, a pre-test of PSI–HAP DLC was performed. The DLC and EE of PSI–HAPs prepared using different methods were examined by fixing the SCE to HAP ratio at 2
1, and so on), and the PSI powder was added to a dimethylformamide or dimethylacetamide solution (concentration = 50 mg mL−1). The solution was then sonicated to achieve complete dissolution and stored. HAP prepared using different methods was dissolved in distilled water to prepare a HAP suspension (concentration = 5 mg mL−1), followed by sonication (50 W, 35 kHz, 1 min) to achieve homogeneity. The PSI solution was dripped into the HAP suspension under stirring (800 rpm) at room temperature. The precipitate was collected by centrifugation, washed repeatedly with distilled water and ethanol, and dried (drying, freeze-drying, or spray-drying depending on the purpose of the preparation). In this study, the samples were dried at 70 °C for 12 h. FT-IR and SEM were employed to characterize as-prepared PSI–HAPs and determine the mass ratio of PSI coating and HAPs of PSI and HAP. When the mass ratio of PSI coating and HAP was confirmed, a pre-test of PSI–HAP DLC was performed. The DLC and EE of PSI–HAPs prepared using different methods were examined by fixing the SCE to HAP ratio at 2![[thin space (1/6-em)]](https://www.rsc.org/images/entities/char_2009.gif) :
:![[thin space (1/6-em)]](https://www.rsc.org/images/entities/char_2009.gif) 1. The SCE solution concentration was 10 mg mL−1 and the HAP concentration was 5 mg mL−1.
1. The SCE solution concentration was 10 mg mL−1 and the HAP concentration was 5 mg mL−1.
2.5. Drug delivery abilities of PSI–HAPs prepared using the MEM and LPR
2.6. Drug-loading and release capacities of PSI–HAPs loaded with drugs having different dissolution and absorption properties
The formulations of matrine-, itraconazole (ITZ)-, atenolol-, and ketoprofen (KPF)-loaded PSI–HAPs were evaluated using a single-factor experiment design and the BBD response surface optimization method, with EE and DLC as outcome indicators. Six batches of optimal drug-containing preparations were generated based on the selected formulation and process (MEM), and the EE and DLC values were examined. Finally, the in vitro drug release of different PSI–HAP preparations was determined.3. Results and discussions
3.1. Characterization and drug-loading evaluation of different HAPs
As shown in Fig. 1A, the positions of the main characteristic peaks of HAP prepared using different methods were broadly consistent:33,34 the weak broad peak at around 3500 cm−1 was assigned to the –OH group, the phosphate ν3 resonance was centered at ∼1036 cm−1, and the phosphate ν4 resonance produced peaks at ∼605 cm−1 and ∼565 cm−1. As illustrated in Fig. 1B, although the HAP prepared using different methods had the same FT-IR characteristic peak positions, the micro-structure was not the same. This may have contributed to differences in the drug adsorption capacity of individual HAP particles (Fig. 2).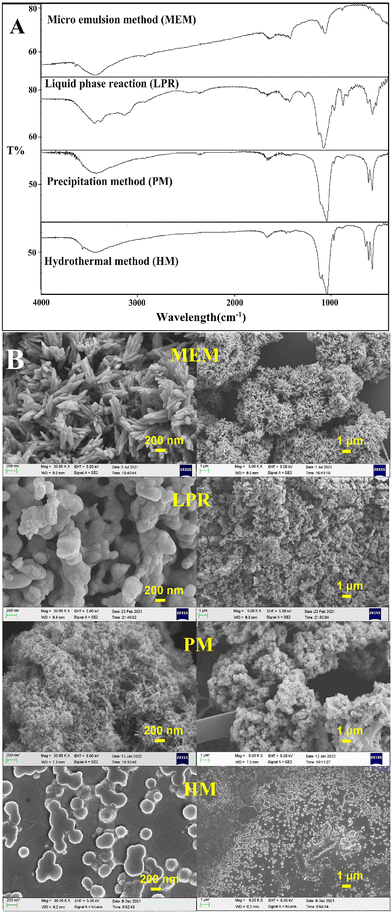 | ||
| Fig. 1 (A) FT-IR spectra of HAP prepared via different methods; (B) SEM images of HAP prepared via different methods. | ||
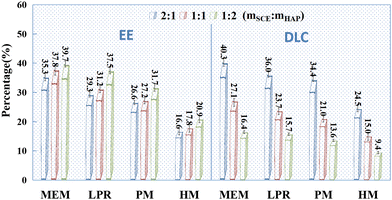
Drug-loading tests were performed for individual HAPs prepared using MEM, LPR, PM, and HM, with SCE as the model drug (Fig. 2). HAP prepared via MEM had the best adsorption capacity (both EE and DLC) for SCE, followed by HAP prepared via LPR and PM. However, it was relatively poor for the HAP prepared using HM. From Fig. 2, we could conclude that when the mass ratio of SCE and HAP was higher than 1![[thin space (1/6-em)]](https://www.rsc.org/images/entities/char_2009.gif) :
:![[thin space (1/6-em)]](https://www.rsc.org/images/entities/char_2009.gif) 1, DLC could be increased, but EE could not. Additionally, as indicated by the SEM images (Fig. 1B), HAP nanoparticles prepared using the currently accepted preparation methods did not exist as individual nanoparticles. Instead, they showed an aggregated structure, which is likely to change the physical stability of the preparation during storage. In addition, HAP nanoparticles are likely to show a sudden initial release of adsorbed drugs due to their presence on the surface of HAP. In conclusion, we believe that individual HAP nanoparticles prepared in the study were not very suitable as drug release carriers.
1, DLC could be increased, but EE could not. Additionally, as indicated by the SEM images (Fig. 1B), HAP nanoparticles prepared using the currently accepted preparation methods did not exist as individual nanoparticles. Instead, they showed an aggregated structure, which is likely to change the physical stability of the preparation during storage. In addition, HAP nanoparticles are likely to show a sudden initial release of adsorbed drugs due to their presence on the surface of HAP. In conclusion, we believe that individual HAP nanoparticles prepared in the study were not very suitable as drug release carriers.
3.2. Preparation and characterization of PSI
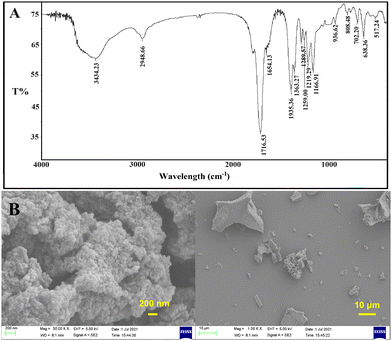
As shown in Fig. 3A, the main characteristic peaks of PSI on FT-IR were consistent with those reported previously:35 3434 cm−1, w, C![[double bond, length as m-dash]](https://www.rsc.org/images/entities/char_e001.gif) O stretching vibrations overtone; 2948 cm−1, m-w, O–H stretching vibration of –COOH; 1716 cm−1, s, amide I (C
O stretching vibrations overtone; 2948 cm−1, m-w, O–H stretching vibration of –COOH; 1716 cm−1, s, amide I (C![[double bond, length as m-dash]](https://www.rsc.org/images/entities/char_e001.gif) O stretching vibration); 1395 cm−1, m, C–H sym deformation vibration of –C–N–. As shown in Fig. 3B, PSI also appeared to be an aggregate, making it challenging to be used as a drug carrier alone.
O stretching vibration); 1395 cm−1, m, C–H sym deformation vibration of –C–N–. As shown in Fig. 3B, PSI also appeared to be an aggregate, making it challenging to be used as a drug carrier alone.
3.3. Determination of the mass ratios of PSI coating and HAP
PSI and HAP could form relatively homogeneous spherical particles only within a certain ratio. At ratios lower than this optimal value, the amount of PSI was insufficient to prevent HAP aggregation. Hence, only partial balling was possible. Moreover, at ratios higher than the optimal value, there is too much PSI, and large aggregates appear. Therefore, a certain ratio was required for PSI and HAP to form more homogeneous spheres. The mass ratio of PSI coating and HAP represented a range of values that could be confirmed using SEM images. As shown in Fig. 4A and B, the optimal mass ratio of PSI coating and HAP was about 3![[thin space (1/6-em)]](https://www.rsc.org/images/entities/char_2009.gif) :
:![[thin space (1/6-em)]](https://www.rsc.org/images/entities/char_2009.gif) 1 to 5
1 to 5![[thin space (1/6-em)]](https://www.rsc.org/images/entities/char_2009.gif) :
:![[thin space (1/6-em)]](https://www.rsc.org/images/entities/char_2009.gif) 1 during the fabrication of PSI–HAP with HAP prepared using MEM. Hence, during the fabrication of PSI–HAP with HAP prepared using LPR, the optimal mass ratio of PSI coating and HAP was around 8
1 during the fabrication of PSI–HAP with HAP prepared using MEM. Hence, during the fabrication of PSI–HAP with HAP prepared using LPR, the optimal mass ratio of PSI coating and HAP was around 8![[thin space (1/6-em)]](https://www.rsc.org/images/entities/char_2009.gif) :
:![[thin space (1/6-em)]](https://www.rsc.org/images/entities/char_2009.gif) 1 (Fig. 4C and D). As shown in Fig. 4E and F, the optimal mass ratio of PSI coating and HAP for PSI–HAP fabrication using HAP prepared via PM and HM were around 20
1 (Fig. 4C and D). As shown in Fig. 4E and F, the optimal mass ratio of PSI coating and HAP for PSI–HAP fabrication using HAP prepared via PM and HM were around 20![[thin space (1/6-em)]](https://www.rsc.org/images/entities/char_2009.gif) :
:![[thin space (1/6-em)]](https://www.rsc.org/images/entities/char_2009.gif) 1. In summary, the content of PSI required for PSI–HAP preparation is dependent on the method used for HAP preparation. When HAP is prepared using MEM, it is easier to achieve nano particles, and lower amounts of PSI are required. However, for HAP prepared using PM and HM, higher amounts of PSI are required. The most likely reason is the micro-structural differences in HAP created by the use of different preparation methods. We suppose that looser HAP micro-particle structures make it easier for PSI to break them up and form spherical particles.
1. In summary, the content of PSI required for PSI–HAP preparation is dependent on the method used for HAP preparation. When HAP is prepared using MEM, it is easier to achieve nano particles, and lower amounts of PSI are required. However, for HAP prepared using PM and HM, higher amounts of PSI are required. The most likely reason is the micro-structural differences in HAP created by the use of different preparation methods. We suppose that looser HAP micro-particle structures make it easier for PSI to break them up and form spherical particles.
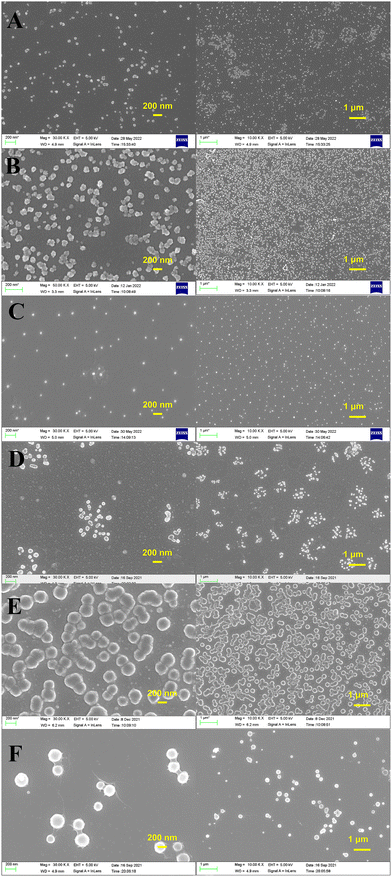 | ||
Fig. 4 SEM images of PSI–HAPs (A) MEM, mPSI![[thin space (1/6-em)]](https://www.rsc.org/images/entities/char_2009.gif) : :![[thin space (1/6-em)]](https://www.rsc.org/images/entities/char_2009.gif) mHAP = 3 mHAP = 3![[thin space (1/6-em)]](https://www.rsc.org/images/entities/char_2009.gif) : :![[thin space (1/6-em)]](https://www.rsc.org/images/entities/char_2009.gif) 1; (B) MEM, mPSI 1; (B) MEM, mPSI![[thin space (1/6-em)]](https://www.rsc.org/images/entities/char_2009.gif) : :![[thin space (1/6-em)]](https://www.rsc.org/images/entities/char_2009.gif) mHAP = 5 mHAP = 5![[thin space (1/6-em)]](https://www.rsc.org/images/entities/char_2009.gif) : :![[thin space (1/6-em)]](https://www.rsc.org/images/entities/char_2009.gif) 1; (C) LPR, mPSI 1; (C) LPR, mPSI![[thin space (1/6-em)]](https://www.rsc.org/images/entities/char_2009.gif) : :![[thin space (1/6-em)]](https://www.rsc.org/images/entities/char_2009.gif) mHAP = 7 mHAP = 7![[thin space (1/6-em)]](https://www.rsc.org/images/entities/char_2009.gif) : :![[thin space (1/6-em)]](https://www.rsc.org/images/entities/char_2009.gif) 1; (D) LPR, mPSI 1; (D) LPR, mPSI![[thin space (1/6-em)]](https://www.rsc.org/images/entities/char_2009.gif) : :![[thin space (1/6-em)]](https://www.rsc.org/images/entities/char_2009.gif) mHAP = 9 mHAP = 9![[thin space (1/6-em)]](https://www.rsc.org/images/entities/char_2009.gif) : :![[thin space (1/6-em)]](https://www.rsc.org/images/entities/char_2009.gif) 1; (E) PM, mPSI 1; (E) PM, mPSI![[thin space (1/6-em)]](https://www.rsc.org/images/entities/char_2009.gif) : :![[thin space (1/6-em)]](https://www.rsc.org/images/entities/char_2009.gif) mHAP = 20 mHAP = 20![[thin space (1/6-em)]](https://www.rsc.org/images/entities/char_2009.gif) : :![[thin space (1/6-em)]](https://www.rsc.org/images/entities/char_2009.gif) 1; (F) HM, mPSI 1; (F) HM, mPSI![[thin space (1/6-em)]](https://www.rsc.org/images/entities/char_2009.gif) : :![[thin space (1/6-em)]](https://www.rsc.org/images/entities/char_2009.gif) mHAP = 20 mHAP = 20![[thin space (1/6-em)]](https://www.rsc.org/images/entities/char_2009.gif) : :![[thin space (1/6-em)]](https://www.rsc.org/images/entities/char_2009.gif) 1. 1. | ||
3.4. Pre-test drug loading of PSI–HAPs
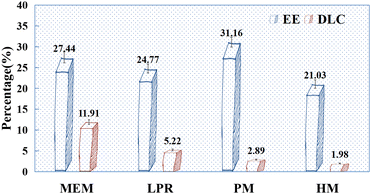
According to the pre-test results (Fig. 5), when MEM and LPR were used to prepare HAP, the EE of drugs was lower after PSI coating than after drug adsorption by HAP alone (Fig. 2). This may be because the balling of PSI and HAP breaks the aggregation of HAP, and thus, the drugs adsorbed on the surface may re-enter the solution, resulting in a decreased EE. Interestingly, this phenomenon was reversed in HAP prepared using other methods (PM and HM). This may be attributed to the fact that as the amount of PSI increases, some of the drug content is repackaged into the preparation. The pre-test results indicated that the amount of PSI used in the preparation of PSI–HAP via PM with HM was excessive, which resulted in a low final DLC. Therefore, only the SCE-loading and release performances of PSI–HAP prepared via MEM and LPR were compared in the following experiments.3.5. Optimization of the formulation and preparation of SCE-loaded PSI–HAP fabricated using MEM and LPR
![[thin space (1/6-em)]](https://www.rsc.org/images/entities/char_2009.gif) :
:![[thin space (1/6-em)]](https://www.rsc.org/images/entities/char_2009.gif) 1. The samples were sonicated (50 W, 35 kHz) for 0, 1, 3, 5, and 10 min, respectively, before mixing. After uniform mixing, the samples were centrifuged at high speed (12
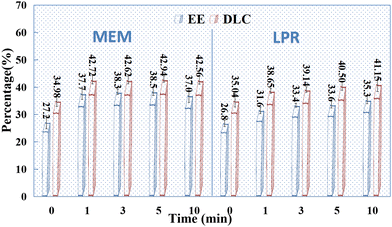
1. The samples were sonicated (50 W, 35 kHz) for 0, 1, 3, 5, and 10 min, respectively, before mixing. After uniform mixing, the samples were centrifuged at high speed (12![[thin space (1/6-em)]](https://www.rsc.org/images/entities/char_2009.gif) 000 rpm), and the supernatant was collected and fixed with the washing solution. As shown in Fig. 6, sonication had some effect on the adsorption of SCE by HAP alone, especially on HAP prepared using MEM. However, the effect of sonication time on drug adsorption by HAP was not significant, and the optimal sonication and mixing times were determined to be 1–3 min in this study.
000 rpm), and the supernatant was collected and fixed with the washing solution. As shown in Fig. 6, sonication had some effect on the adsorption of SCE by HAP alone, especially on HAP prepared using MEM. However, the effect of sonication time on drug adsorption by HAP was not significant, and the optimal sonication and mixing times were determined to be 1–3 min in this study.
The SCE concentration was 10 mg mL−1 and the mass ratio of the drug to HAP was 2![[thin space (1/6-em)]](https://www.rsc.org/images/entities/char_2009.gif) :
:![[thin space (1/6-em)]](https://www.rsc.org/images/entities/char_2009.gif) 1. The samples were sonicated (50 W, 35 kHz) for 3 min before mixing. After uniform mixing, a PSI solution (200 mg mL−1) was added dropwise at different PSI
1. The samples were sonicated (50 W, 35 kHz) for 3 min before mixing. After uniform mixing, a PSI solution (200 mg mL−1) was added dropwise at different PSI![[thin space (1/6-em)]](https://www.rsc.org/images/entities/char_2009.gif) :
:![[thin space (1/6-em)]](https://www.rsc.org/images/entities/char_2009.gif) HAP ratios (3
HAP ratios (3![[thin space (1/6-em)]](https://www.rsc.org/images/entities/char_2009.gif) :
:![[thin space (1/6-em)]](https://www.rsc.org/images/entities/char_2009.gif) 1 in MEM and 8
1 in MEM and 8![[thin space (1/6-em)]](https://www.rsc.org/images/entities/char_2009.gif) :
:![[thin space (1/6-em)]](https://www.rsc.org/images/entities/char_2009.gif) 1 in LPR) under different stirring conditions. As shown in Fig. 7, stirring was found to be essential for the nanospheroidization of PSI and HAP. Theoretically, a higher stirring rate would promote rapid contact between PSI and HAP. In practice, however, an overtly high stirring rate tends to cause solution splashing. After a certain threshold, the stirring speed does not significantly affect the EE of the preparation. In this study, the stirring rate was set to 1000 rpm. As indicated, sonication helped improve the encapsulation and loading of SCE. Hence, sonication was included in the PSI–HAP preparation process. Temperature had no significant effect on the encapsulation and drug-loading behaviors of PSI–HAP. Hence, room temperature was selected for this process. In general, the preparation of PSI–HAP was not strongly dependent on process conditions such as ultrasound and temperature. This could primarily be because the process through which PSI and HAP formed nanoparticles was quite rapid.
1 in LPR) under different stirring conditions. As shown in Fig. 7, stirring was found to be essential for the nanospheroidization of PSI and HAP. Theoretically, a higher stirring rate would promote rapid contact between PSI and HAP. In practice, however, an overtly high stirring rate tends to cause solution splashing. After a certain threshold, the stirring speed does not significantly affect the EE of the preparation. In this study, the stirring rate was set to 1000 rpm. As indicated, sonication helped improve the encapsulation and loading of SCE. Hence, sonication was included in the PSI–HAP preparation process. Temperature had no significant effect on the encapsulation and drug-loading behaviors of PSI–HAP. Hence, room temperature was selected for this process. In general, the preparation of PSI–HAP was not strongly dependent on process conditions such as ultrasound and temperature. This could primarily be because the process through which PSI and HAP formed nanoparticles was quite rapid.
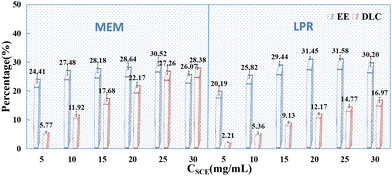
With the above-mentioned influencing factors determined, the effects of drug concentration (5 mg mL−1, 10 mg mL−1, 15 mg mL−1, 20 mg mL−1, 25 mg mL−1, 30 mg mL−1) on the DLC and EE of PSI–HAP were investigated. As indicated in Fig. 8, drug concentration had a significant effect on the EE and DLC of PSI–HAP. When the drug was in the mixed state, the EE and DLC were relatively high, suggesting that the PSI–HAP-encapsulated drug was not only in the solution state but also in the solid state. This may also explain why the inclusion of sonication during the preparation process increases drug loading, as sonication can help in more uniformly dispersing the undissolved drug. PSI–HAP prepared using both preparation methods had a good DLC at a drug concentration of 25 mg mL−1.
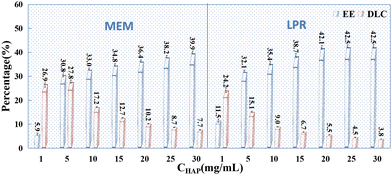
After selecting a drug concentration of 25 mg mL−1 and the above-mentioned preparation conditions, the effects of HAP concentration (1 mg mL−1, 5 mg mL−1, 10 mg mL−1, 15 mg mL−1, 20 mg mL−1, 25 mg mL−1, and 30 mg mL−1) on drug loading and encapsulation in PSI–HAP were investigated. Overall, when HAP adsorbs drugs alone (see Fig. 3), the EE of the dissolved drug (SCE concentration ≤ 10 mg mL−1) is proportional to the HAP concentration, indicating that increasing HAP concentration favors drug adsorption. Nevertheless, the DLC is negatively related to the HAP concentration, especially after PSI addition. Hence, the HAP concentration should not be too high during the preparation of PSI–HAP. As shown in Fig. 6, the EE of the water-dissolved drug in PSI–HAP prepared using MEM and LPR was lower for HAP after PSI coating than in HAP without a coat. This could be because the combination of PSI and HAP breaks the aggregation of HAP, resulting in a partial re-dissolution of the HAP-adsorbed drug. However, drugs in mixed suspension (SCE concentration > 10 mg mL−1) exhibit the opposite trend (see Fig. 9). Meanwhile, the EE of drugs from mixed suspensions was proportional to the concentration and content of HAP, but such an increase in the EE induced by increasing contents of HAP and PSI had no positive effects on the DLC of the PSI–HAP preparation. Additionally, the EE of drugs in a mixed suspension of PSI–HAP prepared using MEM would decrease drastically if the HAP concentration is too low and the drug-to-HAP ratio is too high (25![[thin space (1/6-em)]](https://www.rsc.org/images/entities/char_2009.gif) :
:![[thin space (1/6-em)]](https://www.rsc.org/images/entities/char_2009.gif) 1). The EE of the drug was higher in the mixed suspension of PSI–HAP prepared using the LPR method than in that of PSI–HAP prepared using MEM at a constant HAP concentration. This may be attributed to the coating of the drug by PSI when the PSI levels were high. Nevertheless, such an increase in EE as a function of HAP concentration was negligible. Likewise, such an increase in EE had no significant effects on the DLC of the PSI–HAP preparation.
1). The EE of the drug was higher in the mixed suspension of PSI–HAP prepared using the LPR method than in that of PSI–HAP prepared using MEM at a constant HAP concentration. This may be attributed to the coating of the drug by PSI when the PSI levels were high. Nevertheless, such an increase in EE as a function of HAP concentration was negligible. Likewise, such an increase in EE had no significant effects on the DLC of the PSI–HAP preparation.
| Independent variables | Process factors | Level | |||
|---|---|---|---|---|---|
| MEM | Concentration of SCE, CSCE (mg mL−1) | A | 15 | 25 | 35 |
Mass ratio of SCE to HAP, mSCE![[thin space (1/6-em)]](https://www.rsc.org/images/entities/char_2009.gif) : :![[thin space (1/6-em)]](https://www.rsc.org/images/entities/char_2009.gif) mHAP mHAP |
B | 2 | 4 | 6 | |
Mass ratio of PSI to HAP, mPSI![[thin space (1/6-em)]](https://www.rsc.org/images/entities/char_2009.gif) : :![[thin space (1/6-em)]](https://www.rsc.org/images/entities/char_2009.gif) mHAP mHAP |
C | 3 | 4 | 5 | |
| LPR | Concentration of SCE, CSCE (mg mL−1) | A | 15 | 25 | 35 |
Mass ratio of SCE to HAP, mSCE![[thin space (1/6-em)]](https://www.rsc.org/images/entities/char_2009.gif) : :![[thin space (1/6-em)]](https://www.rsc.org/images/entities/char_2009.gif) mHAP mHAP |
B | 2 | 4 | 6 | |
Mass ratio of PSI to HAP, mPSI![[thin space (1/6-em)]](https://www.rsc.org/images/entities/char_2009.gif) : :![[thin space (1/6-em)]](https://www.rsc.org/images/entities/char_2009.gif) mHAP mHAP |
C | 7 | 8 | 9 | |
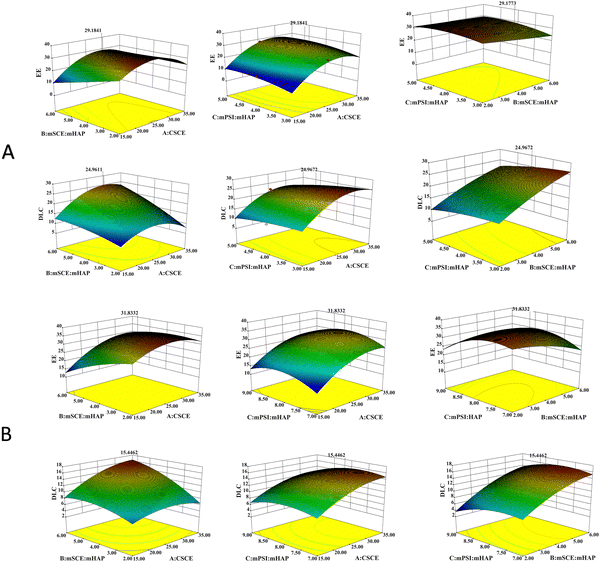
As shown in Table 2, when EE was selected as the response using MEM to prepare SCE–PSI–HAP, the p-value of individual factor A (CSCE), B (mSCE![[thin space (1/6-em)]](https://www.rsc.org/images/entities/char_2009.gif) :
:![[thin space (1/6-em)]](https://www.rsc.org/images/entities/char_2009.gif) mHAP) was <0.001. The p-value of A2, B2, and interaction items AB was <0.05, while the other factors were not significant. This indicated that the SCE concentration (A) and the mass ratio of SCE to HAP (B) had a significant effect on the EE. Furthermore, the F values showed that the order of factors affecting drug loading was B > A > C (mPSI
mHAP) was <0.001. The p-value of A2, B2, and interaction items AB was <0.05, while the other factors were not significant. This indicated that the SCE concentration (A) and the mass ratio of SCE to HAP (B) had a significant effect on the EE. Furthermore, the F values showed that the order of factors affecting drug loading was B > A > C (mPSI![[thin space (1/6-em)]](https://www.rsc.org/images/entities/char_2009.gif) :
:![[thin space (1/6-em)]](https://www.rsc.org/images/entities/char_2009.gif) mHAP), meaning that the mass ratio of drug to HAP (B) had the most significant effect on the EE, while the mass ratio of PSI to HAP (C) had no significant effect. When DLC was selected as the response, the p-value of A, B, C, and B2 was <0.001, suggesting an extremely significant effect on DLC. The p-value of AB, A2, and B2 was <0.05, while the other factors were not significant. The F value indicated that the order of factors affecting DLC was B > C > A, but all three factors had a significant impact on DLC. The mass ratio of the drug to HAP (B) remained the most significant factor for DLC. The mass ratio of PSI to HAP (C) also had a significant impact on DLC (Table 2). For EE following LPR, the p-value of B and A2 was <0.001, and that of A and C2 was <0.05. The other factors had no significant impact. The order of F values was B > A > C, similar to that observed with MEM. For DLC following LPR, the p-value of B and A2 was <0.001, while the p-value of A, C, B2, and C2 was <0.05. The order of F values was still B > C > A, similar to MEM.
mHAP), meaning that the mass ratio of drug to HAP (B) had the most significant effect on the EE, while the mass ratio of PSI to HAP (C) had no significant effect. When DLC was selected as the response, the p-value of A, B, C, and B2 was <0.001, suggesting an extremely significant effect on DLC. The p-value of AB, A2, and B2 was <0.05, while the other factors were not significant. The F value indicated that the order of factors affecting DLC was B > C > A, but all three factors had a significant impact on DLC. The mass ratio of the drug to HAP (B) remained the most significant factor for DLC. The mass ratio of PSI to HAP (C) also had a significant impact on DLC (Table 2). For EE following LPR, the p-value of B and A2 was <0.001, and that of A and C2 was <0.05. The other factors had no significant impact. The order of F values was B > A > C, similar to that observed with MEM. For DLC following LPR, the p-value of B and A2 was <0.001, while the p-value of A, C, B2, and C2 was <0.05. The order of F values was still B > C > A, similar to MEM.
| Source | MEM | LPR | ||||||
|---|---|---|---|---|---|---|---|---|
| EE | DLC | EE | DLC | |||||
| p-Value | F value | p-Value | F value | p-Value | F value | p-Value | F value | |
| Note: p-values >0.05 are not significant, p-values <0.05 are significant, and p-values <0.001 are extremely significant. | ||||||||
| Model | 0.0016 | 12.33 | 0.0009 | 14.95 | <0.0001 | 30.72 | <0.0001 | 159.52 |
| A | 0.0054 | 15.76 | 0.0048 | 16.46 | <0.0001 | 77.04 | <0.0001 | 280.28 |
| B | 0.0038 | 17.99 | 0.0001 | 57.72 | 0.0001 | 57.40 | <0.0001 | 604.99 |
| C | 0.1867 | 2.14 | 0.0320 | 7.13 | 0.0488 | 5.67 | <0.0001 | 84.56 |
| AB | 0.0174 | 9.60 | 0.0196 | 9.07 | 0.0038 | 18.06 | <0.0001 | 121.11 |
| AC | 0.8976 | 0.018 | 0.6418 | 0.24 | 0.8022 | 0.068 | 0.1933 | 2.07 |
| BC | 0.3903 | 0.84 | 0.9196 | 0.011 | 0.0038 | 18.04 | 0.0176 | 9.53 |
| A2 | 0.0001 | 59.67 | 0.0004 | 39.58 | 0.0003 | 42.74 | <0.0001 | 115.96 |
| B2 | 0.9115 | 0.013 | 0.2283 | 1.74 | 0.0368 | 6.62 | <0.0001 | 85.72 |
| C2 | 0.1190 | 3.15 | 0.4203 | 0.73 | 0.0003 | 41.82 | <0.0001 | 96.59 |
| Lack of fit | 0.1952 | 2.54 | 0.0518 | 6.45 | 0.1830 | 2.67 | 0.7657 | 0.39 |
As shown in Table 3, both the multivariate correlation coefficients (R2) were above 95%, indicating that the correlation between them was significant. The difference between Adj R2 and Pred R2 for EE and DLC was less than 0.2, indicating that the regression model developed by the BBD method could adequately describe the process. The CV was <10%, indicating high experimental confidence and accuracy. Adeq precision, the ratio of signal to noise, is considered reasonable when the value is greater than 4. Moreover, the fitted regression equation met the above test principles and was well adapted. The 3D response surface plots of all the responses showing the effects of different factors are presented in Fig. 10.
| Response | MEM | LPR | ||
|---|---|---|---|---|
| EE | DLC | EE | DLC | |
| R 2 | 0.9407 | 0.9506 | 0.9753 | 0.9951 |
| Adj R2 | 0.8644 | 0.8870 | 0.9436 | 0.9889 |
| Pred R2 | 0.3458 | 0.3313 | 0.7235 | 0.9765 |
| Adequate precision | 11.617 | 11.851 | 17.713 | 43.223 |
| C.V.% | 9.84 | 11.19 | 5.92 | 3.39 |
The resultant optimized formulation for MEM was: CSCE = 29.24 mg mL−1, mSCE![[thin space (1/6-em)]](https://www.rsc.org/images/entities/char_2009.gif) :
:![[thin space (1/6-em)]](https://www.rsc.org/images/entities/char_2009.gif) mHAP = 6, and mPSI
mHAP = 6, and mPSI![[thin space (1/6-em)]](https://www.rsc.org/images/entities/char_2009.gif) :
:![[thin space (1/6-em)]](https://www.rsc.org/images/entities/char_2009.gif) mHAP = 4.03. Under these conditions, the experimental results showed that the EE was equal to 29.14%, while the DLC was equal to 25.00%. The resultant optimized formulation for LPR was: CSCE = 32.62 mg mL−1, mSCE
mHAP = 4.03. Under these conditions, the experimental results showed that the EE was equal to 29.14%, while the DLC was equal to 25.00%. The resultant optimized formulation for LPR was: CSCE = 32.62 mg mL−1, mSCE![[thin space (1/6-em)]](https://www.rsc.org/images/entities/char_2009.gif) :
:![[thin space (1/6-em)]](https://www.rsc.org/images/entities/char_2009.gif) mHAP = 5.2, and mPSI
mHAP = 5.2, and mPSI![[thin space (1/6-em)]](https://www.rsc.org/images/entities/char_2009.gif) :
:![[thin space (1/6-em)]](https://www.rsc.org/images/entities/char_2009.gif) mHAP = 7.93. Under these conditions, the experimental results showed that the EE was equal to 31.83%, while DLC was equal to 15.45%.
mHAP = 7.93. Under these conditions, the experimental results showed that the EE was equal to 31.83%, while DLC was equal to 15.45%.
The EE and DLC of the six batches of samples (SCE–PSI–HAP) with a 100-fold higher drug mass were measured. As shown in Table 4, after 100-fold formulation amplification, the EE and DLC of the PSI–HAP prepared using MEM were about 21% and 20%, respectively. Meanwhile, the EE and DLC of the PSI–HAP prepared using LPR were about 28% and 14%, respectively.
| Batches | MEM | LPR | ||
|---|---|---|---|---|
| EE, % | DLC, % | EE, % | DLC, % | |
| 1 | 21.06 | 20.05 | 27.09 | 13.63 |
| 2 | 22.39 | 21.05 | 28.08 | 14.04 |
| 3 | 21.26 | 20.20 | 27.49 | 13.80 |
| 4 | 21.72 | 20.55 | 28.28 | 14.14 |
| 5 | 19.59 | 18.92 | 30.35 | 15.02 |
| 6 | 21.13 | 20.11 | 28.75 | 14.35 |
![[X with combining macron]](https://www.rsc.org/images/entities/i_char_0058_0304.gif) ± SD ± SD |
21.19 ± 0.93 | 20.15 ± 0.71 | 28.34 ± 1.15 | 14.16 ± 0.49 |
3.6. Pharmaceutical properties of PSI–HAPs prepared using MEM and LPR with SCE as the model drug
3.7. Drug-loading abilities of PSI–HAP prepared using MEM for drugs with different dissolution and absorption properties
![[thin space (1/6-em)]](https://www.rsc.org/images/entities/char_2009.gif) :
:![[thin space (1/6-em)]](https://www.rsc.org/images/entities/char_2009.gif) mHAP were usually conducive to drug loading in PSI–HAP.
mHAP were usually conducive to drug loading in PSI–HAP.
| Formulations | Drug | |||
|---|---|---|---|---|
| Matrine | ITZ | Atenolol | KPF | |
| C Drug (mg mL−1) | 24.11 | 10 | 25.57 | 30 |
| C HAP (mg mL−1) | 5 | 1 | 1 | 10 |
m
PSI![[thin space (1/6-em)]](https://www.rsc.org/images/entities/char_2009.gif) : :![[thin space (1/6-em)]](https://www.rsc.org/images/entities/char_2009.gif) mHAP mHAP |
3.61 | 3 | 5 | 3 |
The characteristics of the PSI–HAP preparations fabricated using the formulations optimized by the BBD are shown in Table 5. The best EE and DLC were observed for ITZ–PSI–HAP, and it could reach nearly 50% (Table 6).
| Batches | Matrine | ITZ | Atenolol | KPF | ||||
|---|---|---|---|---|---|---|---|---|
| EE, % | DLC, % | EE, % | DLC, % | EE, % | DLC, % | EE, % | DLC, % | |
| 1 | 46.62 | 32.82 | 49.30 | 55.21 | 17.57 | 42.26 | 21.92 | 14.12 |
| 2 | 49.51 | 33.97 | 49.06 | 53.54 | 19.20 | 44.13 | 23.46 | 14.92 |
| 3 | 45.11 | 31.91 | 46.42 | 53.72 | 18.54 | 42.78 | 21.10 | 13.65 |
| 4 | 49.26 | 33.94 | 47.11 | 53.36 | 18.60 | 43.45 | 24.75 | 15.59 |
| 5 | 49.03 | 33.75 | 48.03 | 53.35 | 17.18 | 41.32 | 22.96 | 14.77 |
| 6 | 48.73 | 33.61 | 45.29 | 51.88 | 17.37 | 41.58 | 21.41 | 13.86 |
![[X with combining macron]](https://www.rsc.org/images/entities/i_char_0058_0304.gif) ± SD ± SD |
48.04 ± 1.77 | 33.33 ± 0.81 | 47.54 ± 1.56 | 53.51 ± 1.06 | 18.08 ± 0.81 | 42.59 ± 1.08 | 22.60 ± 1.39 | 14.49 ± 0.74 |
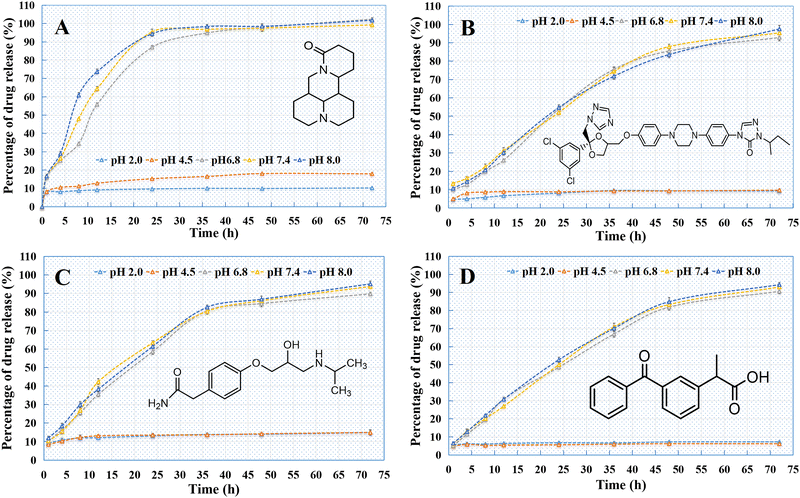 | ||
| Fig. 14 Release curves of different PSI–HAP preparations ((A) matrine; (B) ITZ; (C) atenolol; (D) KPF). | ||
The preparation of PSI–HAP is very simple and requires mild conditions. It also has a certain degree of ambiguity (the mass ratio of PSI coating and HAP is within a certain range of excipient concentrations; thus, there is a low degree of operator accuracy and a wide tolerance for different preparation conditions). Compared with other reported nano DDSs, PSI–HAP or X–PSI–HAP (PSI derivatives, where X is a molecular group with different in vivo functions; e.g., PEG, antibody, ligand, temperature sensitive, pH sensitive or other functional molecular groups) possess several advantages: (1) HAP has a good drug adsorption capacity, but nano HAP particles can easily aggregate into clusters. Meanwhile, the drugs adsorbed on the HAP surface often show burst release. However, after PSI or X–PSI coating on HAP, the aggregation of HAP particles and the burst release of drugs can be avoided. (2) The preparation of PSI–HAP or X–PSI–HAP is very simple and stable, and no complex or expensive instruments or equipment are required. Only two kinds of excipients (PSI or X–PSI and HAP) are required for the preparation, and uniform nanoparticles can form very quickly after the two excipients are mixed in a solution under stirring and ultrasound treatment. (3) Modification of the PSI coating (X–PSI) can also provide the DDS with different targeting properties. X–PSI can be derived very easily by mixing PSI and X functional groups containing the –NH2 end-group, without any catalytic agent or other reagent in the solution. In addition, PSI and its derivatives as well as HAP can be degraded and absorbed in vivo, making PSI–HAP suitable for multiple routes of administration, including oral administration, implants, inhalation, and injection. The proposed DDS is especially suitable as a novel carrier for proteins and anti-tumor drugs from a design perspective. Moreover, it can potentially be used for loading nucleic acid drugs, providing a new delivery route for these agents.
The synthesis of the excipients PSI and HAP is quite simple and inexpensive compared with currently available nanodrug delivery systems (e.g., lipids, emulsions, and solid lipid nanoparticles), and the excipients can be sterilized via high-temperature heating during the synthesis process. HAP can be synthesized from inorganic salts containing only Ca and P. The synthesis of PSI is a one-step reaction, and no impurities are produced during the entire process. Neither the synthesis of excipients nor the production of formulations requires complex equipment or harsh process conditions. Hence, this process is extremely conducive for practical production and is expected to solve the current problem of the difficulty in producing and transforming drug nano-delivery systems. As a novel drug carrier, the research on PSI–HAP drug delivery systems remains in the preliminary stage. More in-depth studies and continuous improvements in drug loading, pharmacodynamics, and safety are required in the future.
4. Conclusions
A novel nano-sustained-release DDS PSI–HAP was prepared in this study. The proposed preparation has a HAP core–PSI coating structure. When polymeric organic compounds (e.g., polylysine, chitosan, and hyaluronic acid) are used as coating agents for HAP nanoparticles, they do not possess the nanoparticle-forming properties of PSI and HAP. The easy modification of PSI provides more variability to the PSI–HAP drug delivery system, and after its modification using specific directional molecules, an active targeted drug delivery system with varied tissue- and cell-targeting capabilities can be obtained, thus enabling more accurate drug delivery performance. The PSI–HAP delivery system has a better DLC and is easier to sterilize and produce at scale. It can be used to design and prepare novel functional DDSs at a lower cost. In particular, both PSI and HAP nanoparticles exert antitumor effects and can be used to load gene drugs (e.g., nucleic acids and proteins) and could be suitable for the delivery of genes and anti-tumor drugs in vivo.Author contributions
Fengbo Yu: conceptualization, investigation, formal analysis, data curation, funding acquisition, writing – original draft; Qiang Wang: conceptualization, investigation, data curation; Dan Liu: investigation, data curation; Xingjun Fan: investigation, data curation; Lei Tong: investigation, data curation, funding acquisition; Guangzhi Shen: investigation, data curation; Fengguo Zhai: conceptualization, formal analysis, writing – review & editing.Data availability
The data that support the findings of this study are available from the corresponding author upon reasonable request.Conflicts of interest
There are no conflicts to declare.Acknowledgements
This work was supported by the China Postdoctoral Science Foundation [grant number 2021M692734]; the Project of Administration of Traditional Chinese Medicine of Guangdong Province of China [grant number 20221447]; the Fundamental Research Funds for Universities in Heilongjiang Province [grant number 2019-KYYWFMY-0003]; and the Natural Science Foundation of Heilongjiang Province [grant number SS2021H004]; and the Graduate supervisor's research project of Mudanjiang Medical University [grant number YJSZX2022164].References
- S. Köse, B. Kankilic, M. Gizer, E. C. Dede, E. Bayramli, P. Korkusuz and F. Korkusuz, Stem cell and advanced nano bioceramic interactions, Adv. Exp. Med. Biol., 2018, 1077, 317–342 CrossRef PubMed.
- R.-X. Shao, R.-F. Quan, L. Zhang, X.-C. Wei, D.-S. Yang and S.-J. Xie, Porous hydroxyapatite bioceramics in bone tissue engineering: current uses and perspectives, J. Ceram. Soc. Jpn., 2015, 123, 17–20 CrossRef.
- G. Calabrese, S. Petralia, D. Franco, G. Nocito, C. Fabbi, L. Forte, S. Guglielmino, S. Squarzoni, F. Traina and S. Conoci, A New Ag-Nanostructured Hydroxyapatite Porous Scaffold: Antibacterial Effect and Cytotoxicity Study, Mater. Sci. Eng., C, 2020, 118, 111394 CrossRef PubMed.
- R. Sato, T. Arita, R. Shimada, T. Nohara, K. Tabata, K. Koseki, K. Umemoto and A. Masuhara, Biocompatible composite of cellulose nanocrystal and hydroxyapatite with large mechanical strength, Cellulose, 2021, 28, 871–879 CrossRef CAS.
- Z.-W. Liang, H.-L. Wang, B.-F. Guo, F.-B. Li, J.-S. Liu, Z.-W. Liu, L.-B. Xu, W.-J. Yun, X.-J. Zhao and L. Zhang, Inhibition of prostate cancer RM1 cell growth in vitro by hydroxyapatite nanoparticledelivered short hairpin RNAs against Stat3, Mol. Med. Rep., 2017, 16, 459–465 CrossRef CAS PubMed.
- K. Balagangadharan, S. Viji Chandran, B. Arumugam, S. Saravanan, G. Devanand Venkatasubbu and N. Selvamurugan, Chitosan/nano-hydroxyapatite/nano-zirconium dioxide scaffolds with miR-590-5p for bone regeneration, Int. J. Biol. Macromol., 2018, 111, 953–958 CrossRef CAS PubMed.
- Y. Luo, Y. Ling, W.-S. Guo, J. Pang, W.-P. Liu, Y.-Q. Fang, X.-Q. Wen, K. Wei and X. Gao, Docetaxel loaded oleic acid-coated hydroxyapatite nanoparticles enhance the docetaxel-induced apoptosis through activation of caspase-2 in androgen independent prostate cancer cells, J. Controlled Release, 2010, 147, 278–288 CrossRef CAS PubMed.
- J. Velazco-de-la-Garza, L. Avérous, G. de Jesús Sosa-Santillán, E. Pollet, A. Zugasti-Cruz, C. A. Sierra-Rivera, N. V. Pérez-Aguilar and E. Oyervides-Muñoz, Biological properties of novel polysuccinimide derivatives synthesized via quaternary ammonium grafting, Eur. Polym. J., 2020, 131, 109705 CrossRef CAS.
- E. Jalalvandi and A. Shavandi, Polysuccinimide and its derivatives: Degradable and water soluble polymers (review), Eur. Polym. J., 2018, 109, 43–54 CrossRef CAS.
- J. Vega-Chacón, M. I. A. Arbeláez, J. H. Jorge, R. F. C. Marques and M. Jafelicci Jr, pH-responsive poly(aspartic acid) hydrogel-coated magnetite nanoparticles for biomedical applications, Mater. Sci. Eng., C, 2017, 77, 366–373 CrossRef PubMed.
- C. Gong, C.-C. Lu, B.-Q. Li, M. Shan and G.-L. Wu, Injectable Dopamine-Modified Poly(α,β-aspartic acid) Nanocomposite Hydrogel as Bioadhesive Drug Delivery System, J. Biomed. Mater. Res., Part A, 2017, 105, 1000–1008 CrossRef CAS PubMed.
- M. Kim and C.-Y. Cha, Graft Architecture Guided Simultaneous Control of Degradation and Mechanical Properties of In Situ Forming and Fast Dissolving Polyaspartamide Hydrogels, Biomacromolecules, 2020, 3693–3703 CrossRef CAS PubMed.
- Q. D. Dang, J. H. Park, S. H. Bhang and J.-H. Kim, Synthesis and characterization of novel multi-hydroxy polyaspartamide derivative and its crosslinked hydrogels, React. Funct. Polym., 2019, 147, 104455 CrossRef.
- J. Vega-Chacón, R. D. Piazza, R. C. Marques, A. Elaissari and M. Jafelicci Jr, The influence of pH, hydrolysis and degree of substitution on the temperature-sensitive properties of polyaspartamides, Polym. Int., 2019, 68, 88–93 CrossRef.
- D.-P. Zhao, B.-Q. Li, J.-M. Han, Y. Yang, X.-Chn Zhang and G.-L. Wu, pH responsive polypeptide based polymeric micelles for anticancer drug delivery, J. Biomed. Mater. Res., Part A, 2015, 103, 3045–3053 CrossRef CAS PubMed.
- N. Liu, J.-M. Han, X.-Ch Zhang, Y. Yang, Y. Liu, Y.-M. Wang and G.-L. Wu, pH-responsive zwitterionic polypeptide as a platform for anti-tumor drug delivery, Colloids Surf., B, 2016, 145, 401–409 CrossRef CAS PubMed.
- T. T. Le and D. Kim, Folate-PEG/Hyd-curcumin/C18-g-PSI micelles for site specific delivery of curcumin to colon cancer cells via Wnt/β-catenin signaling pathway, Mater. Sci. Eng., C, 2019, 101, 464–471 CrossRef CAS PubMed.
- N. B. Tran, J. Y. Kim, Y.-C. Kim, Y. J. Kim and J.-H. Kim, CO2-responsive swelling behavior and metal-ion adsorption properties in novel histamine-conjugated polyaspartamide hydrogel, J. Appl. Polym. Sci., 2016, 133, 43305 CrossRef.
- L. A. Ostrovskaya, D. B. Korman, S. D. Varfolomeev, V. A. Goldberg, M. M. Fomina, N. V. Bluhterova and V. A. Rikova, Polysuccinimide: Experimental antitumor activity, Biophysics, 2015, 60, 298–302 CrossRef CAS.
- M. Mansha, A. Waheed, T. Ahmad, I. W. Kazi and N. Ullah, Synthesis of a novel polysuccinimide based resin for the ultrahigh removal of anionic azo dyes from aqueous solution, Environ. Res., 2020, 184, 109337 CrossRef CAS PubMed.
- Y. Zhang, H.-Q. Yin, Q.-S. Zhang, Y.-Z. Li and P.-J. Yao, Synthesis and characterization of novel polyaspartic acid/urea graft copolymer with acylamino group and its scale inhibition performance, Desalination, 2016, 395, 92–98 CrossRef CAS.
- Z.-L. Shen, X. Zhi and P.-Y. Zhang, Preparation of fluorescent polyaspartic acid and evaluation of its scale inhibition for CaCO3 and CaSO4, Polym. Adv. Technol., 2016, 28, 367–372 CrossRef.
- F.-B. Yu, H.-Y. Wang, Q. Wang, F.-G. Zhai, J.-H. Wang, C.-M. Huang and L. Chui, Studies of a novel bone-targeted nano drug delivery system with a HAP core-PSI coating structure for tanshinol injection, J. Drug Targeting, 2023, 31(7), 762–775 CrossRef CAS PubMed.
- Y.-L. Wang, Y. Ning and Y. Ding, Research Progress on Chemical Constituents and Pharmacological Action of Schisandra chinensis, Inf. Tradit. Chin. Med., 2023, 40(7), 82–85 Search PubMed.
- X.-Y. Zou, Y.-B. Zhao and Z.-J. Zhang, Progress in the synthesis method of hydroxyapatite, Chem. Res., 2019, 30(04), 404–410 Search PubMed.
- J.-Q. Huang, W.-S. Zheng, C.-Y. Yan, S.-H. Sun, J.-X. Hou and Z.-Y. Zhao, Research progress in preparation methods of nano hydroxyapatite, Petrochem. Ind. Technol., 2019, 26(09), 352–354 CAS.
- B.-H. Chen, K.-I. Chen, M.-L. Ho, H.-N. Chen, W.-C. Chen and C.-K. Wang, Synthesis of calcium phosphates and porous hydroxyapatite beads prepared by emulsion method, Mater. Chem. Phys., 2009, 113(1), 365–371 CrossRef CAS.
- G. K. Lim, J. Wang, S. C. Ng, C. H. Chew and L.-M. Gan, Processing of hydroxyapatite via microemulsion and emulsion routes, Biomaterials, 1997, 18(21), 1433–1439 CrossRef CAS PubMed.
- K. Sonoda, T. Furuzono, D. Walsh, K. Sato and J. Tanaka, Influence of emulsion on crystal growth of hydroxyapatite, Solid State Ionics, 2002, 151, 321–327 CrossRef CAS.
- T. Yoshitomo, H. Kazuaki, S. Muneteru and A. Kiminori, Preparation of spherical hydroxyapatite by liquid phase reaction, JP19950323555[P], JPH09142816A.
- Y. Liu, D. Hou and G. Wang, A simple wet chemical synthesis and characterization of hydroxyapatite nanorods, Mater. Chem. Phys., 2004, 86(1), 69–73 CrossRef CAS.
- Y. Wang, S. Zhang and K. Wei, Hydrothermal synthesis of hydroxyapatite nanopowders using cationic surfactant as a template, Mater. Lett., 2006, 60(12), 1484–1487 CrossRef CAS.
- Y.-J. Guo, Y.-Y. Wang, T. Chen, Y.-T. Wei, L.-F. Chu and Y.-P. Guo, Hollow carbonated hydroxyapatite microspheres with mesoporous structure: Hydrothermal fabrication and drug delivery property, Mater. Sci. Eng., C, 2013, 33, 3166–3172 CrossRef CAS PubMed.
- W. Xiao, H. Fu and M. N. Rahaman, Hollow hydroxyapatite microspheres: a novel bioactive and osteoconductive carrier for controlled release of bone morphogenetic rotein-2 in bone regeneration, Acta Biomater., 2013, 9, 8374–8383 CrossRef CAS PubMed.
- J. Yang, L. Fang and T.-W. Tan, Synthesis and Characterization of Superabsorbent Hydrogels Composites Based on Polysuccinimide, J. Appl. Polym. Sci., 2006, 102, 550–557 CrossRef CAS.
| This journal is © The Royal Society of Chemistry 2024 |

