 Open Access Article
Creative Commons Attribution 3.0 Unported Licence
Exploring crosslinker effects on fluorescent molecularly imprinted polymers for improved gefitinib delivery in lung cancer theranostics†
Marco
Dattilo
 a,
Marisa Francesca
Motta
 a,
Francesco
Patitucci
 a,
Claudia
Ferraro
a,
Ortensia Ilaria
Parisi
a,
Claudia
Ferraro
a,
Ortensia Ilaria
Parisi
 *ab and
Francesco
Puoci
 ab
ab
aDepartment of Pharmacy, Health and Nutritional Sciences, University of Calabria, 87036 Rende, CS, Italy. E-mail: ortensiailaria.parisi@unical.it
bMacrofarm s.r.l., c/o Department of Pharmacy, Health and Nutritional Sciences, University of Calabria, 87036 Rende, CS, Italy
First published on 27th June 2024
Abstract
Lung cancer, encompassing diverse subtypes, remains a leading cause of cancer-related mortality. The epidermal growth factor receptor (EGFR) is a key target, particularly in non-small-cell lung carcinoma (NSCLC) but challenges such as low solubility and resistance hinder effective treatment with gefitinib (GEF), an EGFR inhibitor. To address this, a novel theranostic system combining molecularly imprinted polymers (MIPs) with a fluorescent monomer was developed to provide controlled and sustained GEF release. A fluorescein-modified monomer endowed the material with diagnostic capabilities and two different compounds (ethylene glycol dimethacrylate and trimethylolpropane trimethacrylate) were tested as crosslinking agents. Particle characterization studies encompassed size, shape, protein adsorption, swelling behavior, and fluorescence. In vitro studies evaluated release kinetics, binding specificity, cytotoxicity, and hemolysis. The results demonstrated the selective binding and controlled release of GEF by imprinted particles, along with biocompatibility, showcasing their potential as a cancer medicine. This innovative approach holds promise for enhancing the efficacy and safety of EGFR-targeted therapy in NSCLC, mitigating the adverse effects associated with high doses and overcoming acquired resistance. Theranostic agents, by integrating diagnosis and therapy, can offer a multifaceted strategy in cancer management, underscoring the significance of this research in advancing precision medicine for lung cancer patients. Considering the heterogeneity of NSCLC, future studies could investigate the applicability of this approach across different molecular subtypes and patient populations to ensure broad clinical relevance and personalized treatment strategies.
1. Introduction
Cancer is reported as the leading cause of premature death worldwide, accounting for nearly 10 million deaths in 2020.1 Lung cancer, in particular, consists of a group of molecularly and histologically heterogeneous subtypes and is the most common cause of cancer death, accounting for nearly a quarter of all cancer fatalities. There are two major subtypes of lung cancer, small-cell lung carcinoma and non-small-cell lung carcinoma (NSCLC), representing 15% and 85% of all lung cancers, respectively.2 The epidermal growth factor receptor (EGFR) has emerged as a promising therapeutic target because of its overexpression in several tumors, including NSCLC. The EGFR family consists of four transmembrane receptor tyrosine kinases (RTKs): EGFR (HerB1), HER2/c-neu (ErbB2), HER3 (ErbB3), and HER4 (ErbB4). Ligand binding to EGFR implies a conformational change from an inactive monomer to an active homodimer or a heterodimer. The dimerization induces protein-tyrosine kinase activation, resulting in a downstream signaling cascade, which ultimately leads to DNA synthesis, cellular proliferation, motility, adhesion, and invasion.3,4 Protein kinase activation by somatic mutations of EGFR is a common tumorigenesis mechanism and its inhibition represents a valid anticancer therapeutic technique.5Conventional cancer treatments show limitations associated with the non-selectivity of cytotoxic drugs, their narrow therapeutic indices and limited cellular penetration. A possible approach to overcome these drawbacks is the development of innovative therapeutic strategies involving the use of tumor-targeted nanodevices able to promote specific drug accumulation at the pathological site, but also able to act as diagnostic molecular imaging agents. Theranostics is an innovative treatment approach based on the fusion of diagnostic and therapeutic technologies.6 Theranostic agents are characterized by the presence of diagnostic and therapeutic functions within a single system that enables both diagnosis and targeted therapy at the same time, but also the monitoring of the therapeutic response to the treatment, increasing drug efficacy and safety.
Based on these considerations, the aim of this work was the development of a novel theranostic system, which combines the drug-controlled release ability of molecularly imprinted polymers (MIPs) with the detection properties of a fluorescent monomer.
Molecular imprinting represents a very promising technology for the synthesis of polymeric matrices characterized by specific recognition capabilities for a desired template molecule.7 It consists of the polymerization of different monomers in the presence of a target molecule and the formation of sites that are complementary to the template molecule. The obtained system will be able to specifically recognize its target with an affinity similar to the one between an antibody and its antigen. In molecular imprinting technology (MIT), templates can be designed for a variety of target molecules, ranging from small drugs8 to peptides9 and even viruses.10
Moreover, MIPs have several advantages, such as the possibility of drug protection, reduced toxicity, controlled release, and widespread distribution and have been broadly used to target different membrane receptors overexpressed in cancer cells.11
The selection of the best monomers and crosslinkers represent a key event for the polymer synthesis: monomers dictate the polymer's functional groups and its ability to interact with specific molecules, while the crosslinking agents provide the backbone, the stability that holds the whole product together. We previously developed a sunitinib12 imprinted polymer as a theranostic platform for simultaneous diagnosis and guided therapy. The polymer was synthesized using precipitation polymerization and then grafted with rhodamine 6G as a fluorescent marker. The obtained material did not only act as a drug carrier, but also allowed the real-time polymer distribution and accumulation via fluorescence imaging.13
In this work, an EGFR tyrosine kinase inhibitor (TKI), gefitinib (GEF), was used as the template molecule. EGFR TKIs are small molecules able to bind the cytoplasmic domain of the receptor and inhibit its autophosphorylation, thus preventing receptor activation and signal transduction.14 GEF is a first-generation EGFR TKI and represents the first example of molecularly targeted agent for the treatment of NSCLCs. As a single agent and in combination with various chemotherapy agents, GEF has shown anticancer activity, inhibiting growth in a variety of NSCLC cell lines and resulting in favorable clinical outcomes and improved patient's quality of life. On the other hand, this drug has a poor water solubility and a high affinity for human plasma proteins, and it is widely metabolized in the liver. Overall, these factors contribute together to reduce its bioavailability requiring a dose increase and limiting the therapeutic window.15 The use of a high dose leads to the onset of relevant side effects during the treatment, such as skin toxicity, transient transaminitis, nausea, other than interstitial lung pneumonitis and hematuria, due to the interactions between the drug and healthy tissues.16 Additionally, similar to the pattern observed with other anti-cancer drugs, NSCLC cells inevitably develop resistance to EGFR-TKIs in about one-third of patients over a period of 9 to 13 months.17
To minimize systemic toxicities, increase the therapeutic effect and slow down the development of resistance, tumor-specific drug delivery systems able to deliver chemotherapeutic agents to tumor target sites have been developed. Sherif et al. designed GEF-loaded nanostructured lipid carriers (NLC) using stearic acid as a solid lipid and three different types of liquid oils. The combined system of stearic acid and long-chain fatty acids exhibited a sustained release profile of GEF, avoiding its release within the gastrointestinal tract and thus delaying its cytotoxic effects.18 In another study, GEF was embedded in a nanoliposome to improve water solubility and biocompatibility. A thin-film dispersion method was used for the nanoliposome synthesis using different ratios of lecithin and cholesterol. Spherical nanoparticles (NPs) with good dispersion and no agglomeration were obtained and the effect on A549 lung cancer cells was evaluated. The liposomal formulation showed an improved inhibiting effect on cancer cell proliferation, migration, and invasion compared to pure GEF and in vivo studies on mice tumor models further confirmed the enhanced treatment rate.19 Polyethylene glycol-block-poly (D, L-lactic acid) (PEG-PLA) polymeric NPs were synthesized for the simultaneous delivery of GEF and cyclosporin A (CsA) to overcome multidrug resistance (MDR). A nanoprecipitation procedure was used to entrap the two drugs in the matrix. CsA was able to sensitize GEF-resistant NSCLC cells to GEF and the cytotoxic synergy of both chemotherapeutics enhanced the apoptotic effect of the formulation.20
In the aim to overcome the drawbacks associated with this therapeutic agent, the main purpose of this study was the development of a dual-purpose MIP consisting of GEF as the template molecule and fluorescein O-methacrylate (FM) as a fluorescent comonomer for both diagnosis and drug delivery, evaluating the most advantageous conditions such as the type and the amount of the crosslinker. Ethylene glycol dimethacrylate (EGDMA) and trimethylolpropane trimethacrylate (TRIM) have been used to obtain particles imprinted with GEF and a precipitation polymerization was employed for the synthesis of the MIP using the non-covalent approach. The polymeric material was characterized in terms of size, swelling behavior, fluorescent properties, and non-specific adsorption of proteins. In vitro release studies as well as rebinding experiments at different times and concentrations in the presence of the template molecule and a structural analogue have been carried out. The obtained results confirmed the ability of the imprinted material to bind in a specific and selective way the targeted molecule and to provide a controlled release, therefore representing a promising tool for cancer medicine.
2. Materials and methods
2.1. Materials
Methacrylic acid (MAA), ethylene glycol dimethacrylate (EGDMA), trimethylolpropane trimethacrylate (TRIM), fluorescein O-methacrylate (FM), 2,2′-azobisisobutyronitrile (AIBN), gefitinib (GEF), vandetanib (VAN), bovine serum albumin (BSA), and 1-(4,5-dimethylthiazol-2-yl)-3,5-diphenyltetrazolium (MTT) were purchased from Sigma-Aldrich s.r.l. (Milan, Italy).Methacrylic acid was purified before use on an alumina column by a single-step passage, while AIBN was recrystallized from methanol to give colorless needles. All solvents were reagent or HPLC grade and obtained from VWR (Milan, Italy). Dialysis membranes (molecular weight cut-off, MWCO: 3500 Da) were used for the in vitro release studies and were supplied by Medicell International Ltd (London, UK).
Dulbecco's Modified Eagle's Medium (DMEM) and F-12K medium were purchased from the American Type Culture Collection (ATCC, Manassas, VA, USA).
2.2. Cell cultures
BALB/3T3 cells were purchased from the American Type Culture Collection (ATCC, Manassas, VA, USA) and maintained in DMEM medium (containing 2 mM L-glutamine, 1% penicillin–streptomycin, and 1% sodium pyruvate 1 mM) supplemented with 10% bovine calf serum (BCS) at 37 °C in a humidified atmosphere consisting of 5% CO2 in air.A-549 cells were purchased from the American Type Culture Collection (ATCC, Manassas, VA, USA) and maintained in F-12K medium (containing 2 mM L-glutamine, and 1% penicillin–streptomycin) supplemented with 10% Fetal Bovine Serum (FBS) at 37 °C in a humidified atmosphere consisting of 5% CO2 in air.
2.3. Instrumentation
Absorption spectra were recorded with an Evolution 201 UV/Vis spectrometer (Thermo Fisher Scientific, Massachusetts, USA).Particle size distribution was determined by dynamic light scattering (DLS), using a Zetasizer (Nano-ZS, Malvern Instrument, UK), at 25.0 ± 0.1 °C. The autocorrelation function was measured at 90° and the laser was operating at 658 nm. The size distribution was obtained from the instrumental data fitting by the inverse “Laplace transformation” and Contin methods.21 The polydispersity index (PI) was used as a measure of the size distribution and a value less than 0.3 indicates a homogeneous population of particles.
The ξ-potential was measured using a zetasizer (Nano-ZS, Malvern Instrument, UK) at 25.0 ± 0.1 °C. ξ-potential values were calculated by the instrument software using the Helmholtz–Smoluchowski equation.
Particles size, ξ-potential and morphology were measured as previously described.13
The TEM micrographs were obtained using a Jeol transmission electron microscope, model JEM-1409Plus, operating at 80 kV power.
The fluorescence images of the prepared particles were obtained using a confocal microscope (FV3000, Olympus Corporation, Tokyo, Japan). Data acquisition and elaboration were performed with the Olympus cellSens Imaging Software Version 1.11.
pH-modulated fluorescence was investigated using a Synergy H1 spectrofluorometer (Hybrid Reader, BioTek,Winooski, VT, USA). The emission spectra (excitation at λex = 490 nm) of the fluorescent MIP as a function of the media pH were recorded using an aqueous dispersion of the polymeric particles (0.5 mg mL−1) at different pH values.
The calorimetric examinations were conducted employing a DSC200 PC differential scanning calorimeter (Netzsch, Selb, Germany). Following a standard protocol, approximately 10.0 mg of the desiccated sample was placed in an aluminum pan and securely sealed with an aluminum lid. Thermal analyses were executed within the temperature range of 30 to 400 °C, employing a heating rate of 10 °C min−1.
2.4. Synthesis of the gefitinib-imprinted polymers (GEF-MIPs)
MAA and AIBN were selected as functional monomer and initiator, respectively, while EGDMA and TRIM were used as crosslinkers separately or in combination with each other. FM was used as pH-sensitive fluorescent monomer with an excitation spectrum centered at λ = 490 nm and an emission spectrum centered at λ = 520 nm.The polymers were synthetized by precipitation polymerization starting from a homogeneous mixture of monomers, initiator, and optional solvent: briefly, 0.5 mmol of the template molecule and 4 mmol of MAA were dissolved in 40 mL of acetonitrile in a 200 mL glass bottle. The obtained solutions were stirred for one hour to promote the functional monomer–template complex formation. Then, the crosslinker, the fluorescent monomer, and AIBN were added to the solutions and the mixtures were then purged with nitrogen for five minutes. Monomer mixtures are reported in Table 1. The flasks were rotated at 20 rpm during the polymerization reaction, which was carried out at 60 °C for 24 h. The polymers were collected by centrifugation, and the template molecules were removed by washing with an acetic acid/methanol mixture (1![[thin space (1/6-em)]](https://www.rsc.org/images/entities/char_2009.gif) :
:![[thin space (1/6-em)]](https://www.rsc.org/images/entities/char_2009.gif) 9 v/v). MIPs were then rinsed three times with methanol, acetone, and diethyl ether and dried under vacuum overnight. MIPs were checked to be free of GEF and any other compound by UV/Vis analysis.
9 v/v). MIPs were then rinsed three times with methanol, acetone, and diethyl ether and dried under vacuum overnight. MIPs were checked to be free of GEF and any other compound by UV/Vis analysis.
| Polymer | GEF (mmol) | MAA (mmol) | EGDMA (mmol) | TRIM (mmol) | FM (mmol) |
|---|---|---|---|---|---|
| MIP1 | 0.5 | 4 | 10 | — | 0.15 |
| NIP1 | — | 4 | 10 | — | 0.15 |
| MIP2 | 0.5 | 4 | — | 10 | 0.15 |
| NIP2 | — | 4 | — | 10 | 0.15 |
| MIP3 | 0.5 | 4 | 5 | 5 | 0.15 |
| NIP3 | — | 4 | 5 | 5 | 0.15 |
Under the same conditions, non-imprinted polymers (NIPs) were prepared without the addition of the template.
2.5. Protein adsorption measurement and swelling behavior
Protein adsorption experiments and swelling studies were carried out according to the experimental protocols reported in a previous work13 with some modifications.The non-specific adsorption of protein was evaluated using bovine serum albumin as the protein model. 50 mg of both imprinted and non-imprinted particles were dispersed in a BSA standard solution (5 mg mL−1) in PBS (10−3 M, pH 7.4) and incubated for 2 h. After centrifugation (6500 rpm, 10 min), the supernatant was collected and analyzed using the Bradford Protein Assay. Briefly, 20 μL of the sample supernatant or BSA standard have been added to a cuvette containing 980 μL of distilled water. Then, 1 mL of Bradford reagent has been added to each cuvette and mixed well by inverting the cuvette several times. After a 5 minute incubation at room temperature, the absorbance of the samples and standard has been measured at 595 nm using a spectrophotometer.
A calibration curve was created by first preparing a set of standard solutions with known concentrations of BSA (0.1, 0.3, 0.5, 0.7 and 1.0 mg mL−1) in PBS.
The amount of adsorbed BSA was expressed as percentage and calculated according to the following eqn (1):
 | (1) |
The swelling characteristics of polymers were determined as previously described.22 Briefly, 50 mg of dried MIP and NIP have been weighted in a tared 5-mL sintered glass filter, and leaving it to swell by soaking the filter in phosphate buffer (pH 7.4, simulating biological fluid) for 72 h. At predetermined times (1, 2, 3, 4, 5, 24, 48 and 72 h), the excess water was removed by percolation at atmospheric pressure and the filter was centrifuged at 2000 rpm for 5 min and then weighted. The filter tare was measured after centrifugation with only water.
The water content percentage (WR%) was calculated according to eqn (2):
 | (2) |
Each experiment was carried out in triplicate.
2.6. Binding experiments
To evaluate molecular recognition abilities of the imprinted materials, binding experiments have been carried out.10 mg of MIPs and NIPs were mixed with GEF standard solutions (2 mL prepared in an Eppendorf tube) in the concentration range of 0.00004–0.001 M for 24 h. After incubation, each tube was centrifuged at 9000 rpm for 10 min and the supernatants were collected and analyzed by UV/Vis analysis at 249 nm using the equation obtained from the calibration curve of the drug. To further evaluate the selectivity of the obtained material, the same experiments were conducted in the presence of vandetanib (VAN), a structural analogue of GEF.
Adsorption kinetics were studied by mixing together MIPs/NIPs (10 mg) with 2 mL of a GEF standard solution (0.00015 M in acetonitrile) and the amount of unbound GEF was monitored at different time intervals (1, 2, 4, 6, 8 and 24 h) via UV/Vis analysis at 249 nm using the equation obtained from the calibration curve of the drug. The data obtained by both MIP and NIP experiments were then compared.
The binding experiments were repeated in triplicate.
2.7. Drug loading procedure and in vitro release studies
For the release studies, polymeric particles were first loaded with GEF, as previously described.23In brief, 10 mg of GEF were weighted in a 10 mL round bottom flask and solubilized in ethanol, and thus sonicated in an ultrasonic bath for 10 min. 90 mg of MIP1/NIP1 were then introduced in the flask and mixed at room temperature for 3 days. In the end, the loaded polymers were collected by percolation and dried under vacuum. The supernatants were analyzed to evaluate the drug loading content (DLC) and the drug loading efficiency24 using UV/Vis spectroscopy. The measured absorbances corresponded to the amounts of unbound GEF to the polymeric matrix, and expressed as percentages according to the eqn (3) and (4):
 | (3) |
 | (4) |
GEF-loaded particles were then tested to evaluate the in vitro release properties.25 20 mg of GEF-loaded MIP1/NIP1 were immersed in 1 mL of PBS (10−3 M, pH 5) in a dialysis membrane with MWCO 12–14 kDa. Samples were transferred into glass vials containing 15 mL of PBS and incubated at 37 ± 0.5 °C for 72 h. The drug release profile was assessed by withdrawing 3 mL of the medium at selected time intervals (1, 2, 3, 4, 6, 24 and 48 h) and by replacing the same volume with fresh PBS. Collected samples were analyzed by using a UV/Vis spectrophotometer and the amount of released GEF was calculated using the equation obtained from the calibration curve of the drug.
2.8. Cytotoxicity test
The cytotoxic effect of the particles was evaluated by using a 1-(4,5-dimethylthiazol-2-yl)-3,5-diphenyltetrazolium (MTT) assay.Cells were seeded in a 48-well plate (full media) and allowed to attach for 24 hours. BALB-3T3 cells were then incubated with different concentrations of MIP1 and NIP1 to estimate the cytotoxicity of the carriers, while A-549 cells were incubated with the vehicle (PBS), GEF, MIP1, and GEF-loaded MIP1 and NIP1 at the GEF concentration of 125 μM to measure the percentage of cell viability during 72 h. At the end of the experiments, 200 μL of MTT stock solution (2 mg mL−1) in PBS were added into each well and incubated for 3 hours at 37 °C. The solution in each well was removed and replaced with 200 μL of DMSO. The plate was kept for shaking for 15 min and the optical density was measured at 570 nm using a Beckman Coulter microplate reader. The results were expressed as percentage cell viability, assuming a viability of control cells as 100%. The experiments were performed in triplicate and standard deviations are shown as error bars.
2.9. Cellular uptake study
In four-well plates, A549 cells were plated with 2 × 10⁵ cells per well and left to grow overnight.The following day, the medium was replaced with the MIP1 particle suspension (10 μg mL−1), and the plate was incubated for 24 h. At the end of the experiment, the cover slips were washed four times with fresh pre-warmed PBS to eliminate excess particles that had not been internalized. The coverslips with cells on their surfaces were placed onto microscope slides that had been previously washed with 70% ethanol, and the internalization of imprinted NPs was evaluated by using a confocal microscope. Wavelengths of 490 nm (λexc) and 520 nm (λemiss) were set for FoM imaging.
In another experiment, to evaluate the drug uptake, the cells were treated with GEF alone and MIP1-GEF at a set concentration of GEF (60 uM) for a duration of 3 hours. Subsequent to this exposure time, the cells were collected and rinsed three times with PBS. The cellular uptake of GEF was then examined using fluorescence microscopy. For imaging of GEF, 345 and 450 nm were used as excitation and emission wavelengths, respectively.
2.10. Statistical analysis
In vitro data were analyzed by Student's t-test using the GraphPad Prism 8.3.0 (GraphPadSoftware, Inc., San Diego, CA, USA). p < 0.05 was considered statistically significant.3. Results and discussion
3.1. Synthesis of gefitinib imprinted polymers and their characterization
Imprinted polymeric particles were developed using the non-covalent approach, based on the formation of weak interactions, such as hydrogen, dipole–dipole, and ionic bonds, between the template molecule and the monomers (Fig. S1, ESI†). Precipitation polymerization offered an efficient way to control the size and the porosity of the spherical particles by adjusting different reaction conditions.26The polymerization mixture consisted of a monomer, a cross-linker, an initiator and a porogen solvent. The choice of the best monomer represents a crucial step in this technique, because it is the main reason for the interaction with the template molecule and it is usually selected by molecular docking studies or screening of the non-imprinted polymer library.27 MAA was chosen as the functional monomer able to form hydrogen bonds because of the presence of the carboxylic group, while EGDMA and TRIM were selected as crosslinkers to confer rigidity on the matrix and contributed to maintaining the specific cavities for the template, even after its removal.28 Moreover, EGDMA and TRIM have been proved to be highly compatible with biological systems and, thus, more suitable compared to other crosslinkers.29 The radical polymerization process took place because of AIBN decomposition at temperatures above 60 °C, providing a radical species which then carried out the desired radical reaction.30 At the end of the polymerization, to discard unreacted monomers and to allow the complete removal of the template, the polymeric matrices have been subjected to several washing cycles with different solvents. As a result, monodisperse MIP particles crosslinked with EGDMA and TRIM and imprinted with GEF have been obtained.
The presence of the fluorescent monomer in the structure made possible to capture images of the polymeric particles by confocal microscopy (Fig. S1A, ESI†). The acquired pictures confirmed the detection ability of the particles. Moreover, the fluorescent properties were studied using a spectrofluorometer and the emission spectra (excitation at 490 nm) of the polymer suspensions (0.5 mg mL−1) have been recorded at different pH values (Fig. S1B, ESI†).31 At a pH value of 10, the sample showed a higher signal intensity compared to samples at pH 4 and 6.
These results are driven by pH-dependent sensitivity of fluorescein, which presents a significantly greater fluorescent intensity at basic pH, as reported in the literature.32 Adding the FM monomer to the polymer allowed the incorporation of a fluorescence component, thereby enabling precise cellular-level imaging in controlled in vitro environments.
Moreover, the use of synthetic polymers as hosts for the dye fluorescein offers several advantages compared to liquid solutions of dyes. It does not require large volumes of organic solvents and the solid host provides compactness, manageability, and low toxicity. It does not need extensive dialysis to remove unreacted fluorescein, avoiding dye leakage from the final product.33
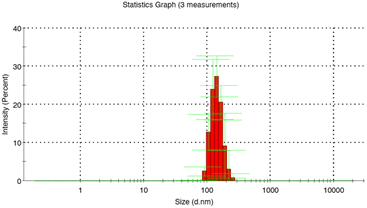
DLS analysis revealed an average diameter of 269.4 ± 72.9 nm and a polydispersity index of 0.039 for MIP1 with EGDMA, indicating smaller sizes compared to those with TRIM or with a combination of crosslinkers (Table S1, ESI†) (Fig. 1). Interestingly, the influence of the template on the growth mechanism of the MIP was not significant compared to NIP1 particles. A PI of below 0.3 validated the presence of a monodispersed system for the particles synthesized using EGDMA.
ξ-potential measurements were carried out to characterize the stability of the polymeric suspensions. The substantial zeta potential values provided strong evidence for the remarkable dispersion and stability of these particles in solution. Moreover, the negatively charged surface also plays a crucial role in promoting interactions between the particle and target cell membranes. This electrostatic feature can influence various aspects of cellular interactions and uptake.34
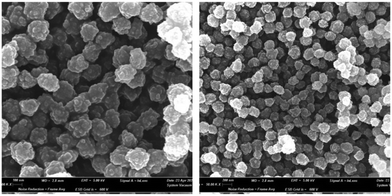
To ensure more consistent data, the particle size of MIP1 was determined by analyzing the SEM images. This revealed the particles’ spherical shape and smaller dimensions compared to DLS results. It's worth noting that SEM records the dry-state average diameter size, while DLS provides the hydrodynamic diameter, influenced by the swelling degree of the polymeric material (Fig. 2).
3.2. Hydrophilic properties
Hydrophilic properties of the material can affect the drug loading efficiency and stability during storage, as well as in vitro and in vivo performances.35 The physical characteristics of the MIPs were then examined in terms of non-specific adsorption of proteins and swelling behavior. Vroman's effect describes the process of competitive protein adsorption to a surface by blood serum proteins.36 Extensive non-specific adsorption of proteins on the polymeric matrix can hinder drug release, therefore reducing its bioavailability and representing a serious problem in biomedical applications. Human serum albumin (HSA) is known for non-specific binding to nanoparticles considering its ubiquity in the human serum. In this study, BSA was chosen as the protein model and its non-specific adsorption on the polymeric particles was observed to examine interactions between the prepared MIP/NIP and the proteins. The developed material showed a resistance against non-specific adsorption of proteins, obtaining percentages of 32.7 and 35.6 for MIP1 and NIP1 respectively, compatible with biological applications. In general, all the synthesized materials demonstrated minimal nonspecific adsorption of BSA, making them well-suited for biological applications (Table S2, ESI†).Swelling behavior is an important parameter in the pharmaceutical field for the development of new drug delivery systems and it is the increase of the particle volume when dispersed in a solution. The presence of one or more electronegative atoms in the polymer structure implies a charge asymmetry that promotes hydrogen bonding formation with water molecules.
A high water regain can have a negative effect on the quality of the cavities formed in the polymer matrix, as well as on the structure and physical and chemical properties.37 To this purpose, the swelling degree of MIPs and NIPs was analyzed using PBS (10−3 M, pH 7.4), mimicking biological fluid, for 72 h.
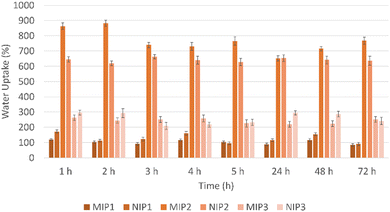
The data obtained, as shown in Fig. 3, indicates comparable swelling behavior between imprinted and non-imprinted particles. MIP1 and NIP1, in particular, exhibited good swelling properties, with swelling degrees of 84.26 ± 9.8% and 90.66 ± 10.9%, respectively. The high swelling capacity of these particles has been suggested to facilitate easier access for drug molecules to the recognition sites within the polymer matrix, potentially enhancing the binding capacities of the polymeric material. The substantial increase in swelling, with values of 767.28 ± 18.8% for MIP2 and 636.37 ± 23.6% for NIP2, suggests a considerable water absorption capacity and expansion of these particles. Nevertheless, the elevated swelling leads to larger particle sizes, as affirmed by the DLS results, compromising the overall performance and feasibility of the drug delivery system.
Discrepancies in thermal characteristics between the different polymers manifested in the DSC measurements. The thermograms (depicted in Fig. 4) delineated a first endothermic peak around 80 °C, reflective of the moisture vaporization process within the analyzed materials. The glass transition temperature in crosslinked systems demonstrated a nuanced dependence on the extent of crosslinking, resulting in a gradual upward shift as crosslinking intensified.
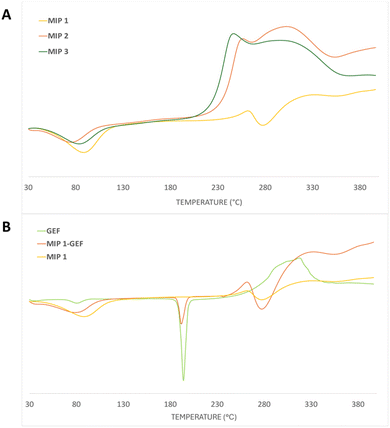 | ||
| Fig. 4 Differential scanning calorimetry (DSC) thermograms for (A) MIP1, MIP2 and MIP3 and (B) pure GEF, MIP1-GEF and MIP1. | ||
Despite this, the transition exhibited only marginal variations, attributable to the intrinsically low-density contrast of crosslinking. The primary mass loss for all the polymers was concentrated within the temperature range of approximately 245–290 °C, featuring a discernible endothermic process at around 250 °C, as elucidated by the DSC curves (Fig. 4A).
Importantly, it has been reported that porous polymers based on TRIM harbor a substantial quantity of unreacted double bonds,38 rendering them susceptible to both thermal polymerization and oxidation of these residual double bonds. This characteristic underscores the intricate thermal behavior of TRIM-containing polymer systems compared to the EGDMA-based sample. Overall, the polymers exhibited comparable thermal properties, with the exception of MIP1-GEF, which showcases an endothermic transition around 190 °C, which is attributed to the melting of the loaded GEF within the polymer (Fig. 4B).
3.3. Binding studies
These experiments enabled the determination of the binding capacity of both MIP and NIP, quantified by the equilibrium amount of bound GEF (Qe, mol g−1) using eqn (5):39
 | (5) |
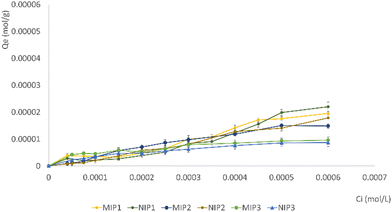
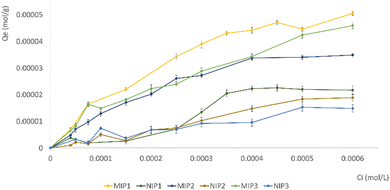
The adsorption isotherms of gefitinib on MIP and NIP particles were constructed by plotting Qe against Ci (Fig. 6). The results illustrated a notable distinction in the bound drug (%) among all synthesized MIPs and NIPs, indicating variations in the imprinting efficacy of the particles.
Following a 24-hour incubation period, it was observed that all MIPs exhibited a superior ability to bind a larger quantity of GEF in comparison to NIPs.
This observation validates the existence of specific cavities within MIPs that align in terms of size, shape, and chemical functionality with the template molecule. The NIPs typically feature functional groups arranged randomly on their surface, exhibiting a weaker interaction with the analyte when compared to the MIPs. The results suggest a successful molecular imprinting process, enhancing the selectivity and affinity of MIPs for GEF binding.
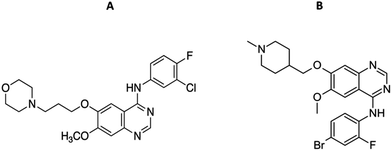
Subsequent experiments were conducted by introducing VAN, a structural analogue of GEF, to assess the cross-reactivity of MIPs (Fig. 7). The bonding of VAN to both MIP and NIP is likely attributed to nonspecific interactions. The inclusion of a structural analogue like VAN in the experiments provided valuable insights into the specificity of the molecularly imprinted materials.
The results affirmed the imprinting efficacy and selectivity of the imprinted materials, further strengthening the reliability of the findings.
Among the investigated materials, MIP1 exhibited the highest maximum adsorption capacity, highlighting the positive impact of utilizing EGDMA as a cross-linker in the molecular imprinting process. This suggests that the choice of cross-linker, in this case EGDMA over TRIM, plays a crucial role in enhancing the adsorption capacity of the resulting MIPs. This insight contributes to the optimization of MIP synthesis for improved performance in adsorption applications. Table S3 (ESI†) displays the calculated quantities of bound GEF and VAN, along with the α and ε values, for both MIP1 and NIP1. The imprinting factor (α) has been calculated for the EGDMA-based materials, representing the ratio of the analyte (GEF or VAN) adsorbed by MIP1 to that adsorbed by NIP1.
The α values affirmed the recognition capabilities of MIPs towards the therapeutic agent compared to their non-imprinted counterparts. Notably, all GEF α values exceeded 1.5, indicating the superior ability of MIP1 to bind the selected template.40 The selectivity coefficients (ε) values correspond to the proportion between the template's rebinding to the MIP and the binding of a competitor, serving as a validation of the selectivity of the imprinted sites. These values further confirmed the elevated selectivity of the particles towards their template with respect to a structural analogue.
To enhance comprehension of the imprinting process, adsorption isotherms of MIPs/NIPs were fitted to two theoretical models, and the findings are summarized in Table S4 (ESI†). The Langmuir model paints a picture of how molecules latch onto a solid surface when the temperature is held steady. According to this model, all the spots where binding happens on the surface are identical. It also suggests that adsorption doesn't go beyond forming a single layer, and each binding spot is reserved for just one molecule. The Langmuir eqn (6), in turn, showcases the envisioned connection between the quantity of captured analyte (Qe) and the analyte roaming freely in the system (Ce) at equilibrium:
 | (6) |
In this scenario, Qmax represents the total number of binding sites and KL serves as the adsorption constant, acting as a gauge for the affinity that the adsorbate has for the binding sites. When the plot of 1/Qeversus 1/Ce was charted, it revealed two straight lines. The calculation of KL and Qmax for the synthesized polymeric materials was then carried out based on the slope and intercept of these lines, as outlined in Table S4 (ESI†).
The Freundlich isotherm stands out as a widely recognized continuous distribution model for isotherms and it has assumed heterogeneity in binding sites, recognizing their variability in nature and strength of interaction with adsorbate molecules. The Freundlich isotherm proposes a power function link between Qe and Ce, as expressed in eqn (7), that has been further linearized in eqn (8):
| Qe = KFCem | (7) |
log![[thin space (1/6-em)]](https://www.rsc.org/images/entities/char_2009.gif) Qe = log Qe = log![[thin space (1/6-em)]](https://www.rsc.org/images/entities/char_2009.gif) KF + m KF + m![[thin space (1/6-em)]](https://www.rsc.org/images/entities/char_2009.gif) log log![[thin space (1/6-em)]](https://www.rsc.org/images/entities/char_2009.gif) Ce Ce | (8) |
![[thin space (1/6-em)]](https://www.rsc.org/images/entities/char_2009.gif) Qe against log
Qe against log![[thin space (1/6-em)]](https://www.rsc.org/images/entities/char_2009.gif) Ce, you can pinpoint system-specific values for KF and m, helping to characterize the adsorption behavior.
Ce, you can pinpoint system-specific values for KF and m, helping to characterize the adsorption behavior.
According to the R2 values from Table S4 (ESI†), it appears that the Freundlich model is a better fit for describing GEF adsorption on the prepared MIPs. This implies a fitting portrayal of non-ideal, heterogeneous adsorption, accommodating multiple layers on surfaces.
The amount of bound GEF at t = 0 (Qt, mol g−1) was determined using the ratio of the initial concentration (Ci, mol L−1) to the residual concentration at adsorption time t (Ct, mol L−1), as per eqn (9):
 | (9) |
Here, V (L) represents the volume of the incubation solution, and m (g) is the amount of polymeric material.
The adsorption kinetic profiles for both imprinted and non-imprinted particles are illustrated in Fig. S2 (ESI†) by plotting Qt against time (t).
The obtained experimental data were employed to apply kinetic models—specifically, the pseudo-first order and pseudo-second order models—to examine the adsorption kinetics of GEF on the prepared MIP. These models operate on distinct assumptions.
The pseudo-first order model presupposes the physical adsorption of a single adsorbate molecule onto one active site on the adsorbent surface. In contrast, the pseudo-second order model assumes that one adsorbate molecule is adsorbed onto two active sites by a chemical adsorption process, which is a crucial factor in determining the overall rate of adsorption.41,42
Eqn (10) represents the pseudo-first order or Lagergren model:
 | (10) |
In this equation, Qe is the amount of adsorbed GEF at the equilibrium time, K1 is the first order adsorption constant, and t is the adsorption time.
The pseudo-second order model is described using eqn 11:
 | (11) |
Kinetic data were fitted for both imprinted and non-imprinted particles in Table S5 (ESI†).
The applicability of the two considered kinetic models to the adsorption behavior of MIPs and NIPs was analyzed considering the obtained correlation coefficients (R2) as well as the experimental and calculated binding capacity (Qe). A correlation coefficient of 0.99 suggests a strong correlation, indicating that the experimental data aligns closely with pseudo-second-order kinetics. This is supported by the close proximity of theoretical Qe43 values to experimental Qe (exp) values for the pseudo-second order.44
3.4. In vitro release studies
To assess the release properties of the synthesized imprinted and non-imprinted particles, in vitro release studies have been carried out. According to the obtained binding data, MIP1 and the corresponding NIP1 were chosen due to the best observed imprinting effect and selectivity of MIP1.The samples were first soaked in a GEF standard solution for three days and by examining the amount of loaded GEF by the polymers, it was possible to determine the drug loading content (DLC) and the drug loading efficiency24 as shown in Table 2.
| Polymeric matrix | Drug loading content (DLC) | Drug loading efficiency (DLE) |
|---|---|---|
| MIP1 | 7.67 ± 0.58% | 75.79 ± 3.78% |
| NIP1 | 6.88 ± 0.32% | 66.58 ± 2.46% |
These values underscore the recognition properties of the prepared imprinted particles in contrast to their non-imprinted counterparts.
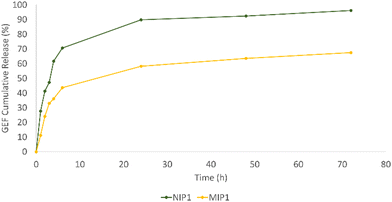
In order to mimic the tumor microenvironment, experiments have been conducted at a constant 37 °C temperature in PBS (10−3 M, pH 5), employing dialysis membranes. At designated time points, 3 mL of the medium were withdrawn, replenishing it with an equal volume of fresh PBS. UV/Vis spectroscopy was employed for sample analysis, and the released GEF quantity was determined using the equation derived from the drug's calibration curve in PBS. Fig. 8 shows the release profile for both MIP1 and NIP1.
The chart clearly demonstrates the rapid release pattern of NIP1, with approximately 28% of the total GEF content liberated within the initial hour. In contrast, MIP1 only released 11% of the drug within the same time frame. By the 72-hour mark, NIP1 and MIP1 had released approximately 96% and 67% of GEF, respectively. The swift release from NIP1 is attributed to its weak and non-specific interactions with the template, leading to a quick discharge.
Conversely, MIP1, equipped with specific cavities for the template, facilitated a more gradual release. The functional groups in the imprinted polymeric matrix's binding sites and those of GEF engaged in selective interactions, allowing for a sustained and controlled release, thus minimizing potential drug side effects.
To investigate the kinetics of drug release in vitro and comprehend the release mechanism from the prepared device, various kinetic models were employed, using the following eqn (12)–(15), respectively, as previously described:13
 | (12) |
 | (13) |
 | (14) |
 | (15) |
Here, Mt is the cumulative amount of drug released at time t, M∞ is the total amount of the drug in the device, and K0, K1, KH, and Kp are the rate constants for zero-order, first-order, Higuchi, and Ritger–Peppas models, respectively. The diffusion release exponent n indicates the operating release mechanism.12
The applicability of eqn (14) in drug release studies is limited to the initial 60% of the release curve due to its approximate nature, as widely acknowledged.
The Ritger–Peppas kinetic model emerges as the optimal selection for depicting the complete release profile of our formulation, as evidenced by the higher R2 values in Table S6 (ESI†).
This highlighted the model's robustness in elucidating the complex dynamics of drug release from the prepared device. Furthermore, the observed n values for both MIP and NIP exceeded 0.5, indicating a non-Fickian or anomalous transport mechanism. This signifies that the drug release is not exclusively governed by simple diffusion but it is influenced by additional processes, such as polymer relaxation or swelling, contributing to the overall release behavior.45
3.5. Cytotoxicity study
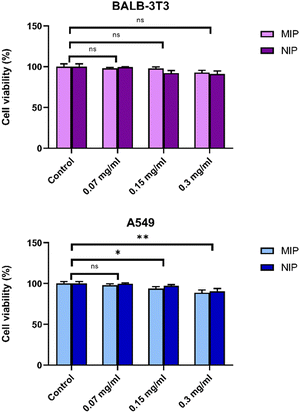
A rapid and cost-effective method for assessing cell proliferation is the 3-(4,5-dimethylthiazol-2-yl)-2,5-diphenyl tetrazolium bromide (MTT) assay, which relies on the transformation of yellow tetrazolium powder into violet/black insoluble formazan crystals. Results obtained from MTT tests conducted on two distinct cell lines, A549 and Balb/3T3 cells, following exposure to increasing concentrations of particles (NPs), indicated no significant reduction in cell viability (Fig. 9).The carrier demonstrated complete non-toxicity towards living cells, suggesting biocompatibility. Notably, both epithelial cells and fibroblasts exhibited similar responses, with a decline in cell viability observed in both cell types only after reaching a concentration of 0.15 mg mL−1. These findings affirm the biocompatibility of both MIP1 and NIP1 at low concentrations, while high concentrations start to render them cytotoxic to A549 and Balb/3T3 cells.
The MTT assay was also performed to evaluate the impact of GEF-loaded MIP1 and NIP1 on the viability of A549 cells (Fig. 10). The chosen GEF concentration for this assessment, 125 μM, was determined based on its established effectiveness against lung cancer cells in a 24-hour treatment.
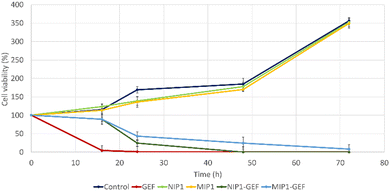 | ||
| Fig. 10 Viability evaluation of A549 cells treated with control (PBS), GEF alone, vehicle alone, GEF-encapsulated MIP1 and NIP1. | ||
This concentration was derived from the previously calculated IC50 value of GEF, using A549 cell cultures (data not shown). Remarkably, the viability of A549 cells treated with GEF plummeted to approximately 4% after 16 hours compared to vehicle-treated cells, leading to complete cell elimination after 24 hours. In contrast, MIP1-GEF and NIP1-GEF exhibited minimal effects after 16 hours. However, a significant reduction in cell viability was observed after 24 hours, with approximately 43% and 24% for MIP1-GEF and NIP1-GEF, respectively. By the 48-hour mark, NIP1-GEF-treated cells displayed a substantial decrease in viability, indicating nearly complete eradication of cancer cells, while MIP1-GEF-treated cells exhibited residual viability around 24%. Finally, after 72 hours, MIP1-GEF exerted a complete impact on cell viability. These results highlighted the temporal drug release profile of GEF formulations in MIP1-GEF and NIP1-GEF, with mild effects evident after 24 hours and reaching peak antitumor activity after 48 and 72 hours for NIP1-GEF and MIP1-GEF, respectively.
Furthermore, the cytotoxic effects of MIP1 alone were assessed throughout the experiment, revealing no significant difference in cell viability compared to vehicle-treated cells at each time point. This suggested that MIP1 alone did not influence cell growth.
3.6. Cellular uptake study
Currently, chemotherapy stands as the primary approach for cancer treatment, yet the emergence of tumor multidrug resistance (MDR) significantly hampers its effectiveness.46 The complexities underlying cancer MDR involve various factors, such as ATP-binding cassette (ABC) transporters, including P-glycoprotein 1 (P-gp), MDR-associated proteins (MRPs), breast cancer resistance protein (ABCG2), glutathione transferase, metallothionein, DNA topoisomerase II, and catalytic enzymes.47,48With the rising utilization of polymeric drug delivery systems, there's a growing recognition of their ability to provide controlled and targeted drug release. Research indicates that the encapsulation of small molecule drugs can influence their pharmacokinetic behavior.49 While freely circulating drugs passively traverse cell membranes and are susceptible to recognition by efflux pumps and ABC transporter proteins, drug-loaded particles have the potential to evade such recognition, thereby enhancing intracellular accumulation of chemotherapeutic agents.50 To assess the internalization of bare MIP1, A549 cells were incubated at 37 °C for 24 h in the presence of fluorescein-labeled MIP at a concentration of 10 μg mL−1. Fig. 11 shows that the imprinted NPs (in green) were internalized and localized in the cytoplasm.
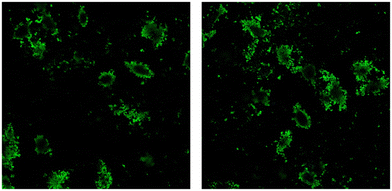 | ||
| Fig. 11 Representative confocal images of internalized MIP1 particles (green dots) after 24-h exposure. | ||
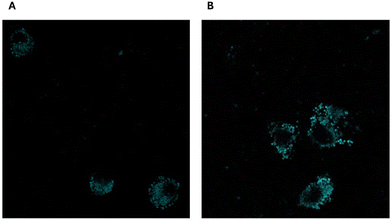
GEF cellular uptake investigation (as depicted in Fig. 12) revealed a significantly higher internalization of MIP1-GEF compared to GEF alone in A549 cells.
This finding suggests the efficient transport of GEF into tumor cells through our developed carriers, indicating their ability to overcome MDR efflux mechanisms. The enhanced cellular uptake of GEF via active endocytosis facilitated by MIP underscores the potential of this approach to counter MDR resulting from drug efflux in cancer cells.
4. Conclusions
The aim of this work was the development of MIPs for the controlled release of GEF for theranostic applications. Polymers have been synthesized using molecular imprinting technology that made it possible to obtain imprinted polymers highly selective for their template.Spherical particles were obtained using precipitation polymerization, with the choice of EGDMA as a cross-linker leading to smaller particle sizes compared to TRIM or to a combination of cross-linkers.
The small dimensions of the particles make possible their use as theranostic systems able to extravasate and accumulate inside the interstitial place where the drug can be released.51 The addition of a fluorescein-labeled monomer offered the possibility of real-time imaging for both diagnosis and guided therapy. The imprinting effect and selectivity of the particles have been evaluated by binding studies where the samples were incubated with a standard solution of GEF.
Adsorption isotherms confirmed the selective recognition properties of the synthesized MIPs due to the presence of specific binding sites into the polymeric matrix. In vitro studies demonstrated the biocompatibility of MIP1 and NIP1 at low concentrations on both A549 and Balb/3T3 cell lines, and the MIPs attitude to release the drug in a controlled and sustained manner during a period of time of 72 h, compared to NIP1. Finally, the significantly higher internalization of MIP1-GEF compared to GEF alone in A549 cells highlighted the potential of our developed carriers to efficiently transport the drug into tumor cells, potentially overcoming MDR mechanisms and suggesting a promising strategy for combating drug efflux in cancer cells.
The developed MIP, which seamlessly integrates fluorescence capabilities with remarkably selective recognition attributes, holds great promise as a material for advancing a cutting-edge theranostic platform. Its potential for application in targeted cancer therapy is particularly noteworthy. The material's ability to exhibit a low release profile not only can enhance its therapeutic efficacy but also can mitigate potential side effects, thereby offering a strategic approach to circumvent the need for administering high doses of the drug. This dual functionality makes it an exciting candidate for further exploration in the realm of precision medicine and targeted cancer treatments.
Author contributions
Conceptualization, M. D., O. I. P. and F. P. (Francesco Puoci); methodology, M. D., F. P. (Francesco Patitucci), O. I. P., M. F. M.; validation, C. F. and M. F. M.; formal analysis, M. D., C. F.; investigation, M. D., M. F. M., F. P. (Francesco Patitucci), M. D. and C. F.; data curation, M. D. and M. F. M.; writing – original draft preparation, M. D. and O. I. P.; writing – review and editing, O. I. P.; supervision, M. D., O. I. P. and F. P. (Francesco Puoci); project administration, O. I. P. and F. P. (Francesco Puoci); funding acquisition, F. P. (Francesco Puoci). All authors have read and agreed to the published version of the manuscript.Data availability
The data supporting this article have been included as part of the ESI.†Conflicts of interest
There are no conflicts to declare.Acknowledgements
M. D. was funded by the National Plan for NRRP Complementary Investments (PNC, established with the decree-law 6 May 2021, n. 59, converted by law n. 101 of 2021) in the call for the funding of research initiatives for technologies and innovative trajectories in the health and care sectors (Directorial Decree n. 931 of 6 June 2022)—project n. PNC0000003—AdvaNced Technologies for Human-centrEd Medicine (project acronym: ANTHEM). This work reflects only the authors’ views and opinions, and neither the Ministry for University and Research nor the European Commission can be considered responsible for them. O. I. P. and F. P. (Francesco Patitucci) were funded by PON “Ricerca e Innovazione” 2014–2020, Asse IV “Istruzione e ricerca per il recupero”, Azione IV.4—“Dottorati e contratti di ricerca su tematiche dell’innovazione”.Notes and references
- W. H. O. (WHO), Journal, 2020.
- C. Zappa and S. A. Mousa, Transl. Lung Cancer Res., 2016, 5, 288 CrossRef CAS.
- Y. S. Chang, C.-M. Choi and J. C. Lee, Tuberc. Respir. Dis., 2016, 79, 248–256 CrossRef.
- A. E. Maennling, M. K. Tur, M. Niebert, T. Klockenbring, F. Zeppernick, S. Gattenlöhner, I. Meinhold-Heerlein and A. F. Hussain, Cancers, 2019, 11, 1826 CrossRef CAS PubMed.
- J. G. Paez, P. A. Janne, J. C. Lee, S. Tracy, H. Greulich, S. Gabriel, P. Herman, F. J. Kaye, N. Lindeman and T. J. Boggon, Science, 2004, 304, 1497–1500 CrossRef CAS PubMed.
- J. H. Ryu, H. Koo, I.-C. Sun, S. H. Yuk, K. Choi, K. Kim and I. C. Kwon, Adv. Drug Delivery Rev., 2012, 64, 1447–1458 CrossRef CAS.
- F. Puoci, G. Cirillo, M. Curcio, O. I. Parisi, F. Iemma and N. Picci, Expert Opin. Drug Delivery, 2011, 8, 1379–1393 CrossRef CAS.
- L. Scrivano, O. I. Parisi, D. Iacopetta, M. Ruffo, J. Ceramella, M. S. Sinicropi and F. Puoci, Polym. Adv. Technol., 2019, 30, 743–748 CrossRef CAS.
- Z. Zeng, Y. Hoshino, A. Rodriguez, H. Yoo and K. J. Shea, ACS Nano, 2010, 4, 199–204 CrossRef CAS PubMed.
- O. I. Parisi, M. Dattilo, F. Patitucci, R. Malivindi, S. Delbue, P. Ferrante, S. Parapini, R. Galeazzi, M. Cavarelli and F. Cilurzo, Nanoscale, 2021, 13, 16885–16899 RSC.
- O. I. Parisi, F. Francomano, M. Dattilo, F. Patitucci, S. Prete, F. Amone and F. Puoci, J. Funct. Biomater., 2022, 13, 12 CrossRef CAS.
- M. Arici, O. Topbas, S. Y. Karavana, G. Ertan, M. Sariisik and C. Ozturk, J. Microencapsulation, 2014, 31, 654–666 CrossRef CAS PubMed.
- O. I. Parisi, M. Ruffo, R. Malivindi, A. F. Vattimo, V. Pezzi and F. Puoci, Pharmaceutics, 2020, 12, 41 CrossRef CAS PubMed.
- Q. Wang, A. Zeng, M. Zhu and L. Song, Int. J. Oncol., 2023, 62, 1–10 Search PubMed.
- W. S. Siegel-Lakhai, J. H. Beijnen and J. H. Schellens, Oncologist, 2005, 10, 579–589 CrossRef CAS.
- G. Giaccone, Clin. Cancer Res., 2004, 10, 4233s–4237s CrossRef CAS PubMed.
- J. A. Engelman and P. A. Jänne, Clin. Cancer Res., 2008, 14, 2895–2899 CrossRef PubMed.
- A. Y. Sherif, G. I. Harisa, A. A. Shahba, F. K. Alanazi and W. Qamar, Molecules, 2023, 28, 448 CrossRef CAS.
- Y. Hu, J. Zhang, H. Hu, S. Xu, L. Xu and E. Chen, Cell Cycle, 2020, 19, 3581–3594 CrossRef CAS.
- W. Han, L. Shi, L. Ren, L. Zhou, T. Li, Y. Qiao and H. Wang, Signal Transduction Targeted Ther., 2018, 3, 1–10 CrossRef CAS.
- S. W. Provencher, Comput. Phys. Commun., 1982, 27, 229–242 CrossRef.
- O. I. Parisi, C. Morelli, L. Scrivano, M. S. Sinicropi, M. G. Cesario, S. Candamano, F. Puoci and D. Sisci, RSC Adv., 2015, 5, 65308–65315 RSC.
- M. Ruffo, O. I. Parisi, F. Patitucci, M. Dattilo, R. Malivindi, F. Amone, C. Morelli, A. Nigro, D. Sisci and F. Puoci, J. Funct. Biomater., 2020, 11, 48 CrossRef CAS PubMed.
- A. Carrato, A. Swieboda-Sadlej, M. Staszewska-Skurczynska, R. Lim, L. Roman, Y. Shparyk, I. Bondarenko, D. J. Jonker, Y. Sun and A. Jhony, J. Clin. Oncol., 2013, 31, 1341–1347 CrossRef CAS PubMed.
- H. Kempe, A. Parareda Pujolràs and M. Kempe, Pharm. Res., 2015, 32, 375–388 CrossRef CAS.
- R. Zhang, R. Gao, Q. Gou, J. Lai and X. Li, Polymers, 2022, 14, 1851 CrossRef CAS PubMed.
- X. Fu, Q. Yang, Q. Zhou, Q. Lin and C. Wang, Open J. Org. Polym. Mater., 2015, 5, 58 CrossRef CAS.
- A. Florea, O. Hosu, B. Ciui and C. Cristea, Molecularly imprinted polymer-based sensors for biomedical and environmental applications, Scrievener Publishing, NJ, USA, 2016 Search PubMed.
- J. Lopes, R. Fonseca, T. Viana, C. Fernandes, P. Morouço, C. Moura and S. Biscaia, Appl. Mech. Mater., 2019, 890, 290–300 Search PubMed.
- J. G. Braks and R. Y. Huang, J. Appl. Polym. Sci., 1978, 22, 3111–3120 CrossRef CAS.
- M. Pei, X. Jia, G. Li and P. Liu, Mol. Pharmaceutics, 2018, 16, 227–237 CrossRef.
- W. B. Swanson, M. Durdan, M. Eberle, S. Woodbury, A. Mauser, J. Gregory, B. Zhang, D. Niemann, J. Herremans and P. X. Ma, RSC Chem. Biol., 2022, 3, 748–764 RSC.
- A. Costela, I. Garcia-Moreno, J. Figuera, F. Amat-Guerri, R. Mallavia, M. Santa-Maria and R. Sastre, J. Appl. Phys., 1996, 80, 3167–3173 CrossRef CAS.
- S. S. Nogueira, A. R. de Araujo-Nobre, A. C. Mafud, M. A. Guimarães, M. M. M. Alves, A. Plácido, F. A. A. Carvalho, D. D. R. Arcanjo, Y. Mascarenhas and F. G. Costa, Int. J. Biol. Macromol., 2019, 135, 808–814 CrossRef CAS.
- S. He, L. Zhang, S. Bai, H. Yang, Z. Cui, X. Zhang and Y. Li, Eur. Polym. J., 2021, 143, 110179 CrossRef CAS.
- L. Vroman, A. Adams, G. Fischer and P. Munoz, Small, 1980, 55, 156–159 CAS.
- J. Wolska and N. Jalilnejad Falizi, Polymers, 2021, 13, 2830 CrossRef CAS.
- M. Grochowicz and B. Gawdzik, J. Porous Mater., 2013, 20, 339–349 CrossRef CAS.
- O. I. Parisi, M. Ruffo, L. Scrivano, R. Malivindi, A. Vassallo and F. Puoci, Pharmaceuticals, 2018, 11, 92 CrossRef CAS PubMed.
- R. J. Ansell, Molecularly imprinted polymers in biotechnology, 2015, pp. 51–93 Search PubMed.
- N. Naowanat, N. Thouchprasitchai and S. Pongstabodee, J. Environ. Manage., 2016, 169, 103–115 CrossRef CAS.
- H. Wang, L. Yuan, H. Zhu, R. Jin and J. Xing, J. Polym. Sci., Part A: Polym. Chem., 2019, 57, 157–164 CrossRef CAS.
- C. R. Justus, L. Dong and L. V. Yang, Front. Physiol., 2013, 4, 354 Search PubMed.
- N. A. Yusof, S. K. Ab Rahman, M. Z. Hussein and N. A. Ibrahim, Polymers, 2013, 5, 1215–1228 CrossRef.
- E. Rinaki, G. Valsami and P. Macheras, Int. J. Pharm., 2003, 255, 199–207 CrossRef CAS PubMed.
- K. Bukowski, M. Kciuk and R. Kontek, Int. J. Mol. Sci., 2020, 21, 3233 CrossRef CAS PubMed.
- M. M. Gottesman and V. Ling, FEBS Lett., 2006, 580, 998–1009 CrossRef CAS PubMed.
- C.-H. Choi, Cancer Cell Int., 2005, 5, 1–13 CrossRef.
- J. L. Markman, A. Rekechenetskiy, E. Holler and J. Y. Ljubimova, Adv. Drug Delivery Rev., 2013, 65, 1866–1879 CrossRef CAS.
- A. R. Kirtane, S. M. Kalscheuer and J. Panyam, Adv. Drug Delivery Rev., 2013, 65, 1731–1747 CrossRef CAS.
- V. P. Torchilin, Eur. J. Pharm. Sci., 2000, 11, S81–S91 CrossRef CAS.
Footnote |
| † Electronic supplementary information (ESI) available. See DOI: https://doi.org/10.1039/d4ma00391h |
| This journal is © The Royal Society of Chemistry 2024 |

