 Open Access Article
Creative Commons Attribution 3.0 Unported Licence
Mechano-synthesis of a AgSrFeO3 catalyst for epoxidation of ethylene in a chemical looping set-up†
Chawangwa
Damba
 a,
Isaac N.
Beas
 *ac,
Mmilili M.
Mapolelo
 a,
James
Darkwa
 ab and
E. J.
Marek
 d
d
aDepartment of Natural Resources and Materials, Botswana Institute for Technology Research and Innovation, Gaborone, Botswana. E-mail: ibeas@bitri.co.bw
bDepartment of Chemical Sciences, University of Johannesburg, PO Box 524, Auckland Park, 2006, South Africa
cDepartment of Chemical Engineering, University of South Africa, P/Bag X6, Florida, Johannesburg 1710, South Africa
dDepartment of Engineering, University of Cambridge, Trumpington Street, CB2 1PZ, UK
First published on 10th June 2024
Abstract
The catalyst AgSrFeO3(imp), used in chemical looping epoxidation of ethylene-to-ethylene oxide (EtO), is usually synthesised via a conventional impregnation method. We have used a mechano-chemical method to synthesise the catalyst, AgSrFeO3(ss), by initially homogenising Fe2O3, SrCO3 and AgNO3 (15 wt% loading of Ag) and ethanol (0.25 mL g−1 precursor) as a binder in a mortar and pestle, followed by ball milling at 500 Hz for 1 h and drying at 120 °C. The AgSrFeO3(ss) thus produced was characterized using XRD, XPS, TGA, and SEM analyses after calcination and tested in a reactor setup that allowed the silver active site in the catalyst to receive oxygen from the active solid support and not from a gas stream for the epoxidation reaction. The ethylene epoxidation conversion rate for our AgSrFeO3(ss) was 9–12% but with a superior selectivity of 42–62% and a conversion rate that was sustained for at least 20 cycles compared to the conversion rate of 10–15% for AgSrFeO3(imp) that kept decreasing after the first cycle. We have thus demonstrated a more straightforward way to make AgSrFeO3, with a better yield of EtO with AgSrFeO3(ss) compared to the AgSrFeO3(imp) catalyst, which shows superior performance for chemical looping epoxidation of ethylene to what has been reported so far.
1. Introduction
Ethylene epoxidation is a chemical process widely used in producing important industrial chemicals, such as EtO, a critical raw material for producing ethylene glycol, surfactants, detergents, plastic solvents, and other household chemicals.1 It is used directly in the gaseous form as a disinfectant, sterilizing agent, fumigant, and insecticide, alone or in non-explosive mixtures with nitrogen, carbon dioxide or dichlorofluoromethane to enhance its effectiveness and safety.2 The preparation process for EtO involves the reaction of ethylene with oxygen over a catalyst at temperatures and pressures of 230–270 °C and 1–3 MPa, respectively.3Efficient and cost-effective catalysts are crucial for this process, as they can significantly impact the reaction yield, selectivity, and stability.4 This is due to their high selectivity and activity in the process. However, the catalysts can suffer from deactivation caused by the formation of aggregates or sintering under reaction conditions. Additionally, they can be expensive and contain toxic components. Studies have explored various materials to address the challenges or limitations of potential alternatives to silver-based catalysts.5–7 The materials include supported molybdenum, heteropolyacid, perovskite, and bimetallic catalysts. Nonetheless, the alternative catalysts have shown promise in their selectivity and activity for ethylene epoxidation. Among the materials, SrFeO3 is a highly promising material for utilization as an oxygen carrier in chemical looping processes for various reactions. The material has demonstrated excellent performance as an oxygen source due to its remarkable ability to release and uptake oxygen reversibly. This unique ability makes it a highly attractive option for applications that require transfer reactions.5,8 Adding silver nanoparticles to the SrFeO3 structure can further enhance its catalytic performance. The synthesis and preparation method of catalysts for ethylene epoxidation significantly impact their activity and selectivity.
The activity of AgSrFeO3 for ethylene epoxidation is influenced by various factors such as the preparation method, the Ag![[thin space (1/6-em)]](https://www.rsc.org/images/entities/char_2009.gif) :
:![[thin space (1/6-em)]](https://www.rsc.org/images/entities/char_2009.gif) Sr
Sr![[thin space (1/6-em)]](https://www.rsc.org/images/entities/char_2009.gif) :
:![[thin space (1/6-em)]](https://www.rsc.org/images/entities/char_2009.gif) Fe ratio, and the support material.9 The method used to prepare the catalyst can affect the resulting catalyst's structure, composition, and activity. The different synthesis methods can lead to different morphologies, particle sizes, and dispersion of the active species, which can affect the catalytic performance of the catalyst. Solid-state synthesis is an effective method for preparing highly dispersed, homogeneous catalysts with improved activity and stability. Ball milling has recently emerged as a promising technique for synthesizing catalysts, resulting in a higher surface area, smaller particle size, and higher catalytic activity than obtained using traditional synthesis methods.10
Fe ratio, and the support material.9 The method used to prepare the catalyst can affect the resulting catalyst's structure, composition, and activity. The different synthesis methods can lead to different morphologies, particle sizes, and dispersion of the active species, which can affect the catalytic performance of the catalyst. Solid-state synthesis is an effective method for preparing highly dispersed, homogeneous catalysts with improved activity and stability. Ball milling has recently emerged as a promising technique for synthesizing catalysts, resulting in a higher surface area, smaller particle size, and higher catalytic activity than obtained using traditional synthesis methods.10
This study aimed to produce an AgSrFeO3 catalyst using a ball milling process. We carefully examined the composition and structure of the generated solid-state catalyst and evaluated its effectiveness in ethylene epoxidation. We employed quadrupole mass spectrometry (QMS) to detect the produced EtO.
2. Experimental
2.1. Catalyst preparation
The catalyst was solid synthesized by manually mixing a stoichiometric amount of Fe2O3 (0.36 mol, 95%, Fisher Scientific), SrCO3 (0.72 mol, 98%, Sigma Aldrich) and 15% loading of AgNO3 with a pestle until the mixture had a homogeneous appearance. Ethanol was employed as a binding agent in the mixture to facilitate the blending of the precursors at a ratio of 0.25 mL g−1. The mixture was ball milled at 500 Hz for 1 h, dried at 120 °C, and then calcined. Calcination was carried out at different temperatures: 500 °C, 600 °C, 700 °C, 800 °C and 900 °C. The ramp rate was always 5 °C min−1, and the calcination lasted 10 h.2.2. Material characterization
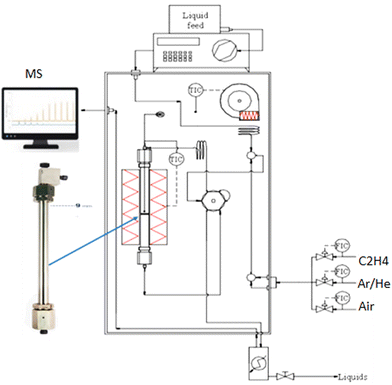
The reaction was carried out in an Effi reactor system (described in Fig. S1, ESI†) at 270 °C and atmospheric pressure with a gas feed rate of 200 mL min−1. Gases were fed into the reactor with calibrated mass flow controllers (EL-FLOW Bronkhorst) mass flow control, with the feed lines and reactor sitting in a temperature-controlled box. A single epoxidation experiment consisted of 10 cycles with four steps: (i) purging with Ar; (ii) reduction with 5.4 vol% C2H4 in Ar; (iii) rinsing with Ar; (iv) mixed air oxidation (2 L vol% O2 in N2). The reaction products were analyzed and detected by using a quadrupole mass spectrometer (MS Hiden Analytical).
The Hiden mass spectrometer was used for mass spectral analysis of the gas effluent in a real-time reaction. The ionization voltage was set at 70 eV and a base pressure of 2.3 × 10⁻⁶ Pa was applied. The emission current was set to 100 A, with optimized residence times between 80 and 240 ms. The collected partial pressure mass spectra were analyzed for C2H4, EtO, CO and CO2. For the analysis of the obtained results, the measured relative abundances (intensities) of m/z = 27 of C2H4, m/z = 43 of EtO, m/z = 28 of CO and m/z = 44 of CO2 were normalized by m/z = 40 intensity of Ar (that was an inert reference gas). Mass spectral analysis of ethylene oxide (EtO) and its by-products, i.e. the identification, quantification, and determination by quadrupole mass spectrometry (QMS), has been previously reported by S. Böcklein et al.6 Argon and the corresponding gas were introduced sequentially in the experiments. This allowed us to determine the partial pressures of both gases, p(X), normalized by the partial pressure of Ar, present during all the reactions as an inert reference gas, p(Ar). The composition of the reaction mixture was quantified as described previously by S. Böcklein et al.6 Identification of ethylene oxide (EtO) in ethylene epoxidation processes poses a significant challenge due to various byproducts and isomers with similar mass spectra. Mass spectrometry (MS) is a reliable technique that can be used to detect EtO. However, the primary mass at m/z = 44, which corresponds to the mass-to-charge ratio of CO2, is unsuitable as a signal for EtO detection because CO2 is formed as a primary byproduct of the catalytic EtO synthesis. Furthermore, the selectivity for EtO is low at a pressure of 1 mbar and the yield of CO2 is 50 times higher than of EtO, making it difficult to distinguish between the two based on the m/z = 44 signal. The highest EtO signal is observed at m/z = 29, which has no interference with CO2, except for a small signal from the 13CO fragment of 13CO2. However, ethylene, whose primary mass is at m/z = 28, produces a signal at m/z = 29 due to natural isotope molecules, which are superimposed on the EtO signal. The different EtO yields further complicate matters, as the m/z = 29 ethylene signal is two orders of magnitude higher than that of EtO, making it unsuitable for reliable EtO detection. The EtO fragments with m/z = 14, 15 and 28 cannot be used for detection either because they correspond to mass fragments of ethylene. While the next lowest intensity EtO mass fragment at m/z = 43 has no cross-sensitivities with CO2 and ethylene, it is also a fragment of acetaldehyde (AcH), a byproduct of EtO synthesis. AcH can be formed from ethylene and oxygen atoms or by isomerization of EtO. It is also a possible intermediate in the total oxidation reaction. AcH and EtO are isomers and have almost identical mass spectra. However, the intensity ratio I43/I42 of the m/z = 43 and 42 signals is smaller for EtO than for AcH, and similar ratios have been observed previously. In all reaction series, the I43/I42 ratio was consistently measured. Across all conducted experiments, it was consistently observed that the value for EtO consistently precluded the formation of acetaldehyde. For example, the ratio of the partial pressures of ethylene oxide (EtO) to argon (Ar) in the reaction mixture is referred to as the partial pressure of EtO in the reaction mixture normalized by the partial pressure of argon. This ratio is crucial when ethylene oxide is utilized as a reactant in various commercial and research applications. It offers a way to precisely control the reaction conditions and quantifies the amount of EtO present in the reaction mixture. Therefore, it is essential to precisely measure and watch this value while the reaction process progresses.
The conversion values of ethylene (C) were evaluated as follows:
The background-correction relative to Ar values was utilized at intervals during which a consistent reaction rate was achieved, typically during the second period of the reaction. For the analysis of the results obtained, the start time (t-start) of each cycle was taken as the time when C2H4 was detected above 1.0 e10 Pa for the first cycle, and the end time (t-end) was taken as the time when partial ethylene pressure reached the maximum value in the cycle. The selectivity of ethylene oxide (EtO) was estimated as follows:
Carbon monoxide (CO) was omitted from this report because it could not be reliably determined using the data collected from the large ethylene shield.
3. Results
The behavior of AgSrFeO3(ss) catalysts was investigated via programmed heating at different temperatures in air. Fig. 2(a) shows the mass change of the catalyst before calcination, whereas Fig. 2(b) compares the mass change at different calcination temperatures.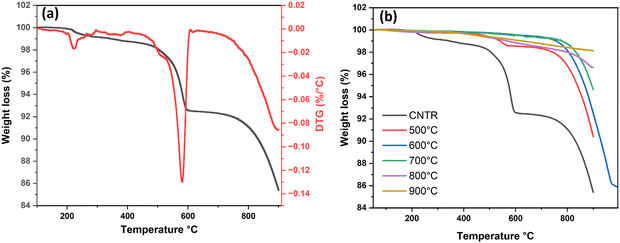 | ||
| Fig. 2 (a) TGA-analysis curve for the fresh Ag/SrFeO3 catalyst, (b) TGA curve of the Ag/SrFeO3 catalyst calcined at different temperatures. | ||
The catalyst profiles exhibited weight losses of 14.6 wt%, 9.6 wt%, 7.6 wt%, 5.4 wt%, 3.4 wt%, and 1.9 wt% for the uncalcined catalyst, and catalysts calcined at 500 °C, 600 °C, 700 °C, 800 °C and 900 °C, respectively (Fig. 2(b)).
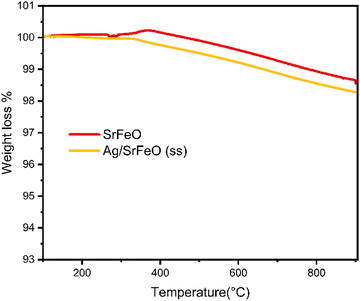
Fig. 3 shows the thermal evolution of the support SrFeO3 and the catalyst Ag/SrFeO3 in an air atmosphere, recorded from room temperature to 950 °C. The weight loss from room temperature to about 100 °C is due to the evaporation of adsorbed water. When the temperature exceeds 300 °C, the turning point temperature results from losing oxygen in the lattice. This leads to the formation of oxygen vacancies and the reduction of Fe3+ and Fe4+ in the samples. In the 300–950 °C temperature range, the weight loss of SrFeO3 and Ag/SrFeO3 is 1.30% and 1.69%, respectively, indicating increased oxygen vacancies with the Fe3+ content.
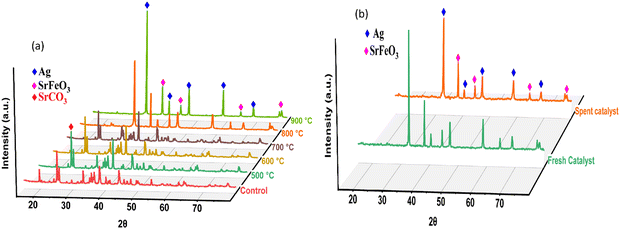
Fig. 4 depicts a typical X-ray diffraction pattern of the solid-state synthesized AgSrFeO3 catalyst calcined at temperatures between 500 °C and 900 °C. The phase composition of samples calcined from 500 to 700 °C varied from samples from 800 to 900 °C. According to messing12 when a material is subjected to calcination, the temperature and duration of heating can cause changes in its crystal structure and phase composition. At lower temperatures, a material may retain its original crystal structure. In contrast, at higher temperatures, new phases may form due to changes in the chemical bonding or atomic arrangement of the material.
Impurities of SrCO3 (ICSD no. 96-900-8199) and Fe2O3 (ICSD no. 98-006-67556) were found in samples calcined at 500–700 °C. The presence of impurities in silver-based catalysts for chemical looping epoxidation can have positive and negative effects on the catalyst performance, depending on the specific reaction and conditions.8,13 On the positive side, strontianite can stabilize silver nanoparticles.14 This prevents sintering and promotes the long-term stability of the catalyst. This can be particularly important in chemical looping reactions where the catalyst is exposed to high temperatures and reactive gas environments.
On the negative side, SrCO3 impurities can block active sites on the catalyst surface and decrease the overall catalytic activity. This can be especially true if the impurities are present in high concentrations and/or are poorly dispersed throughout the catalyst material.5,8 Fe2O3 can also cause deactivation of the catalyst and reduce its selectivity towards EtO.15 The exact mechanism by which Fe2O3 affects the performance of silver-based catalysts has yet to be fully understood. However, it is thought to be related to its ability to interact with the active silver sites on the catalyst surface at 900 °C and the absence of SrCO3 and Fe2O3. The lack of these impurities might indicate the decomposition of SrCO3 and reduction of the Fe2O3 to form a mixed metal oxide, SrFeO3 (ICSD no. 980163169), at high calcination temperatures. SrFeO3 is well known for its promising catalytic properties for chemical looping in ethylene epoxidation. One of the critical properties that makes SrFeO3 well-suited for chemical looping in ethylene epoxidation is its ability to release and store oxygen at high temperatures.16 This makes the SrFeO3 an effective oxygen carrier in a chemical looping process, transferring oxygen between a reducing and an oxidizing atmosphere. The reversible oxygen transfer process in SrFeO3 can thus be harnessed to produce highly reactive oxygen species, which can facilitate the oxidation of ethylene to ethylene oxide.
Our study also depicted the crystalline silver's face-centred cubic (FCC) phase (ICSD no. 98-005-3761). The face-centred cubic (FCC) phase of crystalline silver with ICSD no. 98-005-3761 has been extensively studied as a catalyst for ethylene epoxidation and chemical looping.17 It is known for its high selectivity towards ethylene oxide production. The high activity and selectivity of the FCC silver catalyst are attributed to the high reactivity of the (111) facets of the FCC crystal structure, which facilitates the reduction of the metal oxide particles.18 Similar results were observed when the impregnation experimental techniques were used in a study of Marek and co-workers.8
Fig. 4b shows the typical X-ray diffraction pattern of fresh and spent Ag/SrFeO3 catalysts compared, revealing similarities. The peaks at 2θ = 23.2, 32.9, 40.6, 47.2, 58.6, 68.8 and 78.3 can be assigned to about 83% strontium ferrate. Silver was indexed to peaks at 2 = 38.4, 44.5, 64.6 and 77.7 at approximately 17%. The results were consistent or similar to those obtained using the impregnation experimental techniques.5,16 The patterns obtained for both fresh and used catalysts were similar. This indicates that the structure of the used Ag/SrFeO3 catalyst remained intact after the reaction.
The surface morphology and distribution of our catalyst synthesized using the ball milling method were determined by SEM analysis, as shown in Fig. 5. The amount of silver in the catalyst was determined to be 10% using EDS Smart Quantification. According to the literature, the most widely used commercial catalyst for ethylene epoxidation consists of 13–18% Ag on γ-Al2O3.17
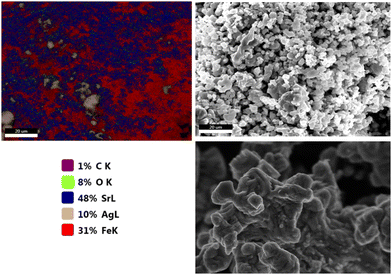 | ||
| Fig. 5 SEM-EDS was used to determine the distribution of Sr, Fe, O, and Ag on the catalyst synthesized by ball milling. | ||
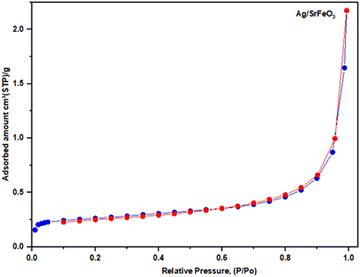
The gas adsorption measurements are widely used to determine catalyst materials' surface area, pore volume, and pore size distribution. Fig. 6 Illustrates a nitrogen adsorption–desorption isotherm of AgSrFeO3. The measured isotherms in Fig. 6. The pore size distribution was uniform in all cases. According to the international union of pure and applied chemistry (IUPAC) nomenclature, they can be classified as Type III isotherms. The calculation using the Brunauer–Emmett–Teller (BET) equation gives a small specific area of 0.93 m2 g−1 for AgSrFeO3. The surface area obtained with the catalyst agrees with the values in the literature. Several reports have found that low surface area is typical of this type of material.
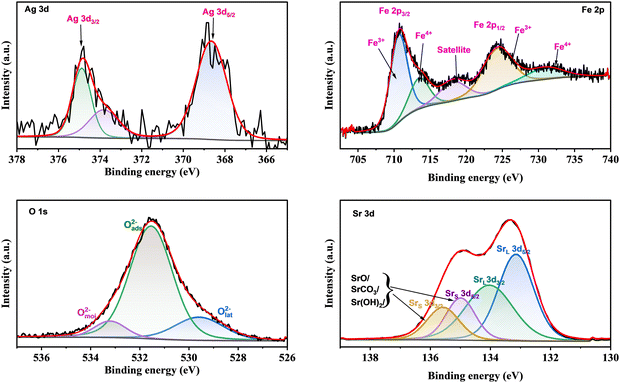
We used the Casa-XPS software to analyze the XPS spectra of the Ag/SrFeO3 catalyst with the help of the Shirley background subtraction method. Thus, we could constructively identify the valence states of the elements present. The 30% Lorentzian and 70% Gaussian calibration functions were used in the analysis.19
The Sr 3d spectrum of the AgSrFeO3 from the ball milling sample (Fig. 7) showed two prominent peaks of Sr 3d5/2 and Sr 3d3/2 components at 132.9 and 134.7 eV, respectively. They are attributed to the bonds of Sr atoms in the perovskite structure of Ag/SrFeO3. There are two other minor peaks at 133.8 and 135.5 eV that originate from Sr atoms in non-perovskite structure areas of the Ag/SrFeO3 film, such as Sr–OH, Sr–CO3, Sr–Sr, and Sr–O bonds at the surface.20 To determine the nature of the iron species in the Ag/SrFeO3 catalyst, the XPS spectra of the Fe 2p spectral region (Fig. 7) can be deconvoluted. A primary band centred at 710.1 eV was observed, accompanied by a secondary band displaced by 13.7 eV to higher binding energy (725.6 eV).21 A satellite peak was also observed around 719.9 eV, which confirmed the presence of Fe3+ species on the surface of Ag/SrFeO3.22
In Fig. 7, the Fe 2p XPS region only displays a doublet of 2p3/2. By deconvoluting the Fe 2p spectra, two components can be obtained. The peaks can be fitted into the element of Fe3+ and Fe4+ by application of Gaussian fitting, as indicated in Fig. 7. The second peak that appears at 725.6 eV can be assigned to Fe4+. Therefore, the catalyst contains a mixture of Fe+3 and Fe+4 oxidation states.
The Fe3+ and Fe4+ percentages can be calculated by analyzing the area under their corresponding peak components. Table 1 presents the average valence state of Fe and the oxygen content in SrFeO3 and Ag/SrFeO3(ss). Based on the table, it can be concluded that SrFeO3 has high oxygen content, which implies that Ag/SrFeO3(ss) has the greatest number of oxygen vacancies. This conclusion or observation aligns with the TGA analysis results and demonstrates that Ag/SrFeO3(ss) has the highest mass loss. Oxygen transportation in the Ag/SrFeO2 (ss) catalyst perovskite occurs via oxygen vacancies. Therefore, the existence of oxygen vacancies supports catalytic oxidation.
| Sample | Fe3+ (%) | Fe4+ (%) | Average valence | Olattice (%) | Oadsorbed (%) | Omoisture (%) |
|---|---|---|---|---|---|---|
| SrFeO3 | 53.3 | 46.7 | 3.48 | 5.62 | 78.96 | 15.42 |
| Ag/SrFeO3 from ball milling | 70.2 | 29.8 | 3.29 | 0.95 | 91.52 | 7.53 |
Fig. 7 shows that the O 1s spectra of the Ag/SrFeO3 catalyst can be divided into three parts. The peaks at approximately 533.1 eV, 531.3 eV, and 529.1 eV correspond to moisture on the surface (Omoi), adsorbed oxygen (Oads), and oxygen in the lattice (Olat), respectively.23,24Table 1 lists the percentages of the different types of oxygens calculated from the fitted XPS spectra. It is commonly believed that Oads is linked to the concentration of oxygen defects in materials.25 Therefore, the ratio of Oads/Olat is usually used as a criterion for determining the relative content of oxygen vacancies in materials.26,27 The calculated values of Oads/Olat from the O 1s XPS spectra are 1.19 and 1.01 for Ag/SrFeO3(ss) and SrFeO3, respectively. Thus, it indicates that the Ag/SrFeO3(ss) sample has the greatest number of oxygen vacancies.
3.1. Catalyst performance evaluation
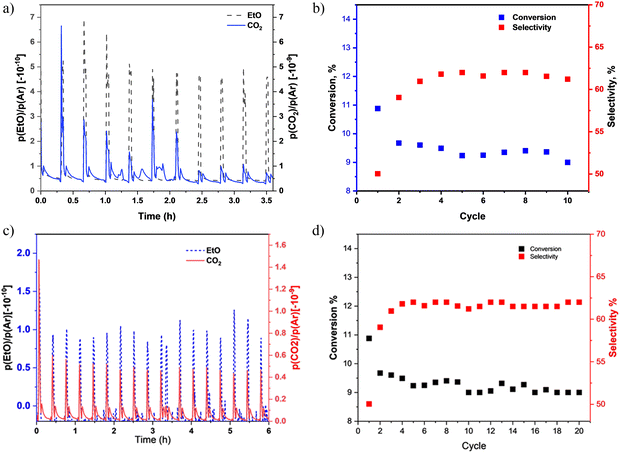
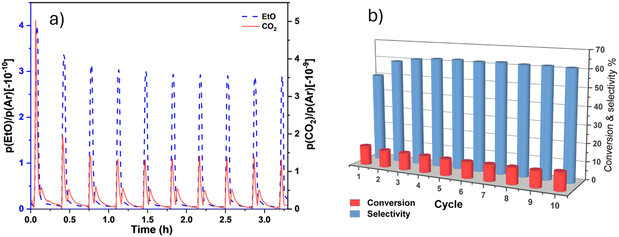
Fig. 8(a) highlights the mass spectral analysis of the catalytic behaviour of the AgSrFeO3 catalysts. The products are mainly EtO and CO2. The product signal, EtO selectivity, and ethylene conversion as functions of the reaction cycle over AgSrFeO3 are shown in Fig. 8(b). It can be observed that the ethylene conversion ranged between 9 and 12%. The first cycle gave the highest conversion of ethylene, 12%. The ranges are consistent with the results of previously reported studies.19 The selectivity to EtO ranged between 45 and 61%. The selectivity increased from 45% to 61% in the second cycle; after that, it stabilized at 61%. The increase resulted from a decreased CO2 signal, whereas the EtO signal remained the same. Previously reported studies have also shown the same trend.28 However, the selectivity decreased in the tenth cycle due to the deactivation of the catalyst. Catalytic deactivation is unavoidable for most catalytic processes. It can be caused by carbon deposition, thermal degradation, sintering, poisoning, fouling, and leaching of the active metal species.20,29 It is known that the AgSrFeO3 catalyst is deactivated during the chemical loop epoxidation of ethylene mainly by the slow rate of re-oxidation if the catalyst is not fully regenerated before the next reduction cycle.9The regeneration of the AgSrFeO3 catalyst was investigated via in situ pretreatment in air at 650 °C for 1 h before it was subjected to the same 10 epoxidation cycles. Fig. 9 shows that the in situ treatment completely regenerated the catalyst performance. The treated sample showed satisfactory performance similar to that of a fresh catalyst. In an industrial application, the efficient recycling of the AgSrFeO3 after a reaction is important as it reduces production costs and minimizes waste generation.
Apart from the catalyst's activity and regenerative capacity, it is crucial to consider its stability. The catalytic stability of the AgSrFeO3 catalyst was evaluated during 20 epoxidation cycles. The results are shown in Fig. 8c and d. The catalyst remained stable for a considerable period (from cycle 2 to cycle 12). As the reaction cycle increased, the conversion of ethylene was still stable, and selectivity towards ethylene oxide fluctuated. The conversion of ethylene remained in the range between 8.5 and 10%, and selectivity towards EtO was between 45 and 62%.
The results obtained are comparable or superior to those published in the open literature. This indicates that Ag/SrFeO3(ss) catalysts may play a vital role in improving the performance of the ethylene epoxidation reaction in the near future, see Fig. 10. The simplicity and robustness of the catalyst suggest that it can be a key platform for achieving higher yields and selectivity in this reaction. The findings have significant implications for developing more efficient and sustainable processes to produce ethylene oxide, a crucial intermediate in the manufacturing of various chemicals and materials. Further investigations are warranted to explore Ag/SrFeO3(ss) catalysts' full potential and optimize their performance for industrial-scale applications.
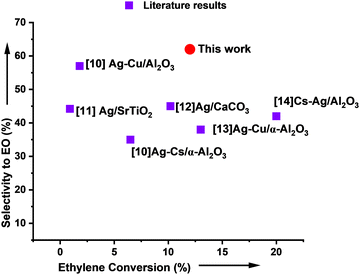 | ||
| Fig. 10 An overview of the most notable catalytic performances reported for ethylene epoxidation. The performances are expressed in selectivity towards ethylene oxide (EtO) formation as a function of the total ethylene conversion.3,30–33 | ||
Conclusion
The mechano-synthesis technique for producing the AgSrFeO3 catalyst for the chemical looping epoxidation of ethylene has demonstrated impressive capabilities, surpassing conventional impregnation synthesis methods in terms of yield, selectivity, and conversion rate. The catalyst operates efficiently at atmospheric pressure without requiring an additional catalyst or gas feed promoters. Instead, it relies on oxygen from the active solid support, creating a cyclic chemical looping process that eliminates the need for simultaneous gaseous oxygen and ethylene feed. The AgSrFeO3 catalyst exhibits stable and consistent performance over multiple cycles, with a selectivity range of 45–62% and a conversion range of 9–12%. Its simplicity and robustness suggest its potential for achieving higher yields and selectivity in the epoxidation reaction, which has significant implications for the production of ethylene oxide. Further investigations are necessary to optimize its performance for industrial-scale applications.Conflicts of interest
The authors declare no conflict of interest.Acknowledgements
Financial assistance provided by the UK Research and Innovation Grant No. EP/V048414/1 and the Botswana Institute for Technology, Research and Innovation (BITRI) under COA 001 is gratefully acknowledged.References
- A. Pérez Sánchez, J. G. Baltá García, J. R. Montalván Viart, E. Ranero González and E. J. Pérez Sánchez, Simulation of the ethylene oxide production process in ChemCAD® simulator, ( 2021) Search PubMed.
- W.H. Organization, I.A. for R. on Cancer, 1,3-Butadiene, ethylene oxide and vinyl halides (vinyl fluoride, vinyl chloride and vinyl bromide), 1,3-Butadiene, Ethyl. Oxide Vinyl Halides (Vinyl Fluoride, Vinyl Chloride Vinyl Bromide). (2008).
- T. Pu, H. Tian, M. E. Ford, S. Rangarajan and I. E. Wachs, Overview of selective oxidation of ethylene to ethylene oxide by Ag catalysts, ACS Catal., 2019, 9, 10727–10750 CrossRef CAS.
- R. Ye, S. Xiao, Q. Lai, D. Wang, Y. Huang, G. Feng, R. Zhang and T. Wang, Advances in Enhancing the Stability of Cu-Based Catalysts for Methanol Reforming, Catalysts, 2022, 12(7), 747 CrossRef CAS.
- M. S. C. Chan, E. Marek, S. A. Scott and J. S. Dennis, Chemical looping epoxidation, J. Catal., 2018, 359, 1–7 CrossRef CAS.
- S. Böcklein, S. Günther, R. Reichelt, R. Wyrwich, M. Joas, C. Hettstedt, M. Ehrensperger, J. Sicklinger and J. Wintterlin, Detection and quantification of steady-state ethylene oxide formation over an Ag(111) single crystal, J. Catal., 2013, 299, 129–136, DOI:10.1016/j.jcat.2012.12.005.
- J. G. Serafin, A. C. Liu and S. R. Seyedmonir, Surface science and the silver-catalyzed epoxidation of ethylene: an industrial perspective, J. Mol. Catal. A Chem., 1998, 131, 157–168 CrossRef CAS.
- E. J. Marek and E. G.-C. Conde, Effect of catalyst preparation and storage on chemical looping epoxidation of ethylene, Chem. Eng. J., 2021, 417, 127981 CrossRef CAS.
- J. E. Van Den Reijen, W. C. Versluis, S. Kanungo, M. F. d’Angelo, K. P. de Jong and P. E. de Jongh, From qualitative to quantitative understanding of support effects on the selectivity in silver catalyzed ethylene epoxidation, Catal. Today, 2019, 338, 31–39 CrossRef CAS.
- A. P. Amrute, J. De Bellis, M. Felderhoff and F. Schüth, Mechanochemical synthesis of catalytic materials, Chem. – Eur. J., 2021, 27, 6819–6847 CrossRef CAS PubMed.
- C. R. Brundle and B. V. Crist, J. Vac. Sci. Technol., A, 2020, 38, 041001 CrossRef CAS.
- G. L. Messing, Calcination and Phase Transformations, Encycl, Mater. Sci. Technol., 2001, 887–892 Search PubMed.
- B. Sreedhar, M. Sulochana, C. S. Vani, D. K. Devi and N. V. S. Naidu, Shape evolution of strontium carbonate architectures using natural gums as crystal growth modifiers, Eur. Chem. Bull., 2014, 3, 234–239 Search PubMed.
- Y. H. Chen, Y. C. Huang and W. D. Jiang, Study on thermal properties of nanocrystalline strontianite, J. Non. Cryst. Solids., 2010, 356, 1530–1532, DOI:10.1016/j.jnoncrysol.2010.04.026.
- X. Zhang, Y. Yang, X. Lv, Y. Wang and L. Cui, Effects of Preparation Method on the Structure and Catalytic Activity of Ag–Fe2O3 Catalysts Derived from MOFs, Catalysts, 2017, 7(12), 382 CrossRef.
- S. Gabra, E. J. Marek, S. Poulston, G. Williams and J. S. Dennis, The use of strontium ferrite perovskite as an oxygen carrier in the chemical looping epoxidation of ethylene, Appl. Catal., B, 2021, 286, 119821 CrossRef CAS.
- C. H. Bartholomew and R. J. Farrauto, Fundamentals of industrial catalytic processes, John Wiley & Sons, 2011 Search PubMed.
- M. C. N. A. de Carvalho, F. B. Passos and M. Schmal, Study of the active phase of silver catalysts for ethylene epoxidation, J. Catal., 2007, 248, 124–129 CrossRef.
- J. Huang, D. Resendez and G. Tran, Ethylene Oxide Reactor System, JEO Assoc., 1999, 1–17 Search PubMed.
- M. D. Argyle and C. H. Bartholomew, Heterogeneous catalyst deactivation and regeneration: a review, Catalysts, 2015, 5, 145–269 CrossRef CAS.
- Z. Saroukhani, N. Tahmasebi, S. M. Mahdavi and A. Nemati, Effect of working pressure and annealing temperature on microstructure and surface chemical composition of barium strontium titanate films grown by pulsed laser deposition, Bull. Mater. Sci., 2015, 38, 1645–1650, DOI:10.1007/s12034-015-0982-0.
- A. E. Bocquet, A. Fujimori, T. Mizokawa, T. Saitoh, H. Namatame, S. Suga, N. Kimizuka, Y. Takeda and M. Takano, Electronic structure of ${\mathrm{SrFe}}^{4 + }$${\mathrm{O}}_{3}$ and related Fe perovskite oxides, Phys. Rev. B: Condens. Matter Mater. Phys., 1992, 45, 1561–1570, DOI:10.1103/PhysRevB.45.1561.
- N. H. Batis, P. Delichere and H. Batis, Physicochemical and catalytic properties in methane combustion of La1−xCaxMnO3±y (0 ≤ x ≤ 1; −0.04 ≤ y ≤ 0.24) perovskite-type oxide, Appl. Catal., A, 2005, 282, 173–180, DOI:10.1016/j.apcata.2004.12.009.
- M. Ghaffari, M. Shannon, H. Hui, O. K. Tan and A. Irannejad, Preparation, surface state and band structure studies of SrTi(1−x)Fe(x)O(3−δ) (x = 0–1) perovskite-type nano structure by X-ray and ultraviolet photoelectron spectroscopy, Surf. Sci., 2012, 606, 670–677, DOI:10.1016/j.susc.2011.12.013.
- T. V. Aksenova, L. Y. Gavrilova, A. A. Yaremchenko, V. A. Cherepanov and V. V. Kharton, Oxygen nonstoichiometry, thermal expansion and high-temperature electrical properties of layered NdBaCo2O5+δ and SmBaCo2O5+δ, Mater. Res. Bull., 2010, 45, 1288–1292, DOI:10.1016/j.materresbull.2010.05.004.
- J. Deng, L. Zhang, H. Dai, H. He and C. T. Au, Hydrothermally fabricated single-crystalline strontium-substituted lanthanum manganite microcubes for the catalytic combustion of toluene, J. Mol. Catal. A Chem., 2009, 299, 60–67, DOI:10.1016/j.molcata.2008.10.006.
- C. Yao, J. Meng, X. Liu, X. Zhang, F. Meng, X. Wu and J. Meng, Effects of Bi doping on the microstructure, electrical and electrochemical properties of La2−xBixCu0.5Mn1.5O6 (x = 0, 0.1 and 0.2) perovskites as novel cathodes for solid oxide fuel cells, Electrochim. Acta, 2017, 229, 429–437, DOI:10.1016/j.electacta.2017.01.153.
- E. J. Marek, S. Gabra, J. S. Dennis and S. A. Scott, High selectivity epoxidation of ethylene in chemical looping setup, Appl. Catal., B, 2020, 262, 118216 CrossRef CAS.
- M. Saccoccio, C. Jiang, Y. Gao, D. Chen and F. Ciucci, Nb-substituted PrBaCo2O5+Δ as a cathode for solid oxide fuel cells: A systematic study of structural, electrical, and electrochemical properties, Int. J. Hydrogen Energy, 2017, 42, 19204–19215, DOI:10.1016/j.ijhydene.2017.06.056.
- J. Lu, J. J. Bravo-Suárez, A. Takahashi, M. Haruta and S. T. Oyama, In situ UV–vis studies of the effect of particle size on the epoxidation of ethylene and propylene on supported silver catalysts with molecular oxygen, J. Catal., 2005, 232, 85–95 CrossRef CAS.
- J. T. Jankowiak and M. A. Barteau, Ethylene epoxidation over silver and copper-silver bimetallic catalysts: I. Kinetics and selectivity, J. Catal., 2005, 236, 366–378, DOI:10.1016/j.jcat.2005.10.018.
- J. T. Jankowiak and M. A. Barteau, Ethylene epoxidation over silver and copper-silver bimetallic catalysts: II. Cs and Cl promotion, J. Catal., 2005, 236, 379–386, DOI:10.1016/j.jcat.2005.10.017.
- D. Lafarga and A. Varma, Ethylene epoxidation in a catalytic packed-bed membrane reactor: Effects of reactor configuration and 1,2-dichloroethane addition, Chem. Eng. Sci., 2000, 55, 749–758, DOI:10.1016/S0009-2509(99)00368-1.
Footnote |
| † Electronic supplementary information (ESI) available. See DOI: https://doi.org/10.1039/d4ma00485j |
| This journal is © The Royal Society of Chemistry 2024 |

