 Open Access Article
Creative Commons Attribution 3.0 Unported Licence
Effects of variation in phenylpyridinyl and di-tert-butyl-carbazolyl substituents of benzene on the performance of the derivatives in colour-tuneable white and exciplex-based sky-blue light-emitting diodes†
Simas
Macionis
a,
Dalius
Gudeika
a,
Oleksandr
Bezvikonnyi
ab,
Serhii
Melnykov
c,
Liliya
Guminilovych
 c,
Jurate
Simokaitiene
a,
Svetlana
Sargsyan
d,
Rasa
Keruckiene
 a,
Dmytro
Volyniuk
 a,
Pavlo
Stakhira
c and
Juozas V.
Grazulevicius
 *a
*a
aDepartment of Polymer Chemistry and Technology, Faculty of Chemical Technology, Kaunas University of Technology, Barsausko st. 59, LT-51423, Kaunas, Lithuania. E-mail: juozas.grazulevicius@ktu.lt
bDepartment of Physics, Faculty of Mathematics and Natural Science, Kaunas University of Technology, Studentu st. 50, LT-51368, Kaunas, Lithuania
cDepartment of Electronic Engineering, Lviv Polytechnic National University, Stepan Bandera st. 12, 79013, Lviv, Ukraine
dDepartment of Organic Chemistry, Faculty of Chemistry, Yerevan State University, A. Manoogian 1, Yerevan 0025, Armenia
First published on 29th May 2024
Abstract
Probing a multiple substituent approach, three derivatives of benzene substituted by phenylpyridinyl and di-tert-butyl-carbazolyl moieties are exploited with the aim to develop efficient emitters for organic light emitting diodes. The impact of the number and the nature of the substituents of benzene on the properties of the target compounds is discussed. The compound containing four tert-butyl-carbazole moieties forms a molecular glass with a very high glass transition temperature of 211 °C. The ionization potentials of the compounds range from 5.48 to 5.62 eV. The compounds show bipolar or unipolar charge transport with hole mobility reaching 4 × 10⁻⁴ cm2 V−1 s−1 at an electric field of 9 × 10⁵ V cm−1. The compounds show deep-blue fluorescence with quantum efficiency of the solid samples of up to 33%. It is shown that the emission of the compounds arises from the relaxation of hybridised local and charge transfer states. This property allows the development of colour-tuneable white organic light-emitting diodes. White electroluminescence is achieved due to overlapping of the emissions from the compounds and the different intensities of electroplex emission of the hole-transporting layer at different applied voltages. The fabricated devices reach an external quantum efficiency of 5.2%. They show an adjustable colour temperature of electroluminescence from 3339 to 6562 K. Sky-blue organic light-emitting diodes exploiting the combination of exciplex-forming properties of the compounds and thermally activated delayed fluorescence with an external quantum efficiency of 4.1% are demonstrated.
Introduction
In the last three decades organic light-emitting diodes (OLEDs) have experienced substantial growth with respect to both development and technology. Since their early realization by Van Slyke and Tang in the late 1980s,1 OLEDs have made a strong foothold in the market of display and illumination technologies. OLEDs offer higher image quality, a wider range of operating temperatures, and mechanical and structural flexibility, compared to their rival inorganic alternatives.2,3 However, the concerns with OLED technology are energy consumption, device lifetimes and overall sustainability.4 This is especially relevant today, with growing concerns about climate change as well as the technological shift towards more sustainable solutions. With these concerns in mind, researchers around the world contribute towards the development of device efficiency enhancing technologies. Employment of excitons and realization of charge balance in OLEDs play a huge role in achieving these goals.5 The careful combination of an organic emitter with an exciplex forming host as well as the tuning of injection and transport of carriers in devices play a pivotal role in increasing the external quantum efficiency (EQE) and decreasing the operational voltage, which in turn, can increase the power efficiency of OLEDs.The discovery of thermally activated delayed fluorescence (TADF) has made a big impact on the further development of OLED technology.6 Utilisation of triplet emission in combination with other approaches such as triplet–triplet annihilation, electrophosphorescence, formation of excitons etc. enabled the breaking of the internal quantum efficiency limit of 25%.7 Typically, donor and acceptor moieties of TADF materials are highly twisted with respect to each other. This results in a low energy gap (ΔEST) between the first excited singlet (S1) and triplet (T1) states, which in turn can facilitate charge carrier balance, promoting efficient exciton recombination.8 The selection of appropriate donor and acceptor moieties is of great importance in the development of efficient TADF materials. Different donors such as acridine, phenoxazine and phenazine have been successfully used in the development of TADF emitters.9 However, carbazole remains one of the most widely used donors.10 1,2,3,5-Tetrakis(carbazol-9-yl)-4,6-dicyanobenzene (4CzIPN) is one of the most widely studied TADF emitters containing several carbazolyl groups; it is composed of a central dicyanobenzene acceptor unit, to which four carbazolyl moieties as donor fragments are linked.6 Many compounds having a similar framework have been reported since then, which showed excellent performance in OLEDs.11–13 The use of pyridine derivatives as electron accepting moieties in the synthesis of TADF materials for OLEDs resulted in significant results. Derivatives of pyridinyl substituted triazine showed TADF which allowed obtaining OLEDs with an EQE of up to 13% at a very high luminance of 10![[thin space (1/6-em)]](https://www.rsc.org/images/entities/char_2009.gif) 000 cd m−2.14 Carbazolyl-substituted phenylpyridines were also reported as TADF emitters. Using these emitters OLEDs with an EQE of 16% were fabricated.15 White light-emitting diodes (WOLEDs) employing TADF compounds can show a very high-power efficiency of 130 lm W−1.16 Colour-tuneable white OLEDs (CT-WOLEDs) have potential applications in decoration and healthy lighting. They allow wide tuning of the Commission Internationale de l’Eclairage (CIE) coordinates of emission, colour temperatures (TC) and colour rendering indexes (CRI) by applying different voltages.17–22 Several types of emitters were used in CT-WOLEDs including TADF emitters. For example, TADF CT-WOLEDs with tuneable CIE coordinates from (0.55, 0.39) to (0.41, 0.38), TC from 1708 to 3212 K, and CRI from 77 to 8723 were reported. It should be noted that most of the CT-WOLEDs have complicated device structures with several light emitting layers. The simplification of the structures of CT-WOLEDs and widening of the tunability of their CIE coordinates, TC and CRI are expected, when appropriate light-emitting materials are available.
000 cd m−2.14 Carbazolyl-substituted phenylpyridines were also reported as TADF emitters. Using these emitters OLEDs with an EQE of 16% were fabricated.15 White light-emitting diodes (WOLEDs) employing TADF compounds can show a very high-power efficiency of 130 lm W−1.16 Colour-tuneable white OLEDs (CT-WOLEDs) have potential applications in decoration and healthy lighting. They allow wide tuning of the Commission Internationale de l’Eclairage (CIE) coordinates of emission, colour temperatures (TC) and colour rendering indexes (CRI) by applying different voltages.17–22 Several types of emitters were used in CT-WOLEDs including TADF emitters. For example, TADF CT-WOLEDs with tuneable CIE coordinates from (0.55, 0.39) to (0.41, 0.38), TC from 1708 to 3212 K, and CRI from 77 to 8723 were reported. It should be noted that most of the CT-WOLEDs have complicated device structures with several light emitting layers. The simplification of the structures of CT-WOLEDs and widening of the tunability of their CIE coordinates, TC and CRI are expected, when appropriate light-emitting materials are available.
With the above aim, we present three organic emitters, the molecular design of which is based on a pyridinyl substituted benzene core as an electron accepting unit with different numbers of 3,6-di-tert-buthylcarbazolyl substituents as electron donating units. Several other carbazole and pyridine derivatives were successfully applied in OLEDs.24–26 However, they were typically used as charge-transporting materials and as hosts.27,28 The derivatives of carbazole and pyridine were reported as emitters for ultraviolet OLEDs with electroluminescence (EL) peaking at 394 nm and a narrow full-width at half maximum (FWHM) of 17 nm.29 These emitters were characterised by their triplet harvesting abilities via high-laying triplet → singlet reverse intersystem crossing (RISC), allowing fabrication of OLEDs with an EQE of 3.6%. We modified this design strategy by exploiting variation in the number of pyridinyl and di-tert-butyl-carbazolyl substituents of benzene. As a result, we significantly improved the thermal stability of the compounds. Their 5% mass loss temperatures range from 362 to 411 °C. The glass transition temperature of one compound is as high as 211 °C. The synthesized compounds exhibit exciplex-forming properties, enabling the utilisation of TADF for single-colour OLEDs with EQEs of up to 4.1%. Moreover, the compounds demonstrate emission resulting from the relaxation of hybridised local charge transfer states. Such performance, together with the electroplex emission of the hole-transporting layer, is demonstrated to be useful for the development of CT-WOLEDs with EQEs of up to 5.2%. The CIE coordinates of the developed CT-WOLEDs can be tuned from (0.3, 0.34) to (0.42, 0.42), TC can be changed from 6244 to 3061 K, and CRI can be tuned from 78 to 65 by changing the applied voltage from 11 to 19 V.
Experimental section
Materials
Pyridin-4-ylboronic acid, 2-bromo-1,3-difluorobenzene, 2-bromo-1,3,5-trifluorobenzene and 1,3-dibromo-2,4,5,6-tetrafluorobenzene were purchased from Sigma-Aldrich and used as received without any further purification. Potassium carbonate (K2CO3), bis(triphenylphosphine)palladium(II) dichloride (PdCl2(PPh3)2), sodium sulfate (Na2SO4) and cesium carbonate (Cs2CO3) were purchased from Fluorochem and used as received without any further purification. 3,6-Di-tert-butylcarbazole was synthesized according to the procedure described in ref. 30. Silica gel 60 Å was used for column chromatography and thin layer chromatography (TLC) plates were purchased from Sigma-Aldrich.![[thin space (1/6-em)]](https://www.rsc.org/images/entities/char_2009.gif) :
:![[thin space (1/6-em)]](https://www.rsc.org/images/entities/char_2009.gif) 1). The resulting mixture was degassed three times, then PdCl2(PPh3)2 (0.1 g, 0.15 mmol) was added, and the reaction temperature was increased to 100 °C and left to stir for 12 h in a N2 atmosphere. After completion, the crude product was extracted using ethyl acetate and dried using Na2SO4. The target product was purified using column chromatography (eluent–THF 1/HEX 10) and then recrystallized from chloroform/methanol to afford 2FPy as white crystals (0.25 g, 37% yield). 1H NMR (400 MHz, CDCl3) δ 8.71 (d, J = 4.8 Hz, 2H), 7.42 (d, J = 4.6 Hz, 2H), 7.43–7.34 (m, 1H), 7.07–6.97 (m, 2H).
1). The resulting mixture was degassed three times, then PdCl2(PPh3)2 (0.1 g, 0.15 mmol) was added, and the reaction temperature was increased to 100 °C and left to stir for 12 h in a N2 atmosphere. After completion, the crude product was extracted using ethyl acetate and dried using Na2SO4. The target product was purified using column chromatography (eluent–THF 1/HEX 10) and then recrystallized from chloroform/methanol to afford 2FPy as white crystals (0.25 g, 37% yield). 1H NMR (400 MHz, CDCl3) δ 8.71 (d, J = 4.8 Hz, 2H), 7.42 (d, J = 4.6 Hz, 2H), 7.43–7.34 (m, 1H), 7.07–6.97 (m, 2H).
![[thin space (1/6-em)]](https://www.rsc.org/images/entities/char_2009.gif) :
:![[thin space (1/6-em)]](https://www.rsc.org/images/entities/char_2009.gif) 1). The resulting mixture was degassed three times, then PdCl2(PPh3)2 (0.1 g, 0.15 mmol) was added, and the reaction temperature was increased to 100 °C and left to stir for 12 h in a N2 atmosphere. After completion, the crude product was extracted using ethyl acetate and dried using Na2SO4. The target product was purified using column chromatography (eluent–THF 1/HEX 10) and then recrystallized from chloroform/methanol to afford 3FPy as white crystals (0.19 g yield 65%). 1H NMR (400 MHz, CDCl3) δ 8.64 (d, J = 4.9 Hz, 2H), 7.31 (d, J = 4.5 Hz, 2H), 6.74 (t, J = 8.2 Hz, 2H).
1). The resulting mixture was degassed three times, then PdCl2(PPh3)2 (0.1 g, 0.15 mmol) was added, and the reaction temperature was increased to 100 °C and left to stir for 12 h in a N2 atmosphere. After completion, the crude product was extracted using ethyl acetate and dried using Na2SO4. The target product was purified using column chromatography (eluent–THF 1/HEX 10) and then recrystallized from chloroform/methanol to afford 3FPy as white crystals (0.19 g yield 65%). 1H NMR (400 MHz, CDCl3) δ 8.64 (d, J = 4.9 Hz, 2H), 7.31 (d, J = 4.5 Hz, 2H), 6.74 (t, J = 8.2 Hz, 2H).
![[thin space (1/6-em)]](https://www.rsc.org/images/entities/char_2009.gif) :
:![[thin space (1/6-em)]](https://www.rsc.org/images/entities/char_2009.gif) 1). The resulting mixture was degassed three times, then PdCl2(PPh3)2 (0.1 g, 0.15 mmol) was added, and the reaction temperature was increased to 100 °C and left to stir for 12 h in a N2 atmosphere. After completion, the crude product was extracted using ethyl acetate and dried using Na2SO4. The target product was purified using column chromatography (eluent–THF 1/HEX 10) and then recrystallized from chloroform/methanol to afford 4FPy as white crystals (0.12 g yield 42%). 1H NMR (400 MHz, CDCl3) δ 8.76 (d, J = 4.8 Hz, 4H), 7.36 (d, J = 4.6 Hz, 4H).
1). The resulting mixture was degassed three times, then PdCl2(PPh3)2 (0.1 g, 0.15 mmol) was added, and the reaction temperature was increased to 100 °C and left to stir for 12 h in a N2 atmosphere. After completion, the crude product was extracted using ethyl acetate and dried using Na2SO4. The target product was purified using column chromatography (eluent–THF 1/HEX 10) and then recrystallized from chloroform/methanol to afford 4FPy as white crystals (0.12 g yield 42%). 1H NMR (400 MHz, CDCl3) δ 8.76 (d, J = 4.8 Hz, 4H), 7.36 (d, J = 4.6 Hz, 4H).
Results and discussion
Synthesis and theoretical calculations
A simple two-step synthesis method (Scheme 1) was employed to obtain compounds 2tCzPy, 3tCzPy and 4tCzPy. In the first step, utilizing the Suzuki cross-coupling method, pyridin-4-ylboronic acid was coupled with bromobenzenes containing different numbers of fluorine atoms at different positions to afford electron accepting intermediates 2FPy, 3FPy and 4FPy. In the second step, a nucleophilic substitution reaction was utilized to introduce electron donating 3,6-di-tert-butylcarbazole moieties and to form target compounds 2tCzPy, 3tCzPy and 4tCzPy.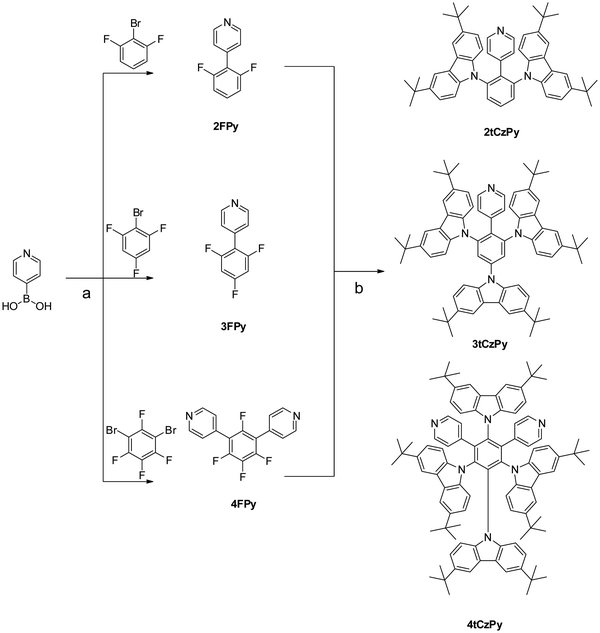 | ||
| Scheme 1 Combined synthesis scheme of compounds 2tCzPy, 3tCzPy and 4tCzPy: (a) PdCl2(PPh3)2, K2CO3, 1,4-dioxane/H2O, 100 °C, 12 h and (b) Cs2CO3, DMSO, 150 °C, 24 h. | ||
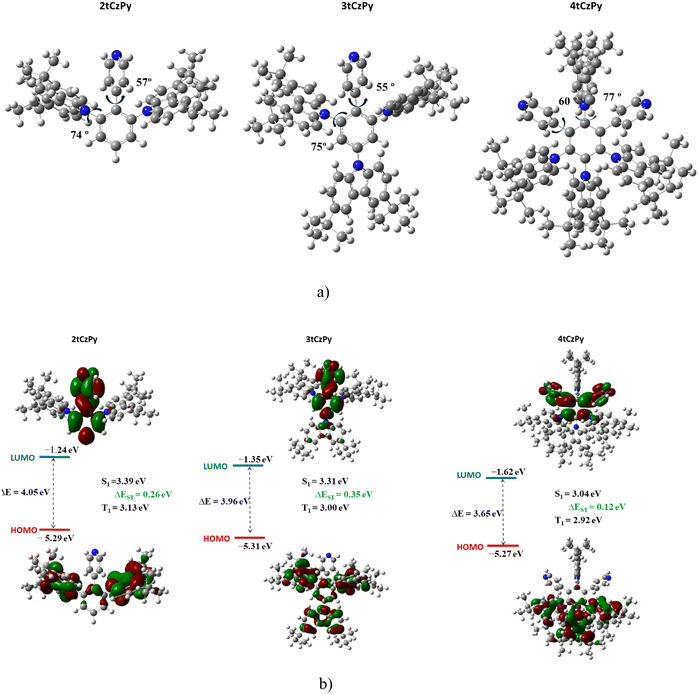
The geometries and electronic structures of the target molecules were analysed using DFT calculations at the B3LYP/6-31++G theoretical level. To evaluate the electronic transitions, the geometries of the phenylpyridinyl-based compounds 2tCzPy, 3tCzPy and 4tCzPy were evaluated (Fig. 1(a)). As the acceptor and donor moieties are linked through a phenyl bridge, the values of the dihedral angles are crucial for intramolecular charge transfer (ICT). In the optimized ground-state geometries, the D and A fragments are quite planarly orientated, as their dihedral angle values are close to 60°, whereas the carbazole moieties are twisted by ca. 74°. Such large dihedral angle values are expected to lead to minimal conjugation of the D–A fragments.
The calculated HOMOs and LUMOs are presented in Fig. 1(b). The electronic structures of all three target compounds are similar. The HOMOs are situated on the electron-donating fragments of carbazole, with a small electron density residing on the bridging phenyl ring. However, the LUMO is distributed on the phenylpyridinyl fragment. The calculated HOMO values are similar indicating similar electronic structures of the molecules. The higher LUMO value of 4tCzPy indicates a stronger electron accepting character due to a synergistic molecular orbital distribution on two acceptor moieties.
Thermal and electrochemical properties
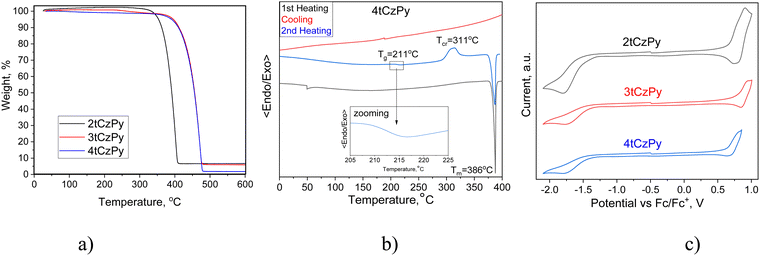
The thermal properties of the synthesised compounds were characterised by thermogravimetric analysis (TGA) and differential scanning calorimetry (DSC). Compounds 2tCzPy, 3tCzPy and 4tCzPy exhibited excellent thermal stability. Their 5% mass loss temperatures were recorded to be 362, 411 and 409 °C, respectively (Fig. 2(a)). The single-stage practically complete loss of mass of the compounds observed during TGA measurements indicates that these values correspond to the temperatures at which the sublimation begins, but not thermal degradation. All the compounds were obtained as crystalline substances. Compound 2tCzPy exhibited a significantly lower melting temperature (49 °C) in comparison to 3tCzPy and 4tCzPy (432 and 386 °C, respectively) (Fig. 2(b)). During cooling scans, the sample of 2tCzPy formed crystals at 28 °C while 3tCzPy exhibited the signal of crystallization at 334 °C. Meanwhile, the sample of 4tCzPy did not show any signal of crystallization during DSC cooling scans. The sample of 4tCzPy showed glass transition at 211 °C followed by crystallization at 311 °C (Fig. 2(b)). The summary of the data obtained from TGA and DSC measurements is detailed in Table 1. For compound 3tCzPy, a higher melting temperature (432 °C) than 5% mass loss temperature (411 °C) was observed, confirming sublimation of the compound during TGA. Compound 4tCzPy possesses molecular glass-forming properties with a very high glass transition temperature (Tg) of 211 °C. Such Tg allows overcoming the effects of the Joule heating of optoelectronic devices. This value is much higher than the Tg (84–109 °C) of previously reported di-tert-butyl-carbazole-based TADF materials.31 It is also considerably higher than Tg of most organic semiconductors used in OLEDs, including 4CzIPN with a Tg of 176 °C.32 The possible reasons for the high Tg of 4tCzPy can be its relatively high molecular weight and the ability of the pyridine moiety to take part in hydrogen bonding.33| Compound | T −5%, °C | T m, °C | T g, °C | T cr, °C |
E
oxonset![[thin space (1/6-em)]](https://www.rsc.org/images/entities/char_2009.gif) vs. vs.![[thin space (1/6-em)]](https://www.rsc.org/images/entities/char_2009.gif) Fc, V Fc, V |
E
redonset![[thin space (1/6-em)]](https://www.rsc.org/images/entities/char_2009.gif) vs. vs.![[thin space (1/6-em)]](https://www.rsc.org/images/entities/char_2009.gif) Fc, V Fc, V |
IPCV, eV | EACV, eV |
|---|---|---|---|---|---|---|---|---|
T
−5% – 5% mass loss temperature, Tm – melting temperature, Tcr – crystallization temperature, Tg – glass transition temperature, Eoxonset – oxidation potential measured from CV; Eredonset – reduction potential measured from CV; IPCV – ionization potential, calculated from IPCV = Eoxonset![[thin space (1/6-em)]](https://www.rsc.org/images/entities/char_2009.gif) vs. vs.![[thin space (1/6-em)]](https://www.rsc.org/images/entities/char_2009.gif) Fc + 4.8; EACV – electron affinity, calculated from EACV = Eredonset Fc + 4.8; EACV – electron affinity, calculated from EACV = Eredonset![[thin space (1/6-em)]](https://www.rsc.org/images/entities/char_2009.gif) vs. vs.![[thin space (1/6-em)]](https://www.rsc.org/images/entities/char_2009.gif) Fc + 4.8. Fc + 4.8. |
||||||||
| 2tCzPy | 362 | 49 | — | 28 | 0.64 | −1.33 | 5.44 | 3.47 |
| 3tCzPy | 411 | 432 | — | 334 | 0.77 | −1.40 | 5.57 | 3.40 |
| 4tCzPy | 409 | 386 | 211 | 311 | 0.63 | −1.40 | 5.43 | 3.40 |
Cyclic voltammetry (CV) was used to investigate the electrochemical properties of compounds 2tCzPy, 3tCzPy and 4tCzPy. CV curves are shown in Fig. 2(c). All the synthesized compounds demonstrated reversible oxidation due to the 3,6-positions of carbazole fragments being occupied by di-tert-butyl substituents. Alternatively, all the compounds demonstrated irreversible reduction, caused by electrochemically active pyridine fragments. The oxidation potential values for compounds 2tCzPy, 3tCzPy and 4tCzPy were obtained to be 0.64, 0.77 and 0.63 eV, respectively. Meanwhile, reduction potential values were found to be −1.33, −1.40 and −1.40, respectively. Ionisation potential (IPCV) and electron affinity (EACV) values were calculated from the CV oxidation and reduction onset potentials against ferrocene. The summary of data obtained from CV measurements is detailed in Table 1. The IPcv values estimated for 2tCzPy, 3tCzPy and 4tCzPy were found to be comparable (5.43–5.57 eV). The electron affinity values calculated for the compounds were also comparable (3.40–3.47 eV).
Photophysical properties
The influence of phenylpyridine and di-tert-butyl-carbazole moieties in the molecular structures of 2tCzPy, 3tCzPy and 4tCzPy on their photophysical properties was studied using absorption and photoluminescence (PL) spectroscopy (Fig. 3). To study electronic transitions of the compounds in the ground and excited states, absorption and PL spectra of their solutions in solvents with a wide range of polarity (dielectric constant (ε) and orientation polarizability (Δf)) were recorded. Hexane (ε = 1.90; Δf = 0.0012), toluene (ε = 2.38; Δf = 0.014), chloroform (ε = 4.81; Δf = 0.15), tetrahydrofuran (THF) (ε = 7.6; Δf = 0.210), dichloromethane (DCM) (ε = 0.217, Δf = 0.217), acetone (ε = 20.7; Δf = 0.284), and acetonitrile (ε = 37.5; Δf = 0.305)34 were used as solvents. Absorption spectra of the dilute solutions of all three compounds were found to be similar with the bands in the range of 300–350 nm (Fig. 3(a)–(c)). The low-energy bands exhibited distinct vibrational structures with well-resolved 0–0 and 0–1 transitions at 335 and 322 nm, respectively. The 0–2 transition at 309 nm is also seen as a shoulder. Theoretically calculated UV spectra (for toluene solution) indicate that there is only slight contribution from the S1 state to the UV-vIS spectra presented in Fig. S3a (ESI†). The oscillator strength values of the 0–1 transition range from 0 for 2tCzPy to 0.0377 for 4tCzPy indicating no steric hindrance between the molecular fragments. This results in an increased overlap of the orbitals. The UV bands observed in Fig. S3a (ESI†) originate from the excited states higher in energy (see Fig. S3b, ESI†). The theoretical UV spectrum of 2tCzPy is dominated by 0–7 and 0–14 transitions. These transitions can be attributed to H → L+1 and H−3 → L+1 transitions with high oscillator strength values (Fig. S3b, ESI†). These transitions originate from the locally excited (LE) states of the carbazole moiety35,36 as well as from small charge transfer (CT) resulting in HLCT. Theoretical UV spectra of compounds 3tCzPy and 4tCzPy are dominated by 0–3 and 0–5 transitions. These transitions can be attributed to H−2 → L and H−1 → L+1, respectively, from carbazole fragments towards the acceptor moieties resulting in HLCT. Comparison of the low-energy edges of the experimental absorption spectra of toluene solutions (Fig. S2a, ESI†) revealed an increase in the intensity of the tails in the order of 2tCzPy → 3tCzPy → 4tCzPy. This observation can be explained by the formation of intramolecular CT states in the ground state. Similar low-energy bands with the same trend for the low-energy edges were observed for the films of 2tCzPy, 3tCzPy and 4tCzPy (Fig. S2b, ESI†).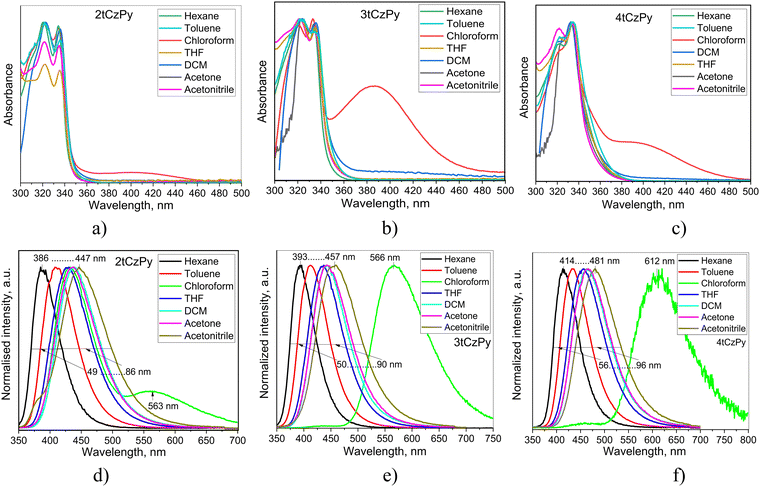 | ||
| Fig. 3 Absorption (a)–(c) and PL (d)–(f) spectra of the dilute solutions of compounds 2tCzPy, 3tCzPy and 4tCzPy in different solvents. | ||
The solutions of 2tCzPy, 3tCzPy, and 4tCzPy in most of the solvents used showed similar absorption spectra. These transitions originated from LE states of carbazole.35,36 Since the LE states of the pyridine moieties manifest at wavelengths shorter than 300 nm,37 the overlapping of the absorption bands of pyridine and di-tert-butyl-carbazole caused absorption at energies higher than 4.1 eV. Comparison of the low-energy edges of the absorption spectra of toluene solutions (Fig. S2a, ESI†) revealed an increase in the intensity of the tails in the order of 2tCzPy → 3tCzPy → 4tCzPy. This observation can be explained either by the conjugation effects or by the formation of intramolecular charge-transfer (CT) states in the ground state. Similar low-energy bands with the same trend for the low-energy edges were observed for the films of 2tCzPy, 3tCzPy and 4tCzPy (Fig. S2b, ESI†). In addition, a high energy structured band peaking at 290 nm could be observed in the absorption spectra of the films. This band can be attributed to the absorption of carbazole.35,36 Because of the cutoff of toluene at ca. 300 nm, the high-energy band at 290 nm was not detected in the spectra of toluene solutions. The solutions of 2tCzPy, 3tCzPy, and 4tCzPy in most of the solvents used showed similar absorption spectra. The exceptions were the spectra of the solutions in chloroform and partially in DCM. In the spectra of the solutions in chloroform, new absorption bands were observed at 401 nm for 2tCzPy, at 387 nm for 3tCzPy, and at 392 nm for 4tCzPy. To explain this observation, nonlinear solute–solvent interactions, e.g., formation of hydrogen bonds between the solute and solvent, could be taken into account.38 Indeed, the intermolecular complex of pyridine with chloroform was previously reported.39 Most probably, the formation of complexes between the pyridine moieties of 2tCzPy, 3tCzPy, and 4tCzPy and chloroform results in the appearance of a low-energy band in absorption spectra of chloroform solutions (Fig. 3(a)–(c)). Hydrogen bonds could assist in the formation of complexes of pyridine containing compounds 2tCzPy, 3tCzPy, and 4tCzPy with chloroform inducing further geometrical structural changes in the molecules as previously reported for pyridine containing compounds.40 It should be noted that the emission of chloroform solutions of the studied compounds resulted not only from CT between phenylpyridine and di-tert-butyl-carbazole moieties but also from the complexes of the compounds with chloroform (Fig. 3(d)–(f)). For example, the solution of 2tCzPy in chloroform is characterised by PL spectra with the CT-originated band at 432 nm and the band of the exciplex-like CT emission of the complex of 2tCzPy with chloroform which appeared at 563 nm.38 PL spectra of chloroform solutions of 3tCzPy and 4tCzPy showed two low-energy bands at 438/566 nm and 462/612 nm, respectively. The bands observed at 563 nm for 2tCzPy, at 566 nm for 3tCzPy, and at 612 nm for 4tCzPy were very sensitive to oxygen (Fig. S2c, ESI†). After deoxygenation, long-lived fluorescence was detected in chloroform solutions. This observation indicates that the exciplex emission of the complexes of the compounds with chloroform exhibits TADF (Fig. S2c, ESI†).
In contrast to other compounds having several carbazolyl moieties which showed TADF,41–43 the PL spectra of toluene solutions of 2tCzPy, 3tCzPy and 4tCzPy were characterised by the relatively low full width at half maxima (FWHM) of 62–68 nm (Fig. 3(d)–(f)). The red-shift of PL spectra is related to the number of electron-donating di-tert-butyl-carbazole and electron-accepting 4-phenylpyridine fragments in the compounds (Fig. 3(d)–(f)). The broadening of FWHM of the PL spectra of the solutions was observed with the increase of the polarity of the solvents. The wavelengths of intensity maxima of the PL spectra of the toluene solutions of 2tCzPy, 3tCzPy and 4tCzPy were found to be 410, 412, and 432 nm, respectively. Photoluminescence quantum yields (PLQYs) of the as-prepared toluene solutions of compounds 2tCzPy, 3tCzPy and 4tCzPy were recorded as 20, 18 and 11%, respectively (Table 2). After deoxygenation, the PL intensity was enhanced due to the alleviation of quenching of triplet states. Thus, an increase in PLQY values can be expected for compounds in an inert atmosphere. PL intensity maxima for the films of 2tCzPy and 3tCzP were observed at 407 nm, while the emission of 4tCzPy was red-shifted and peaked at 430 nm. PLQYs of thin films of compounds 2tCzPy, 3tCzPy and 4tCzPy were recorded as 16, 7 and 7%, respectively. Hosting and deoxygenation can help to improve the PLQY values, as will be discussed below.
| Compound | Media | 2tCzPy | 3tCzPy | 4tCzPy |
|---|---|---|---|---|
| a At an electric field of 1.8 × 10⁶ V cm−1. b At an electric field of 0.9 × 10⁶ V cm−1. | ||||
| Φ PL, % | Toluene/film/mCBP/DPEPO | 20/16/20/11 | 18/7/33/10 | 11/7/13/18 |
| S1/T1/ΔEST, eV | THF, 77 K | 3.31/3.08/0.25 | 3.31/3.07/0.24 | 3.19/3.03/0.14 |
| I PEP, eV | Film | 5.62 | 5.62 | 5.48 |
| E g, eV | 3.58 | 3.51 | 3.32 | |
| E PEA, eV | 2.11 | 2.11 | 2.16 | |
| μ e, cm2 V−1 s−1 | 1.5 × 10⁻⁴![[thin space (1/6-em)]](https://www.rsc.org/images/entities/char_2009.gif) a a |
— | — | |
| μ h, cm2 V−1 s−1 | 1.2 × 10⁻⁴![[thin space (1/6-em)]](https://www.rsc.org/images/entities/char_2009.gif) a a |
— | 4 × 10⁻⁴![[thin space (1/6-em)]](https://www.rsc.org/images/entities/char_2009.gif) b b |
|
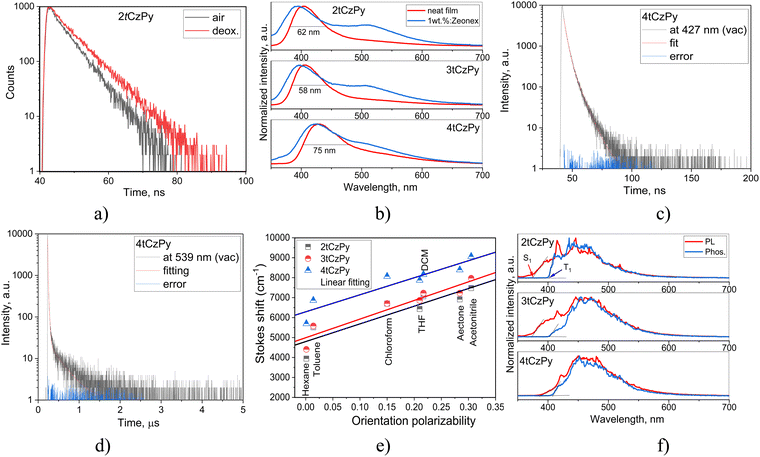
PL decay curves were recorded in the nanosecond range for the toluene solutions, with slight oxygen sensitivity detected (Fig. 4(a) and Fig. S2e, ESI†). Thus, prompt fluorescence was observed for 2tCzPy, 3tCzPy and 4tCzPy. The single exponential PL decay curves of the toluene solutions allow the exclusion of conventional TADF. The oxygen sensitivity can be related to triplet harvesting abilities of the studied compounds via hybridisation of LE and CT states (HLCT).44 This assumption is supported by the emission spectra of the solid samples of 2tCzPy, 3tCzPy and 4tCzPy (Fig. 4(b)). The PL spectra of neat films and of the films with their molecular dispersions in inert polymer Zeonex showed non-structured bands with tails or shoulders. It is evident from the data presented in Fig. 4(c), (d), Fig. S3, S4 and Tables S2, S3 (ESI†) that PL lifetimes of the film of 4tCzPy increase when the wavelengths of analysis are increased from the band maximum (427 nm) to the tail (539 nm). In addition, PL lifetimes increase after deoxygenation of the samples, when triplets are not quenched by oxygen. Such a behaviour is expected for HLCT emission. This enables the harvesting of triplets at low-energy wavelengths.44 Lippert–Mataga plots of Stokes shifts versus solvent orientation polarizability were used for the analysis of the solvatochromism of the solutions of 2tCzPy, 3tCzPy, and 4tCzPy.45 The expected two slopes typical for HLCT emissions were not observed (Fig. 4(e)).46,47 The slopes of Lippert–Mataga plots for 2tCzPy, 3tCzPy, and 4tCzPy were found to be 8864, 9332, and 8534 cm−1, respectively. These values might indicate the combination of HLCT emissions under varying conditions. They are too high for pure LE and too low for pure CT emission.
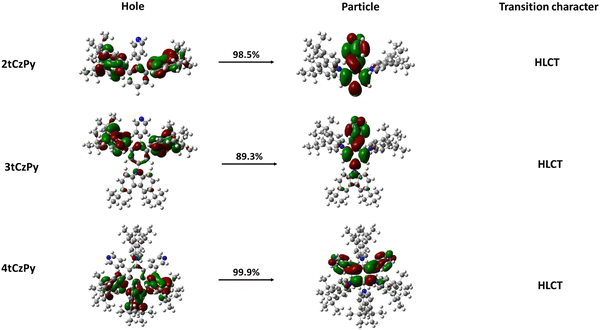
The dominant “hole” and “particle” contributions of the natural transition orbitals (NTOs) of the first excited states of the three target compounds were theoretically calculated and are illustrated in Fig. 5. The methodology of theoretical calculations corresponds to that of the previously published theoretical investigation of the HLCT state of electroactive compounds.48
All three target compounds exhibit similar transition character as a degree of balance between the spatial separation and partial overlap of NTOs is attained in the first excited state, indicating the existence of HLCT.
PL and phosphorescence (Phos.) spectra of THF solutions of compounds 2tCzPy, 3tCzPy and 4tCzPy recorded at 77 K are shown in Fig. 4(f). As shown by arrows for 2tCzPy, the values of the first singlet (S1) and triplet (T1) energy levels were estimated using the wavelengths of the onset of PL and Phos. spectra. All the compounds demonstrated similar triplet energies T1 close to 3 eV. Their singlet energies S1 decreased from 3.31 to 3.19 eV with the increase of the number of pyridine and di-tert-butyl-carbazole moieties in the molecular structures (Table 2). As a result, the singlet–triplet splitting (ΔEST) decreased from 0.25 eV observed for 2tCzPy to 0.14 eV estimated for 4tCzPy. Such relatively high values of ΔEST did not allow the prediction of conventional TADF properties for the compounds preventing the triplet excitons from efficiently relaxing to the S1 state by internal conversion. Theoretically calculated singlet and triplet energy splitting values are in accordance with the experimental results (see Fig. 1(b)).
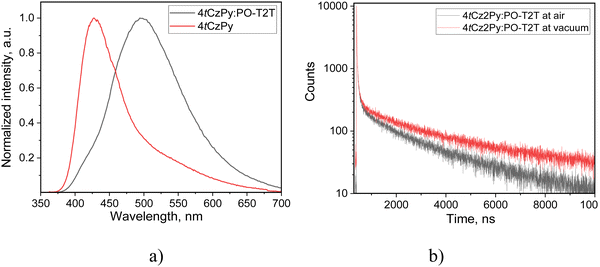
The photophysical properties of the molecular mixtures of 2tCzPy, 3tCzPy and 4tCzPy with exciplex-forming electron-accepting compound 2,4,6-tris[3-(diphenylphosphinyl)phenyl]-1,3,5-triazine (PO-T2T) were studied. PL spectra of the solid-state molecular mixtures of the compounds with PO-T2T were characterised by additional low-energy bands (Fig. 6(a) and Fig. S5, ESI†). This observation provides the evidence of the exciplex-forming properties of the studied compounds. The exciplex formation resulted in redshifts of the deep-blue emission of 2tCzPy, 3tCzPy, and 4tCzPy resulting in efficient TADF (Fig. 6(b) and Fig. S5, ESI†). The molecular dispersions of the compounds in hosts mCBP or DPEPO exhibited emissions of 2tCzPy, 3tCzPy or 4tCzPy with PLQY reaching 33% (Fig. S6, ESI† and Table 3).
| Device | EML | V on, V | Max. brightness, cd m−2 | CEmax, cd A−1 | PE max, lm W−1 | EQEmax% | CIE 1931 (x, y) | CRI | T C, K |
|---|---|---|---|---|---|---|---|---|---|
| a CIE, CRI and TC of devices W1–3 for EL spectra recorded at an applied voltage of 13 V. The calculations of CIE, CRI and TC were performed according to the methodology described in ref. 49. b CIE of devices E1–3 and ER for EL spectra recorded at 10 V. | |||||||||
| Colour-tuneable white OLEDs with structure ITO/CuI/TAPC/EML/TPBi/Ca/Al | |||||||||
| W1 | 2tCzPy (10 wt%):DPEPO | 8 | 6900 | 5.2 | 1.3 | 3.1 | (0.34, 0.35)a | 77a | 4772a |
| W2 | 3tCzPy (10 wt%):DPEPO | 6 | 10100 | 4.1 | 1.2 | 2 | (0.38, 0.36)a | 71a | 3964a |
| W3 | 4tCzPy (10 wt%):DPEPO | 8.4 | 8300 | 10.6 | 4.1 | 5.2 | (0.31, 0.34)a | 80a | 6143a |
| One-color exciplex-based OLEDs with structure ITO/HAT-CN/NPB/EBL/EML/PO-T2T/TSPO1/TPBi/LiF/Al | |||||||||
| E1 | 2tCzPy:PO-T2T (50 × 50 wt%) | 5.3 | 4800 | 12.7 | 3.3 | 3.1 | (0.17, 0.3)b | — | — |
| E2 | 3tCzPy:PO-T2T (50 × 50 wt%) | 7.1 | 2600 | 6.6 | 2.7 | 2.9 | (0.19, 0.33)b | — | — |
| E3 | 4tCzPy:PO-T2T (50 × 50 wt%) | 6.2 | 2400 | 9.8 | 4.6 | 4.1 | (0.19, 0.35)b | — | — |
| ER | mCP:PO-T2T (50 × 50 wt%) | 5.1 | 5300 | 6.2 | 3.3 | 3.3 | (0.16, 0.23)b | — | — |
Charge-injecting and charge-transporting properties
For the design of optoelectronic devices, the ionisation potential (IPESP) and electron affinities (EPESA) of the solid films of the active materials are required. Photoelectron emission spectroscopy (PES) allowed us to obtain IPESP values of the films of 2tCzPy, 3tCzPy and 4tCzPy (Fig. 7(a) and Table 2). The increase in the number of di-tert-butyl-carbazole moieties in the compounds lead to a decrease of IPESP values from 5.62 to 5.48 eV. These values indicate good hole-injection abilities when films are appropriately used in device structures. Direct measurements of EPESA values were not possible; therefore, we used the widely acceptable indirect calculations using the formula EPESA = IPESP − Eg. The optical band gaps (Eg) were taken from the absorption spectra of the films (Fig. S2b, ESI†). The calculated EPESA values of 2.11–2.16 eV are relatively low for the energy barrier-free electron-injection from cathodes such as LiF/Al or Ca/Al. The IPESP and EPESA values of the films of 2tCzPy, 3tCzPy and 4tCzPy are different from their IPCV and EACV values because of the different behaviour of organic semiconductors in solutions and solid state as it was discussed in the literature (Tables 1 and 2).50Time-of-flight (TOF) measurements were performed for the investigation of the charge-transporting properties of vacuum-deposited films of the compounds (Fig. 7(b), (c) and Fig. S7, S8, ESI†). Compound 2tCzPy showed bipolar charge transport with a slightly higher electron mobility (μe) of 1.5 × 10⁻⁴ cm2 V−1 s−1 than a hole mobility (μh) of 1.2 × 10⁻⁴ cm2 V−1·s−1 at the same electric field of (E) of 1.8 × 10⁶ V cm−1. At zero electric fields, the difference between zero electron and hole mobilities estimated according to the fitting by the Poole–Frenkel electric field dependence μe,h = μ0e,h·exp(βe,h·E1/2) (μ0e = 1.7 × 10⁻⁵ cm2 V−1 s−1 and μ0h = 5.5 × 10⁻⁶ cm2 V−1 s−1) is higher than that at higher electric fields. This difference appears because of the different field-dependent parameters for electron and hole mobilities (βe = 0.016 cm1/2 V−1/2 and βh = 0.023 cm1/2 V−1/2). For the layers of 3tCzPy and 4tCzPy, only hole transport was observed. The layer of 4tCzPy showed μh reaching 4 × 10⁻⁴ cm2 V−1 s−1 at an electric field of 0.9 × 10⁶ V cm−1 (Fig. 7(b), (c) and Fig. S7, ESI†). For this layer, μ0h of 7.3 × 10⁻⁵ cm2 V−1 s−1 and βh of 0.018 cm1/2 V−1/2 were obtained. The TOF measurements did not allow us to estimate charge mobility for the layer of 3tCzPy, apparently because of the high energetic disorder. This is one of the limitations of the TOF technique.51 Nevertheless, the TOF measurements allow us to conclude that 2tCzPy and 4tCzPy have more potential for applications in optoelectronic devices than 3tCzPy.
OLED characterisation and analysis
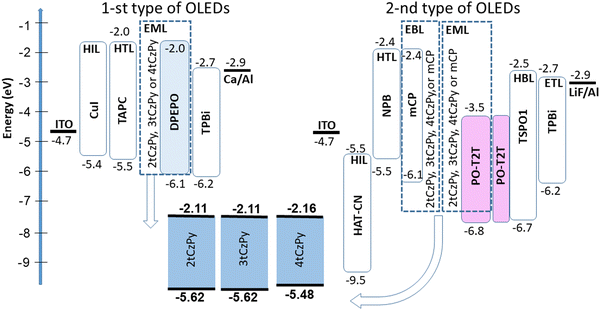
Compounds 2tCzPy, 3tCzPy and 4tCzPy were used for the deposition of light-emitting layers (EMLs) of two types of OLEDs (Fig. 8). The first type of OLED showed a colour-controllable electroluminescence (EL). The second type of OLED was used to study the exciplex-forming properties of the compounds. All layers of the same type of OLEDs were deposited simultaneously except the EMLs, allowing direct comparison of the EL properties of 2tCzPy, 3tCzPy and 4tCzPy. The devices were not precisely optimised, but comparison of the electroluminescent properties of the compounds offers insights for the design of new derivatives of phenylpyridine and di-tert-butyl-carbazole.OLEDs of the first type had a very simple structure: indium tin oxide (ITO)/copper iodide (CuI) (5 nm)/TAPC (40 nm)/2tCzPy, 3tCzPy or 4tCzPy (10 wt%) dispersed in bis[2-(diphenylphosphino)phenyl]ether oxide (DPEPO) (30 nm)/2,2′,2′′-(1,3,5-benzinetriyl)-tris(1-phenyl-1-H-benzimidazole) (TPBi) (40 nm)/Ca (20 nm):Al (100 nm). ITO was used as an optically transparent anode. The CuI layer was used as the hole-injection layer (HIL). The TAPC layer was used as the hole transporting layer (HTL). Guest–host-based EMLs were fabricated by co-deposition of 2tCzPy, 3tCzPy or 4tCzPy as the emitter and DPEPO as the host. The corresponding devices were named W1, W2, and W3, respectively. The TPBi layer was used as an electron transport layer (ETL). The Ca layer was used as a cathode passivated by Al.
The second type of OLED was fabricated utilizing the molecular mixtures of the synthesised derivatives with PO-T2T for the deposition of EMLs. The device structure was as follows: ITO/1,4,5,8,9,11-hexaazatriphenylenehexacarbonitrile (HAT-CN) (4 nm)/N,N′-di(1-naphthyl)-N,N′-diphenyl-(1,1′-biphenyl)-4,4′-diamine (NPB) (50 nm)/2tCzPy, 3tCzPy, 4tCzPy or mCP (10 nm)/2tCzPy, 3tCzPy, 4tCzPy or mCP mixed with PO-T2T (50 × 50 wt%, 20 nm)/PO-T2T (10 nm)/diphenyl[4-(triphenylsilyl)phenyl]phosphine oxide (TSPO1) (5 nm)/TPBi (55 nm)/lithium fluoride (LiF) (0.4 nm)/Al (100 nm). ITO was used for the deposition of the anode, HAT-CN was used for the deposition of the HIL, NPB was used for the deposition of the HTL. Thin films (10 nm) of 2tCzPy, 3tCzPy, 4tCzPy and mCP were used as electron/exciton-blocking layers in devices E1, E2, E3, and ER, respectively. In devices E1–3 and ER the molecular mixtures of 2tCzPy, 3tCzPy, 4tCzPy and mCP with the electron-accepting material PO-T2T were used as electron-donating materials for the deposition of exciplex-forming EMLs. Exciplex-forming material 1,3-bis(N-carbazolyl)benzene (mCP) was used as the reference material in the reference device ER.52 Thin film PO-T2T (10 nm) was used as the hole blocking layer (HBL). To prevent the formation of exciplexes at the interfaces, the TSPO1 layer was used as an exciton blocking layer. Fig. 8 displays the equilibrium energy diagrams of the devices of the first and the second type.
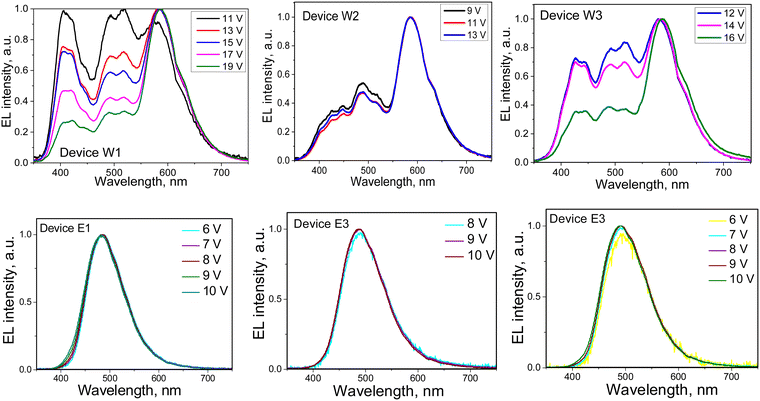
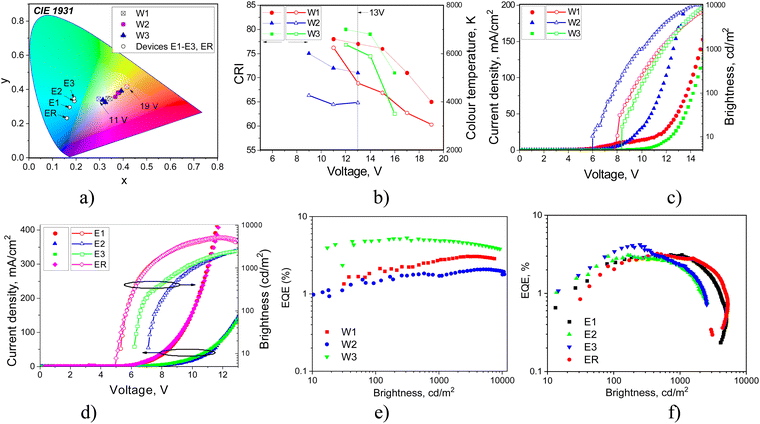
EL spectra of devices W1–3 and E1–3 were found to be different (Fig. 9). Devices W1–3 showed colour-tuneable EL at different voltages. At 13 V, OLEDs W1–3 showed white light emission with a colour rendering index (CRI) of 80 and good colour reproduction (Table 3). The CIE coordinates were close to natural white (0.33, 0.33). The colour temperature (TC) ranged from 3964 to 6368 K. The colour parameters of white emission could be adjusted by applying different voltages. Thus, devices W1–3 showed colour-tuneable EL (Fig. 9(a) and (b)). For example, TC values of W1 could be adjusted from 6562 to 3339 K (Fig. 9(b)). The bands at 380–460 nm and 460–560 nm of OLEDs W1–3 corresponded to the HLCT fluorescence of emitters 2tCzPy, 3tCzPy or 4tCzPy. In contrast to the PL spectra of neat films of the emitters and of the films of their molecular mixtures with inert polymer Zeonex that are characterised by tails/shoulders at 460–560 nm (Fig. 4(b)), the EL spectra of W1–3 are characterised by bands at 460–560 nm with well-expressed maxima. The different excitation sources could be the reasons for the differences between PL and EL spectra. In addition, we fabricated doping-free devices (N1, N2 and N3) using 2tCzPy, 3tCzPy, and 4tCzPy for the deposition of EMLs, respectively (ESI† – section “Electroluminescence of doping-free OLEDs”, Fig. S11 and S12). The EL spectra of doping-free devices with two bands are similar to the EL spectra of OLEDs W1–W3 (Fig. S11a, ESI†). A new band peaking at 580 nm was observed in the EL spectra of devices W1–3. This band was responsible for the colour-tuneable electroluminescence of OLEDs W1–3. The intensity of the band at 580 nm increased with increasing voltage. EL spectra of devices W1–3 were strongly dependent on applied voltages because of the formation of an electroplex with TAPC.53–55 When exciplex-forming EMLs and EBLs/HBLs were used in devices E1–3 and ER, HLCT emissions of 2tCzPy, 3tCzPy and 4tCzPy and electroplex formation were prevented. This resulted in single-color EL with nearly identical EL spectra at different voltages (Fig. 9). EL spectra of OLEDs E1–3 were slightly red-shifted with respect of that of device ER (Fig. S6, ESI†). They showed sky-blue electroluminescence (Fig. 9(a)). EL spectra of OLEDs E1–3 were found to be in very good agreement with the corresponding PL spectra of the solid-state molecular mixtures of 2tCzPy, 3tCzPy or 4tCzPy with PO-T2T (Fig. 6(a) and Fig. S5, ESI†).
The turn-on voltages (Von) of 6–8.4 V and high brightness exceeding 5000 cd m−2 were recorded for devices W1–3 (Fig. 10(c) and (d)). Such relatively high Von can be explained by the relatively high energy barrier for electrons at the EML/ETL interface. There are barriers of 0.7 eV between the layers of DPEPO and TPBi and of ca. 0.5 eV between 2tCzPy, 3tCzPy or 4tCzPy and TPBi (Fig. 6). OLEDs E1–E3 showed lower Von of 5.3–7.1 V because of the decreased energy for electrons at the EML/HBL/ETL interface. The energy barrier for electrons between PO-T2T, TSPO1 and TPBi is practically absent. However, devices E1–3 showed low brightness slightly exceeding 2000 cd m−2. This observation can be explained by the sky-blue electroluminescence of E1–3, which is less sensitive to human eyes than the white emission of W1–3. The high operating voltages of W1–3 and E1–3 lead to relatively low power efficiencies (PE), reaching 4.6 lm W−1 (Fig. S7 and Table 3). The highest current efficiency (CE) of 12.7 cd A−1 was obtained for device E1.
Both types of devices showed close EQEs. The highest maximum EQEs of 5.2 and 4.1% were observed for 4tCzPy-based devices W3 and E3 (Table 3). Devices W1 and E1 containing 2tCzPy showed the maximum EQE of 3.1%. Devices W2 and E2 containing 3tCzPy showed EQEs of 2% and 2.9%, respectively. The best performance of 4tCzPy can be attributed to its best combination of photophysical, charge-injecting and charge-transporting properties (Table 3). Compound 4tCzPy exhibited the lowest Ip value of 5.48 eV, favourable for efficient hole injection (Fig. 7(a)). It showed well-balanced hole and electron transport (Fig. 5(c)), along with HLCT emission and long-lived fluorescence (Fig. 3(d) and (e)), suggesting triplet harvesting. According to the EL dynamics studied at different wavelengths (Fig. S12, ESI†), compound 4tCzPy emits short-lived emissions at short wavelengths and long-lived emissions in the low-energy region. The long-lived EL of the devices provides additional evidence of triplet harvesting by the compounds. Moreover, device E3 based on 4tCzPy demonstrated superior performance compared to OLED ER with the EML comprising commercially available mCP.
Conclusions
The synthesis and properties of three new derivatives of benzene with different numbers of pyridinyl and di-tert-butyl-carbazolyl substituents are reported. The effects of the number of pyridine and di-tert-butyl-carbazole moieties in the molecular structures of the compounds on the optoelectronic thermal, electrochemical, charge-injecting, charge-transporting and electroluminescent properties are discussed. The compounds exhibit deep-blue fluorescence with a quantum efficiency of up to 33% in the solid-state resulting from the relaxation of hybridised local and charge transfer states. Under electrical excitation, colour-tuneable white electroluminescence is achieved due to the overlapping of the emission of the studied compounds and electroplex emission of the hole-transporting layer. Colour-tuneable white organic light-emitting diodes are developed with an external quantum efficiency of 5.2% and an adjustable colour temperature which ranges from 3339 to 6562 K. Sky-blue thermally activated delayed fluorescence is observed due to the exciplex-forming properties of the compounds. Sky-blue organic light-emitting diodes show an external quantum efficiency of 4.1% and CIE1931 colour coordinates ranging from (0.17, 0.3) to (0.19, 0.35).Author contributions
The manuscript was written through contributions of all authors. All authors have given approval to the final version of the manuscript.Conflicts of interest
There are no conflicts to declare.Acknowledgements
This project has received funding from the Research Council of Lithuania (LMTLT), project QUANT, agreement no S-LU-24-8.Notes and references
- C. W. Tang and S. A. Vanslyke, Appl. Phys. Lett., 1987, 51, 913–915 CrossRef CAS.
- M. Y. Wong, E. Zysman-Colman, M. Y. Wong and E. Zysman-Colman, Adv. Mater., 2017, 29, 1605444 CrossRef PubMed.
- Y. Takahashi, Y. Furuki, S. Yoshida, T. Otani, M. Muto, Y. Suga and Y. Ito, SID Symposium Digest of Technical Papers, 2014, vol. 45, pp. 381–384.
- E. Amasawa, T. Ihara, T. Ohta and K. Hanaki, J. Cleaner Prod., 2016, 135, 1340–1350 CrossRef.
- A. Salehi, C. Dong, D. H. Shin, L. Zhu, C. Papa, A. Thy Bui, F. N. Castellano and F. So, Nat. Commun., 2019, 10, 1–9 CrossRef CAS PubMed.
- H. Uoyama, K. Goushi, K. Shizu, H. Nomura and C. Adachi, Nature, 2012, 492, 234–238 CrossRef CAS PubMed.
- Z. Yang, Z. Mao, Z. Xie, Y. Zhang, S. Liu, J. Zhao, J. Xu, Z. Chi and M. P. Aldred, Chem. Soc. Rev., 2017, 46, 915–1016 RSC.
- A. Endo, K. Sato, K. Yoshimura, T. Kai, A. Kawada, H. Miyazaki and C. Adachi, Appl. Phys. Lett., 2011, 98, 083302 CrossRef.
- Q. Zhang, B. Li, S. Huang, H. Nomura, H. Tanaka and C. Adachi, Nat. Photonics, 2014, 8, 326–332 CrossRef CAS.
- P. Ledwon, Org. Electron., 2019, 75, 105422 CrossRef CAS.
- D. R. Lee, B. S. Kim, C. W. Lee, Y. Im, K. S. Yook, S. H. Hwang and J. Y. Lee, ACS Appl. Mater. Interfaces, 2015, 7, 9625–9629 CrossRef CAS PubMed.
- Y. M. Huang, T. Y. Chen, D. G. Chen, H. C. Liang, C. H. Wu, M. M. Lee, T. L. Chiu, J. H. Lee, Y. C. Chiu, P. T. Chou and M. K. Leung, J. Mater. Chem. C, 2021, 9, 2381–2391 RSC.
- S. Tang, P. Lundberg, Y. Tsuchiya, J. Ràfols-Ribé, Y. Liu, J. Wang, C. Adachi, L. Edman, S. Tang, P. Lundberg, J. Ràfols-Ribé, Y. Liu, J. Wang, L. Edman, C. Adachi and L. Edman, Adv. Funct. Mater., 2022, 32, 2205967 CrossRef CAS.
- S. L. Zhang, Y. Z. Shi, K. Wang, X. C. Fan, J. Yu, X. M. Ou and X. H. Zhang, Mater. Today Energy, 2021, 20, 100581 CrossRef CAS.
- T. H. Ha, J. K. Bin and C. W. Lee, Org. Electron., 2022, 102, 106450 CrossRef CAS.
- H. Liu, Y. Fu, B. Z. Tang and Z. Zhao, Nat. Commun., 2022, 13, 1–11 Search PubMed.
- X. Zhang, T. Pan, J. Zhang, L. Zhang, S. Liu and W. Xie, ACS Photonics, 2019, 6, 2350–2357 CrossRef CAS.
- M. Fröbel, T. Schwab, M. Kliem, S. Hofmann, K. Leo and M. C. Gather, Light: Sci. Appl., 2015, 4, e247 CrossRef.
- C. W. Joo, J. Moon, J. H. Han, J. W. Huh, J. Lee, N. S. Cho, J. Hwang, H. Y. Chu and J. I. Lee, Org. Electron., 2014, 15, 189–195 CrossRef CAS.
- F. Fries, M. Fröbel, S. Lenk and S. Reineke, Org. Electron., 2017, 41, 315–318 CrossRef CAS.
- H. Lee, H. Cho, C. Byun, J. Han, B. Kwon, S. Choi, J. Lee, N. Sung Cho, S. Reineke, F. Lindner, G. Schwartz, N. Seidler, K. Walzer, B. Lüssem, K. Leo, Z. B. Wang, M. G. Helander, J. Qiu, D. P. Puzzo, M. T. Greiner, Z. M. Hudson, S. Wang, Z. W. Liu, Z. H. Lu, A. Ghosh, E. P. Donoghue, L. Khayrullin, T. Ali, I. Wacyk, K. Tice, F. Vazan, O. Prache, Q. Wang, L. Sziklas, D. Fellowes, R. Draper, H. S. Lee, S. Jang, J. Noh, H. Jeon, B. Choi, Y. M. Jeon, K. Song, J. Song, H. Y. Chu, S. Kim, G. Gu, V. Bulović, P. E. Burrows, S. R. Forrest, M. E. Thompson, Y. Jiang, J. Lian, S. Chen, H. Kwok, F. Guo, A. Karl, Q. Xue, K. C. Tam, K. Forberich and C. J. Brabec, Opt. Express, 2018, 26, 18351–18361 CrossRef CAS PubMed.
- S. H. Yang, P. J. Shih, W. J. Wu and Y. H. Huang, J. Lumin., 2013, 142, 86–91 CrossRef CAS.
- T. Wang, X. Song, Z. Huang, J. Miao, Z. Chen, Y. Cheng and C. Yang, Adv. Opt. Mater., 2024, 2303067 CrossRef CAS.
- K. Kumar, K. K. Kesavan, S. Kumar, S. Banik, J. Jayakumar, L. Y. Hong, L. Y. Hung, M. R. Nagar, J. H. Jou and S. Ghosh, J. Photochem. Photobiol., A, 2023, 437, 114380 CrossRef CAS.
- C. Bian, Q. Wang, Q. Ran, X. Y. Liu, J. Fan and L. S. Liao, Org. Electron., 2018, 52, 138–145 CrossRef CAS.
- J. Yoon, S. K. Kim, H. J. Kim, S. Choi, S. W. Jung, H. Lee, J. Y. Kim, D. W. Yoon, C. W. Han, W. S. Chae, J. H. Kwon, M. J. Cho and D. H. Choi, Chem. – Eur. J., 2020, 26, 16383–16391 CrossRef CAS PubMed.
- C. Tang, R. Bi, Y. Tao, F. Wang, X. Cao, S. Wang, T. Jiang, C. Zhong, H. Zhang and W. Huang, Chem. Commun., 2015, 51, 1650–1653 RSC.
- W. Jiang, L. Duan, J. Qiao, G. Dong, D. Zhang, L. Wang and Y. Qiu, Dyes Pigm., 2012, 92, 891–896 CrossRef CAS.
- Y. Huo, J. Lv, Y. Xie, L. Hua, Y. Liu, Z. Ren, T. Li, S. Ying and S. Yan, ACS Appl. Mater. Interfaces, 2022, 14, 57092–57101 CrossRef CAS PubMed.
- Y. Liu, M. Nishiura, Y. Wang and Z. Hou, J. Am. Chem. Soc., 2006, 128, 5592–5593 CrossRef CAS PubMed.
- M. Mahmoudi, D. Gudeika, D. Volyniuk, K. Leitonas, R. Butkute, I. Danyliv and J. V. Grazulevicius, Chem. Eng. J., 2021, 423, 130236 CrossRef CAS.
- Y. Tsuchiya, N. Nakamura, S. Kakumachi, K. Kusuhara, C. Y. Chan and C. Adachi, Chem. Commun., 2022, 58, 11292–11295 RSC.
- L. Zhang and J. M. Cole, ACS Appl. Mater. Interfaces, 2015, 7, 3427–3455 CrossRef CAS PubMed.
- Y. Zhang, M. Qile, J. Sun, M. Xu, K. Wang, F. Cao, W. Li, Q. Song, B. Zou and C. Zhang, J. Mater. Chem. C, 2016, 4, 9954–9960 RSC.
- K. T. Wong, Y. M. Chen, Y. T. Lin, H. C. Su and C. C. Wu, Org. Lett., 2005, 7, 5361–5364 CrossRef CAS PubMed.
- Y. Danyliv, K. Ivaniuk, I. Danyliv, O. Bezvikonnyi, D. Volyniuk, S. Galyna, A. Lazauskas, L. Skhirtladze, H. Ågren, P. Stakhira, N. Karaush-Karmazin, A. Ali, G. Baryshnikov and J. V. Grazulevicius, Dyes Pigm., 2023, 208, 110841 CrossRef.
- S. J. Su, Y. Takahashi, T. Chiba, T. Takeda and J. Kido, Adv. Funct. Mater., 2009, 19, 1260–1267 CrossRef CAS.
- N. Mataga, H. Chosrowjan and S. Taniguchi, J. Photochem. Photobiol., C, 2005, 6, 37–79 CrossRef CAS.
- E. Goldman and J. L. Ragle, J. Phys. Chem., 1986, 90(24), 6440–6446 CrossRef CAS.
- E. S. Starnovskaya, D. S. Kopchuk, A. F. Khasanov, O. S. Taniya, I. L. Nikonov, M. I. Valieva, D. E. Pavlyuk, A. S. Novikov, G. V. Zyryanov and O. N. Chupakhin, Molecules, 2022, 27, 6879 CrossRef CAS PubMed.
- Y.-H. Kim, J.-J. Kim, S.-J. Woo and Y.-H. Ha, J. Mater. Chem. C, 2020, 8, 12075 RSC.
- M. Mahmoudi, D. Gudeika, S. Kutsiy, J. Simokaitiene, R. Butkute, L. Skhirtladze, K. L. Woon, D. Volyniuk and J. V. Grazulevicius, ACS Appl. Mater. Interfaces, 2022, 14, 40158–40172 CrossRef CAS PubMed.
- W. Yuan, M. Zhang, X. Zhang, X. Cao, N. Sun, S. Wan and Y. Tao, Dyes Pigm., 2018, 159, 151–157 CrossRef CAS.
- W. Li, D. Liu, F. Shen, D. Ma, Z. Wang, T. Feng, Y. Xu, B. Yang and Y. Ma, Adv. Funct. Mater., 2012, 22, 2797–2803 CrossRef CAS.
- N. M. Ataga, Y. Kaifu and M. Kolzumi, Bull. Chem. Soc. Jpn., 1956, 29, 465–470 CrossRef.
- T. Jairam and W. P. Hong, J. Mater. Chem. C, 2022, 10, 16173–16217 RSC.
- J. Tagare and S. Vaidyanathan, J. Mater. Chem. C, 2018, 6, 10138–10173 RSC.
- K. Leitonas, B. Vigante, D. Volyniuk, A. Bucinskas, R. Keruckiene, P. Dimitrijevs, T.-L. Chiu, J. V. Grazulevicius and P. Arsenyan, J. Mater. Chem. C, 2023, 11, 9514–9526 RSC.
- E. H. H. Hasabeldaim, H. C. Swart and R. E. Kroon, RSC Adv., 2023, 13, 5353–5366 RSC.
- J. Sworakowski, Synth. Met., 2018, 235, 125–130 CrossRef CAS.
- A. Melianas, V. Pranculis, Y. Xia, N. Felekidis, O. Inganäs, V. Gulbinas, M. Kemerink, A. Melianas, Y. Xia, O. Inganäs, V. Pranculis, V. Gulbinas, N. Felekidis and M. Kemerink, Adv. Energy Mater., 2017, 7, 1602143 CrossRef.
- M. Guzauskas, D. Volyniuk, A. Tomkeviciene, A. Pidluzhna, A. Lazauskas and J. V. Grazulevicius, J. Mater. Chem. C, 2018, 7, 25–32 RSC.
- Y. J. Pu, Y. Koyama, D. Otsuki, M. Kim, H. Chubachi, Y. Seino, K. Enomoto and N. Aizawa, Chem. Sci., 2019, 10, 9203–9208 RSC.
- M. Wei, G. Gui, Y. H. Chung, L. Xiao, B. Qu and Z. Chen, Phys. Status Solidi B, 2015, 252, 1711–1716 CrossRef CAS.
- R. Butkute, R. Lygaitis, V. Mimaite, D. Gudeika, D. Volyniuk, G. Sini and J. V. Grazulevicius, Dyes Pigm., 2017, 146, 425–437 CrossRef CAS.
Footnote |
| † Electronic supplementary information (ESI) available. See DOI: https://doi.org/10.1039/d4ma00499j |
| This journal is © The Royal Society of Chemistry 2024 |

