
 Open Access Article
 This Open Access Article is licensed under a Creative Commons Attribution-Non Commercial 3.0 Unported Licence
Post-synthetic exchange in a zirconium metal–organic framework for efficient photoreduction of CO2 to formate†
Akhil
Chandran P.
ab,
Govu
Radha
a,
P. C.
Meenu
a,
Sounak
Roy
 *ab and
Himanshu
Aggarwal
*ab
*ab and
Himanshu
Aggarwal
*ab
aDepartment of Chemistry, Birla Institute of Technology and Science, Hyderabad Campus, Hyderabad 500078, India. E-mail: himanshu.aggarwal@hyderabad.bits-pilani.ac.in
bMaterials Centre for Sustainable Energy & Environment (McSEE), Birla Institute of Technology and Science, Hyderabad Campus, Hyderabad 500078, India
First published on 31st July 2024
Abstract
The reduction of CO2 to useful products such as formic acid is of immense industrial importance. In the present report, we have studied the CO2 reduction performance of a Zr MOF and its titanium-exchanged analogs. A naphthalene diimide tetracarboxylic acid (TNDI) linker-based metal–organic framework with zirconium metal was synthesized for effective photocatalytic CO2 reduction in aqueous medium. This water-stable MOF was able to achieve formate production at a rate of 38 μmol g−1 h−1. Higher production rates and yields were achieved through the post-synthetic metal exchange of Zr with Ti. The new mixed metal MOF with 20% and 30% exchange of Zr with Ti metal resulted in the reduction of the band gap of the pristine MOF, which led to higher production rates of 50 μmol g−1 h−1 and 71 μmol g−1 h−1 of formate, respectively. Detailed photocatalytic experiments have been carried out to understand the mechanism of the enhancement of the formate production upon exchange with Ti metal.
Introduction
Fossil fuels have been the primary source of energy from the early days and continue to be the primary source of the world's energy requirements. The consumption of fossil fuels inadvertently releases greenhouse gases such as carbon dioxide and nitrogen oxides into the atmosphere. The rate at which CO2 is released into the atmosphere through fossil fuel combustion and other processes, like transportation and industrial emissions, is much faster than the speed at which it can be removed from the atmosphere. As a result, carbon dioxide levels have been on a constant rise for the past few decades, and, as per recent reports, the current level of CO2 has crossed 400 ppm.1–4 It is therefore imperative to look for alternative energy solutions besides controlling our carbon footprints.The mitigation of carbon dioxide demands a twofold approach such as capture and conversion of CO2 into useful products while simultaneously controlling its emissions. The basic idea is to convert CO2 as a source of chemical energy into one or more industrially important products like carbon monoxide, methane, ethane, methanol, ethanol, acetic acid, and formic acid. This can be achieved with the help of an electro- or photocatalyst with high efficiency of conversion. CO2 is a highly stable molecule, with a bond energy of 750 kJ mol−1,2,5 and designing a catalyst for CO2 reduction requires extreme care. Various catalysts such as metal oxides, metal sulfides, and organometallic compounds have already been reported in the literature.1,2,5–9
Metal–organic frameworks (MOFs), known for their high surface areas and tunable porosities, have also gained a lot of attention for their photocatalytic properties in recent years.7–12 The high surface area in the case of MOFs plays an important role in CO2 adsorption which is a prerequisite for CO2 reduction.9,13–16 Additionally, MOFs can be designed by pre-selection of appropriate ligands and metal ions that can help in achieving desired band gap properties.2,3,16–19 Amongst the various types of MOFs reported to date, Zr- and Ti-based MOFs have shown exceptional photocatalytic properties.16–18 The higher stabilities of these MOFs due to the presence of hexanuclear clusters make them a better choice over conventional Zn-, Cd-, and Co-based MOFs. Although there have been isolated reports on the photocatalytic CO2 reduction properties of Zr and Ti MOFs, there are only a handful of reports where both metal ions are part of the same framework.13,19,20 These works have shown their potential for photocatalytic CO2 reduction in organic media. But when aqueous reaction media are used, most catalysts suffer from stability issues due to the lack of robustness. Thus, an attempt was made to check the photocatalytic activity of the current MOF in aqueous media.
Here we study a naphthalene diimide core containing zirconium MOF (Zr–TNDI, 1) and its titanium-exchanged product (Zr–Ti–TNDI MOF, 1-Tiexch) for the CO2 photo-reduction process. The naphthalene diimide tetracarboxylate (TNDI) linker can serve as a photosensitive building block, and a good CO2 uptake by the MOF material can lead to greater chances of interactions between the Zr-clusters and CO2 molecules, thus improving the CO2 reduction efficiency. The TNDI linker (Fig. S1 and S2, ESI†) and the Zr–TNDI MOF (1) have been synthesized using our previously reported procedures. The secondary building unit of 1 contains Zr hexanuclear clusters connected to TNDI linkers, leading to a 4-c structure with lvt topology21 (Fig. 1a). The overall MOF structure is 2-fold interpenetrated.
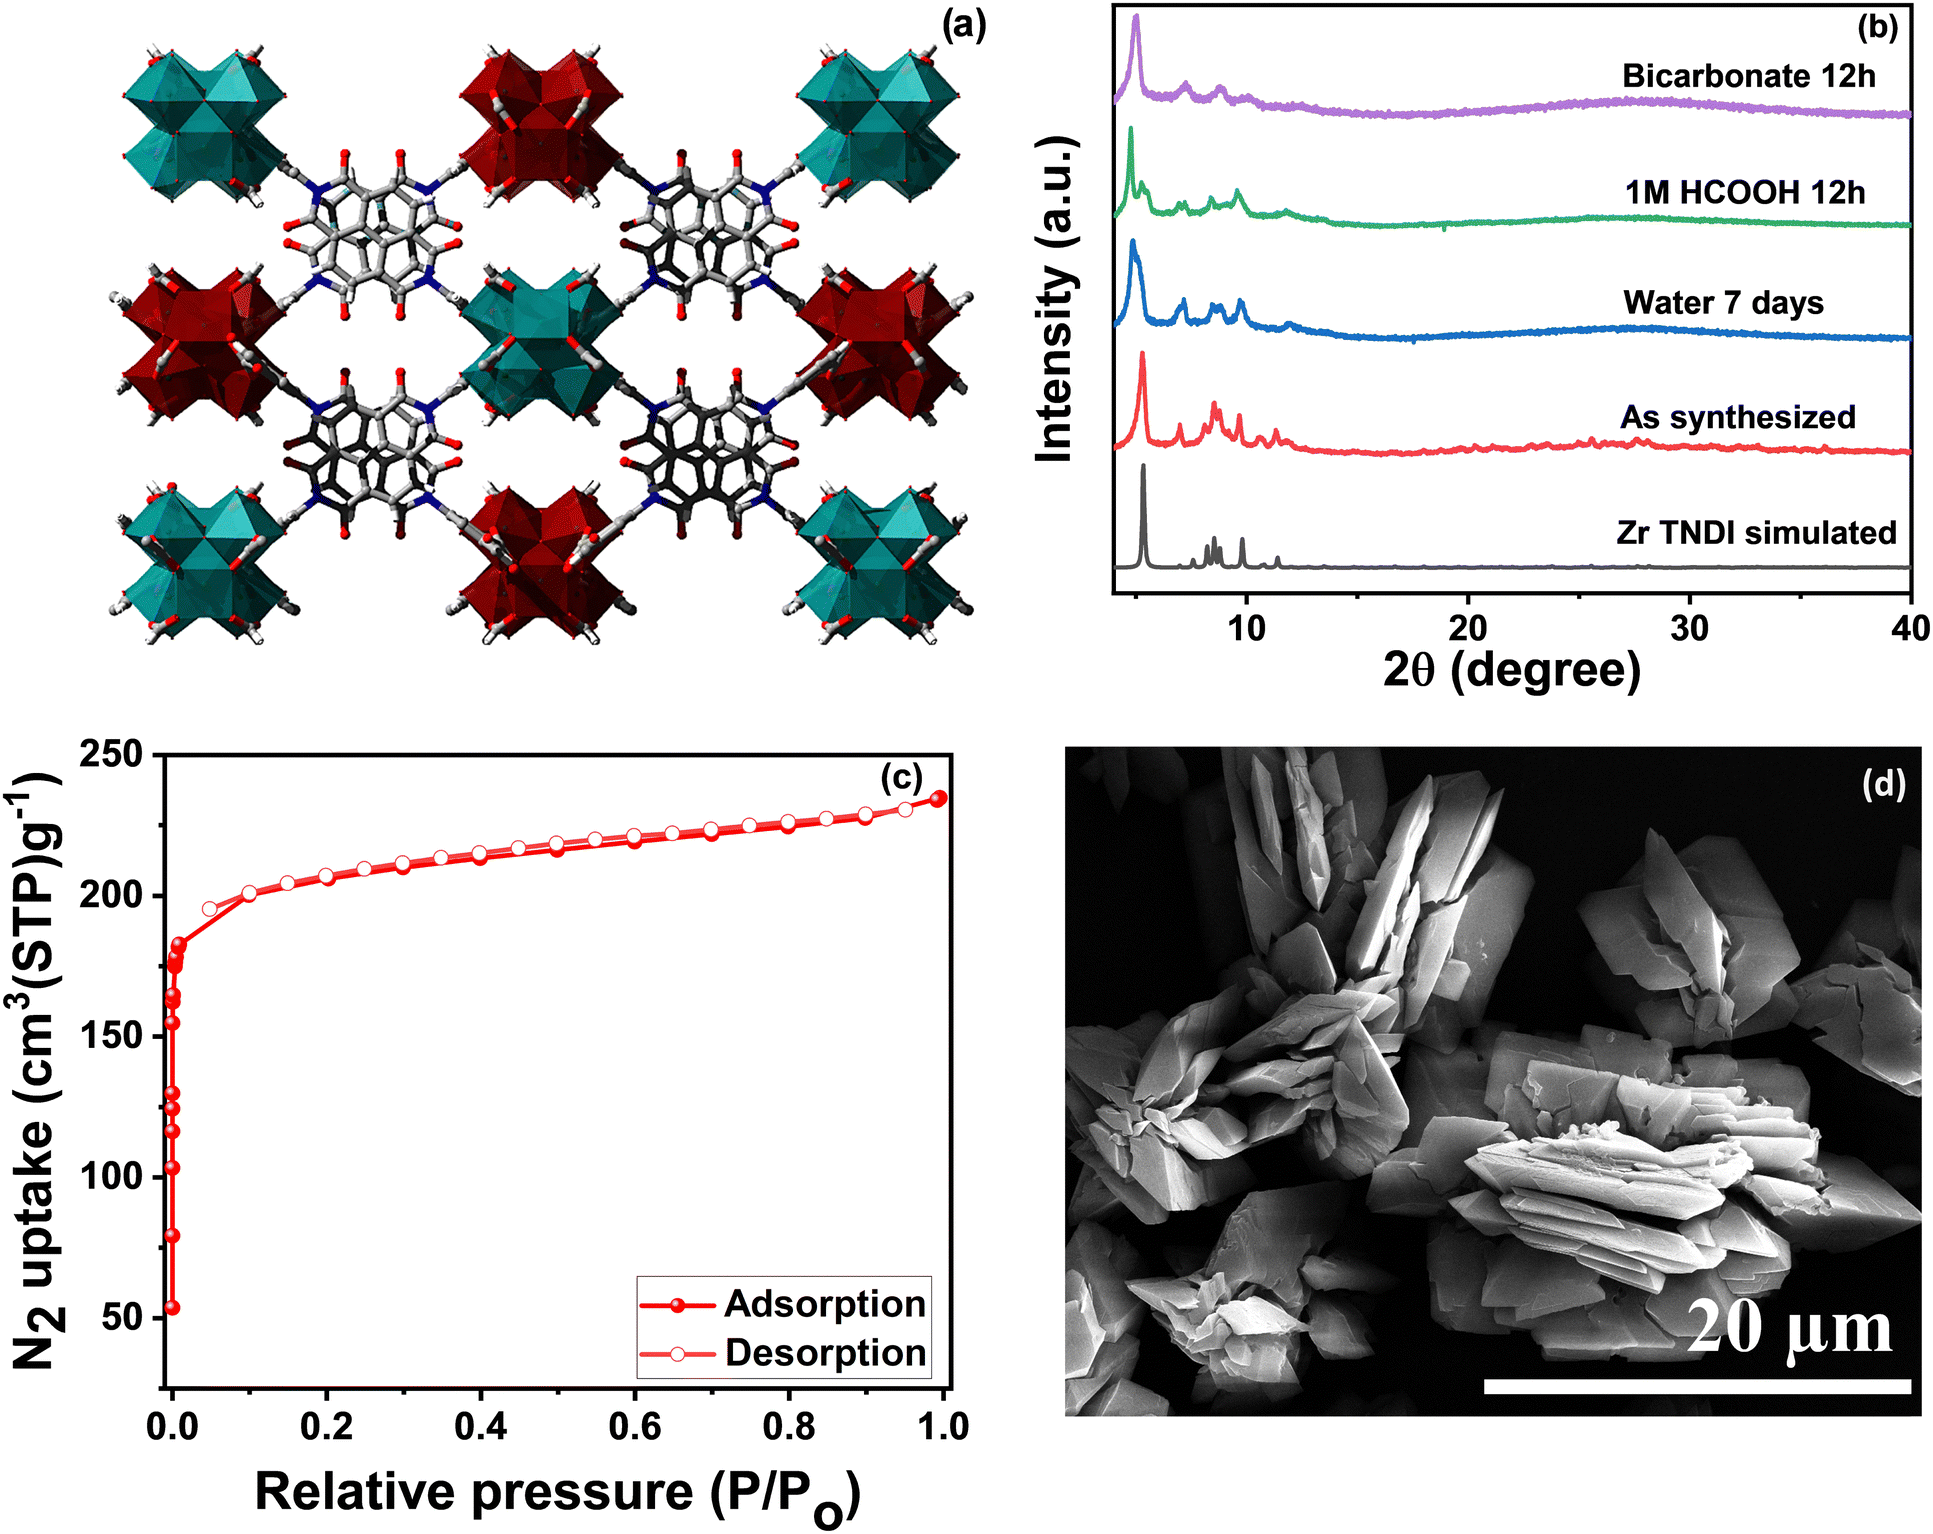 | ||
| Fig. 1 (a) Packing diagram of the 2-fold interpenetrated structure of the Zr–TNDI MOF (1). Zr, C, N, and O atoms are shown in maroon/light blue, grey, blue, and red colors, respectively.21 (b) PXRD of 1 showing its bulk purity and stability in water, 1 M formic acid, and 0.1 M bicarbonate solution. (c) BET surface area measurement and (d) SEM image of 1 showing an intergrown rod-shaped morphology. | ||
Experimental
Materials and methods
1,4,5,8-Naphthalene tetracarboxylic dianhydride (96%), formic acid (≥97%), ZrOCl2·8H2O (98%), 5-amino isophthalic acid, and titanium isopropoxide (97%) were the chemicals used for the MOF synthesis, which were procured from Sigma-Aldrich and TCI Chemicals. N,N-dimethyl formamide (DMF) and isopropyl alcohol solvents were purchased from SRL Chemicals. Sodium bicarbonate (99.7%) and sodium sulfite (98%) used in the photochemical reaction were purchased from SRL Chemicals. The NMR solvent D2O and 4-nitrophenol were ordered from Sigma-Aldrich and Avra Laboratories Pvt. Ltd. CO2 and argon cylinders were procured from M/S Bhuruka Gases Ltd. (India).Ligand synthesis
A reported procedure was followed for the synthesis of the tetracarboxylate naphthalene diimide (TNDI) linker. 1,4,5,8-Naphthalene tetracarboxylic dianhydride (3 mmol, 810 mg) was taken in 15 mL acetic acid and stirred for a few minutes. Later 5-aminoisophthalic acid (6 mmol, 1096 mg) was added and kept under reflux conditions for 24 hours. After the reaction, the mixture was allowed to cool and filtered using water, then washed properly three times with water initially and then with methanol. The mixture was then dried at 80 °C for 1 h and finally recrystallized from minimal DMF. DMF was exchanged with acetone during the filtration of crystals. The product was finally dried at 80 °C overnight and the pure product was collected.MOF synthesis
ZrOCl2·8H2O (11.27 mg, 0.035 mmol) and TNDI (17.13 mg, 0.03 mmol) were dissolved in a 25 mL glass vial containing 3 mL DMF. 2 mL formic acid was added and sonicated until a uniform suspension was formed and the reaction mixture was kept in an oven at 130 °C for 48 hours. Colorless transparent crystals were obtained, washed several times with DMF and acetone, and finally dried at 80 °C.Zr metal sites were exchanged with Ti metal by a post-synthetic strategy to obtain a mixed metal MOF. 50 mg of the MOF was dispersed in a 2 mL total volume of a titanium isopropoxide–dry DMF mixture. The volume percentages of titanium isopropoxide used were 5, 10, 20, and 50. The exchange was allowed to proceed for three days at 80 °C. The solvent was decanted, and the compound was washed several times with isopropyl alcohol to remove the remaining titanium isopropoxide solution. After washing, the MOF was dried at 80 °C.
Photocatalytic experiment
The photo experiment was carried out in a catalytic reactor setup. 50 mg catalyst was dispersed in 25 mL aqueous solution containing 0.1 M NaHCO3 and 0.2 M Na2SO3. NaHCO3 acted as the medium for dissolving CO2 and Na2SO3 was used as the hole sacrificial agent. To remove the dissolved oxygen, argon gas was passed for 15 minutes through the medium and the reactor was sealed properly. Through the septum carbon dioxide (99.9%) gas was passed (5 cc min−1) continuously throughout the reaction. A 125 W medium-pressure mercury vapor lamp was used as the source of UV radiation for the reaction and water was circulated around the lamp to prevent overheating. Each hour of the reaction, 1 mL of the liquid suspension was taken out using a glass syringe and centrifuged. Again, it was filtered through a syringe filter, and the resulting liquid (400 μL) was used to carry out NMR to perform the qualitative and quantitative analyses of the product. 99.9% D2O solvent (100 μL) and 4-nitrophenol (PNP) (5 mg) standard were used.The product was quantified using the following formula:22
Cproduct = Cinternal![[thin space (1/6-em)]](https://www.rsc.org/images/entities/char_2009.gif) standard (Iproduct × Hinternalstandard)/(Hproduct × Iinternalstandard) standard (Iproduct × Hinternalstandard)/(Hproduct × Iinternalstandard) |
Powder X-ray diffraction
The PXRD patterns were collected from a Rigaku Ultima IV X-ray diffractometer with a Cu Kα source (40 kV, 40 mA) of 1.54 Å radiation to determine the bulk purity of the synthesized compounds. A scan rate of 2° min−1 and a step width of 0.01 were applied. The scan was done from a 4°–40° angle.BET surface area analysis
A Microtrac Bel – BELSORP mini II model surface area analyser was used for measuring nitrogen adsorption isotherms of the prepared compounds. Before the adsorption experiment, the as-synthesized Zr–TNDI MOF was exchanged with acetone for three days and activated at a temperature of 100 °C for 4 hours. From the adsorption–desorption isotherm plots, the BET surface area and porosity were measured.X-ray photoelectron spectroscopy
A Thermo Scientific Kα instrument was used for binding energy measurement of different bonds and finding out the elemental composition of the compounds. An Al Kα source with a 1486.8 eV energy was hit on the samples from the instrument.Thermogravimetric analysis
TGA was performed to understand the thermal behavior of the prepared samples. The thermogram was recorded from 30 to 800 °C in an inert atmosphere (N2) using a Shimadzu DTG-60 instrument. A heating rate of 10 °C per minute was maintained throughout the experiment. The compounds showed thermal stability up to 450 °C and later decomposition occurred.Scanning electron microscopy
SEM images were taken using an FEI Apreo LoVac instrument. The morphology of the particles was identified through this technique. Also, the elemental mapping was performed for the MOFs and the atomic percentage was obtained through EDS.UV-visible spectroscopy
The solid-state absorbance of the samples was measured using a Jasco V-670 model spectrometer. The main absorption peak was found at a 388 nm wavelength.Fluorescence spectroscopy
Solid-state emission spectra were recorded in a Jasco FP-6300 model spectrofluorometer at an excitation wavelength of 395 nm.ICP-OES analysis
Inductively coupled plasma optical emission spectrometry (ICP-OES) was carried out to estimate the percentage of Ti metal getting exchanged with Zr metal. 3 mg of the MOF was digested in 2 mL of concentrated H2SO4. The sample was heated for 20 minutes at 80 °C in an oven. From this, 500 μL of the solution was diluted to 15 mL with Millipore H2O and the analysis was carried out. The percentage exchange of Ti metal was back calculated from the initial and final amounts of Zr metal considering the salt formation from the acid used for digestion. The equation used for the calculation is as follows:Element concentration (%) = concentration of element obtained × volume of solute × dilution factor × 100/weight of the sample.7
Electrochemical measurements
Electrochemical measurements were conducted in a pseudo-air-tight cell containing a three-electrode system dipped in 0.1 M Na2SO4 aqueous electrolyte solution at room temperature. The platinum electrode was the counter electrode. An Ag/AgCl electrode was used as the reference electrode, while a glassy carbon electrode (GCE) was used as the working electrode. Homogeneous suspensions of the MOFs were prepared by sonicating the mixture containing 5 mg catalyst, 10 μL Nafion, and 1 mL methanol for 3 hours. 20 μL of the homogeneous suspension was loaded on the 3 mm diameter GCE. This was allowed to evaporate naturally to form a uniform layer of the catalyst over the electrode surface at room temperature before the electrochemical measurement started. To find out the position of the conduction band of the MOFs, the Mott–Schottky experiment was carried out at a 500 Hz frequency. The conducting properties of the MOFs were found through impedance measurement in the frequency range of 100 kHz–100 MHz. An OrigaFlex Origa 5000 potentiostat model was used for this study.Results and discussion
The PXRD pattern of the as-synthesized MOF crystals (1) matched well with their simulated pattern, which confirmed the phase purity of the sample (Fig. 1b). The PXRD pattern shows a slight shift in different solvent media. This is due to the flexible nature of this 2-fold interpenetrated framework.23 Thermogravimetric analysis (TGA) of the MOF sample revealed the first weight loss up to 200 °C corresponding to the evaporation of the solvent molecule (DMF), followed by gradual decomposition of the framework (Fig. S3, ESI†). The BET (Brunauer–Emmett–Teller) surface area was found to be 720 m2 g−1 with an average pore diameter of 7.5 Å (Fig. 1c and Fig. S4, ESI†). The surface morphology of the MOF was observed through scanning electron microscopy (SEM) (Fig. 1d) and energy-dispersive X-ray spectroscopy (EDS) mapping to identify the elemental composition and its percentage distribution (Fig. S5, ESI†). An intergrown rod-shaped morphology can be seen from the surface images for this MOF. Table S1 (ESI†) shows the elemental distribution in the MOF. The CO2 adsorption data were collected at different temperatures (273 K, 298 K, and 328 K) up to 55 bar which showed a two-step adsorption isotherm with steep uptake at lower pressures (Fig. S6, ESI†) owing to the flexible nature of the framework. A slight hysteresis is also observed, which could be due to strong interactions between the CO2 molecules and the MOF. CH4 and H2 showed uptake values of 88.94 cm3 g−1 and 26.35 cm3 g−1, respectively, at 80 bar pressure and 25 °C (Fig. S6, ESI†).The photocatalytic properties of a material can be evaluated by studying its CO2 adsorption, light absorption, band gap, and surface redox properties. The UV-vis spectrum of 1 shows absorption around 388 nm (Fig. 2a), which mainly comes from the absorption properties (π–π* transition) of the TNDI linker. Another broad peak at 510 nm is a Q band. The MOF shows light absorption primarily in the UV region that further spreads to the visible region. The conduction band positions were determined using Mott–Schottky measurement at a 500 Hz frequency (Fig. 2b). The conduction band position is found to be −0.92 V vs. Ag/AgCl. When expressed in NHE at pH 7, the value is −0.72. 1 is an n-type semiconductor since it shows a positive slope value of C−2. The intercepts on the x-axis give the flat band potential which is almost the same as the conduction band (LUMO) for an n-type semiconductor.3 Additionally, the bandgap for 1 was determined to be 2.90 eV from the Kubelka–Munk plot24 (Fig. 2c). Notably, a good photocatalyst for CO2 reduction should show semiconducting properties with an optimum band gap where the conduction band is more negative than the redox potential for the CO2 reduction reaction to a particular product. In this particular case, it should be more negative than the reduction potential value of −0.61 V which is the reduction potential of CO2 to formate in the NHE scale. Further, the MOF displays a good CO2 uptake of 25 cm3 g−1 at 298 K and 1 bar pressure (Fig. 2d).
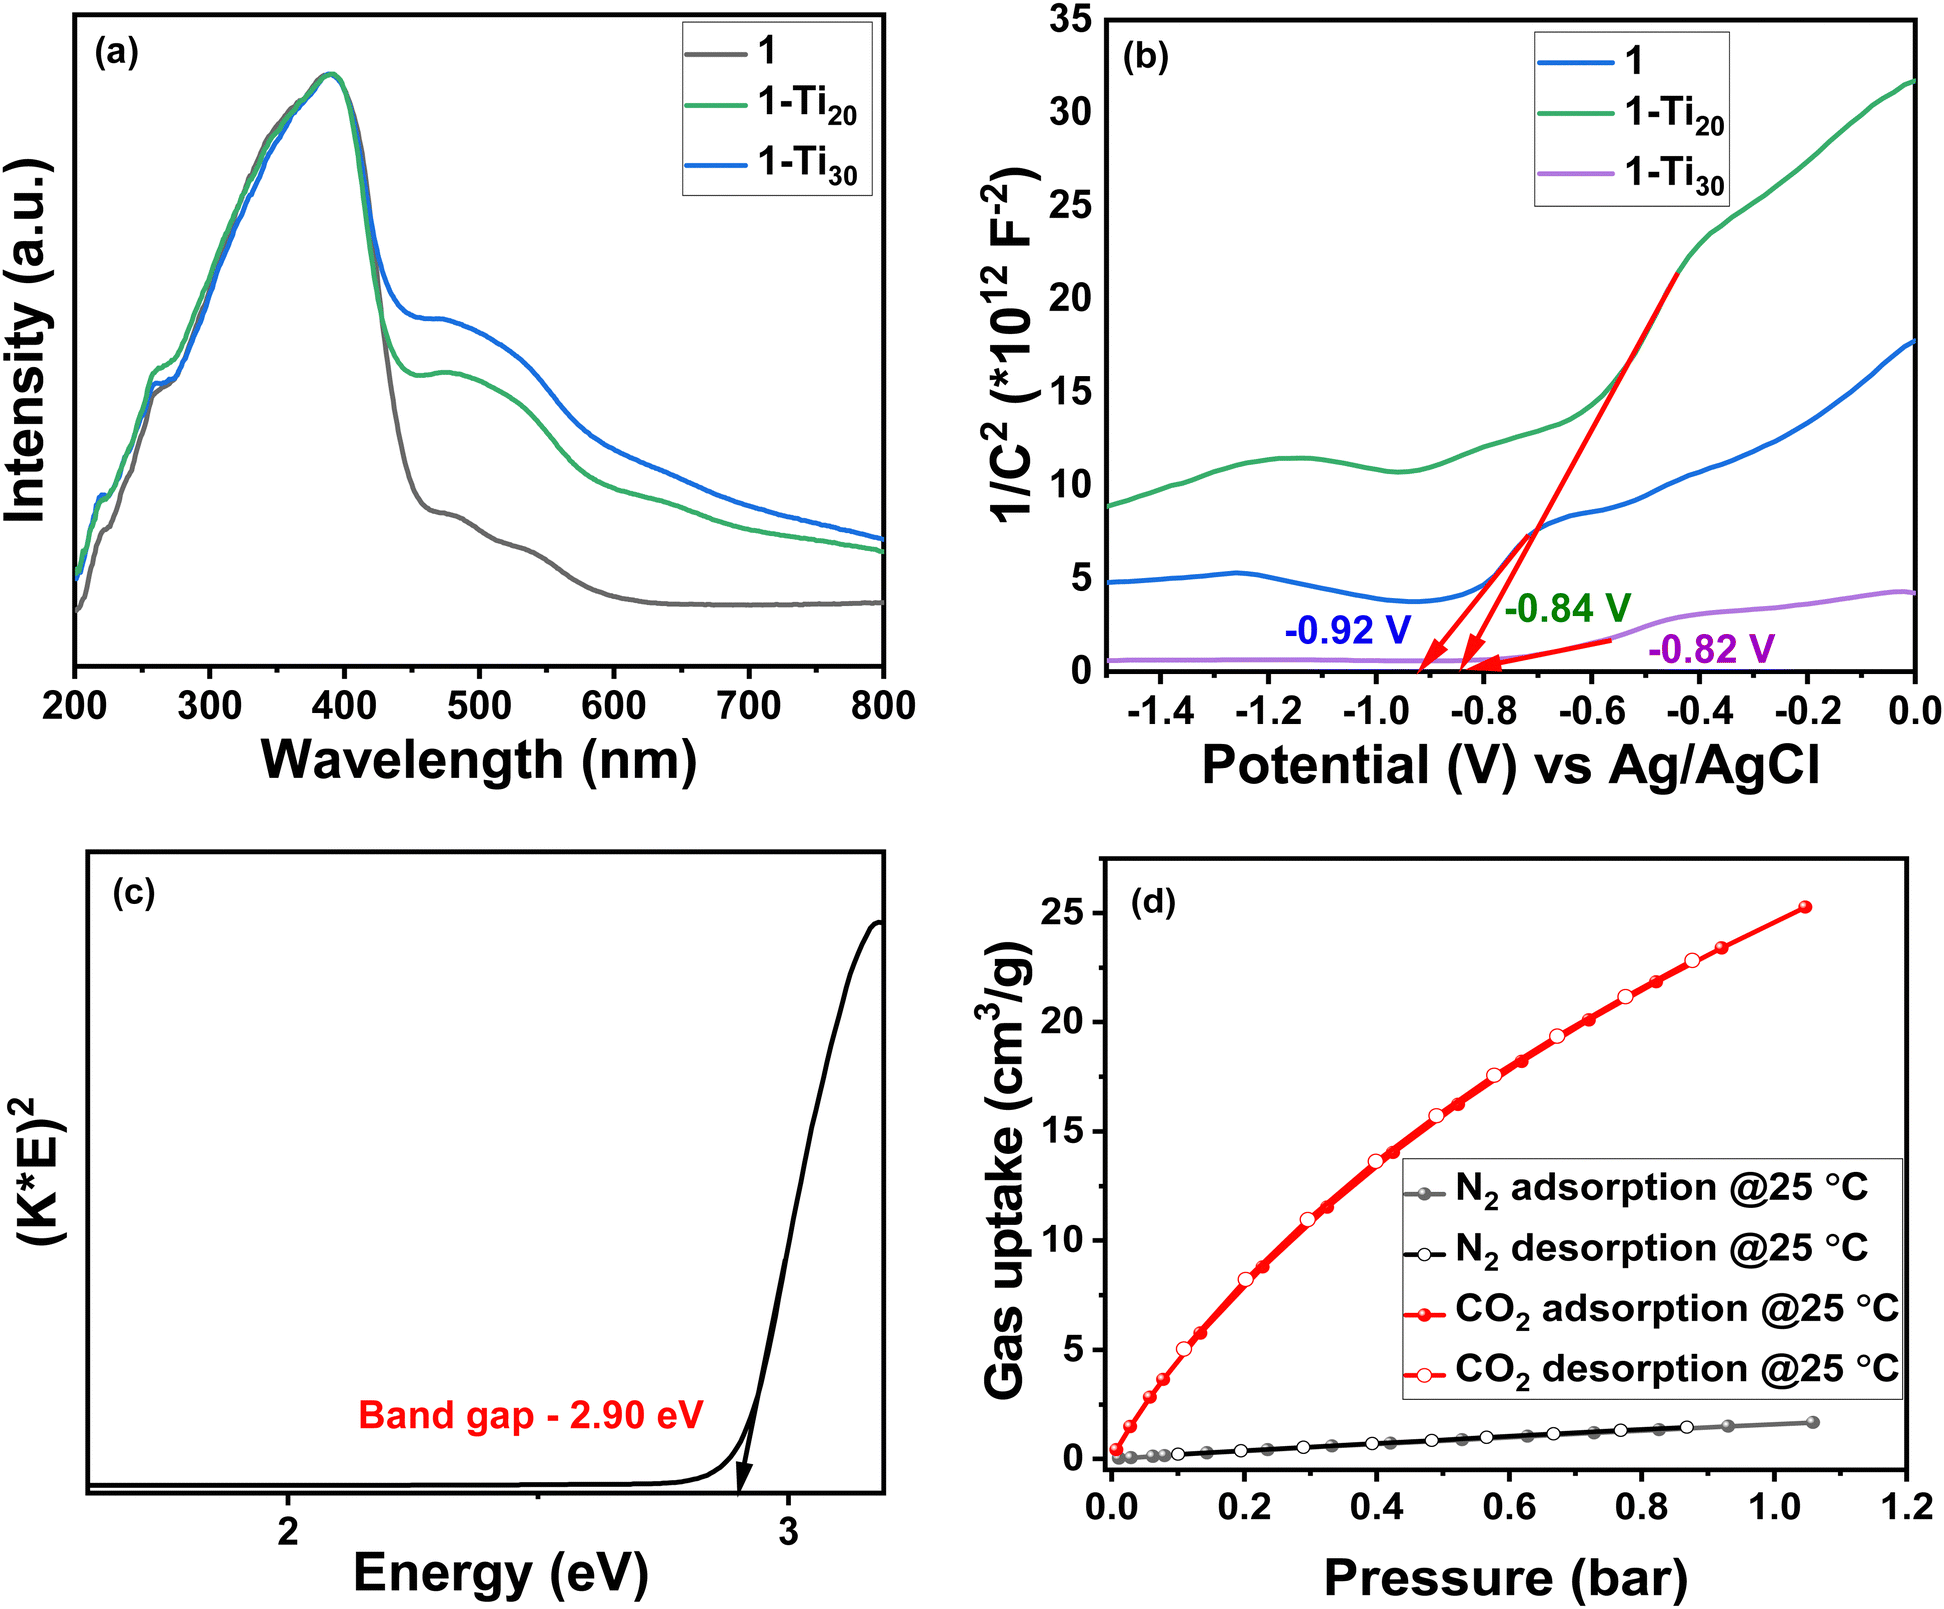 | ||
| Fig. 2 (a) UV-vis absorption spectra of 1, 1-Ti20, and 1-Ti30 showing major absorption peak broadening at 388 nm and secondary peak broadening at 510 nm for Ti-exchanged samples. (b) Mott–Schottky plot for the conduction band position determination at a 500 Hz frequency. (c) Kubelka–Munk plot showing the band gap of 1. (d) CO2 and N2 adsorption isotherms for 1. | ||
A decrease in the band gap can increase the number of electrons that can be transferred from the valence band to the conduction band. A reduction in the band gap can be induced in the material in several ways as reported in the literature.20,25,26 One method among them is the introduction of another metal having a low energy conduction band.14,19 This allows the existence of an intermediate low-energy conduction band of the added metal near the ligand valence band. Hence electrons will be easily available in the conduction band when the material is shined with light. Here we decided to exchange the Zr sites in the MOF with Ti metal ions that have a low energy 3d conduction band compared to the 4d band of Zr. This can result in the transfer of a greater number of electrons in the conduction band upon light irradiation.
Varying concentrations of titanium isopropoxide solutions (5%, 10%, 20%, and 50%) were then prepared in dry DMF, and as-synthesized Zr-MOF crystals were immersed in the Ti solution and heated at 80 °C for 3 days. Among these exchanges, the higher amounts of exchanges of Ti metal obtained were 20% and 30%. The Ti-exchanged MOF samples were studied using scanning electron microscopy (SEM), energy dispersive spectroscopy, (EDS), X-ray fluorescence (XRF), X-ray photoelectron spectroscopy (XPS), and inductively coupled photoelectron-optical emission spectroscopy (ICP-OES) techniques. SEM–EDS images collected for the Ti-exchanged samples confirmed the presence of Ti (Fig. S7, ESI†). Further, the amount of Ti present in the exchanged sample was confirmed with the help of EDS elemental composition, XRF, and ICP-OES (Table S2, ESI†). The XPS survey spectrum of the Ti-exchanged MOF showed the appearance of an extra peak at 459.5 eV corresponding to the binding energy of Ti (Fig. S8, ESI†). Additionally, deconvoluted Ti 2p XPS spectra showed a doublet at 548.7 eV and 564.4 eV originating from spin–orbit splitting (Fig. S9 and S10, ESI†). Binding energies of 285.08 eV and 288.48 eV in the C 1s spectra correspond to C–C and C![[double bond, length as m-dash]](https://www.rsc.org/images/entities/char_e001.gif) O bonds. Similarly, in O 1s spectra, three distinct bands at 529.9 eV, 531.7 eV, and 533.7 eV indicate COOH, Zr–O–C, and Zr–O–Zr, respectively (Fig. S11, ESI†).27–30 The PXRD patterns of the Ti-exchanged samples showed good crystallinity and similarity to 1 (Fig. S12, ESI†).
O bonds. Similarly, in O 1s spectra, three distinct bands at 529.9 eV, 531.7 eV, and 533.7 eV indicate COOH, Zr–O–C, and Zr–O–Zr, respectively (Fig. S11, ESI†).27–30 The PXRD patterns of the Ti-exchanged samples showed good crystallinity and similarity to 1 (Fig. S12, ESI†).
Depending on the amount of Ti present, the two Ti-exchanged products are named 1-Ti20 and 1-Ti30, where the percentage of Ti exchange was 20 and 30, respectively. The UV-vis spectrum and the band gap energies were recorded for 1-Ti20 and 1-Ti30 (Fig. 2a). The absorptions around 388 nm and 510 nm are present in both cases like the pristine material. Additionally, the peak broadening observed in the Q band around 510 nm in Ti-exchanged MOFs was a consequence of the ligand-to-metal charge transfer process.14,19 Hence, the change in the lowest unoccupied molecular orbital (LUMO) from 4d to 3d impacts the band gap of the Ti-exchanged MOFs.
The increase in Ti metal exchange from 20% to 30% decreased the band gap of the parent MOF material from 2.90 eV to 2.86 eV and 2.80 eV, respectively, thus proving that the extent of reduction in the band gap is dependent on the number of Zr sites replaced with Ti in the MOF structure (Fig. S13, ESI†). The conduction band positions are found to be −0.84 V and −0.82 V for 1-Ti20 and 1-Ti30 (vs. Ag/AgCl), respectively, and −0.64 V and −0.62 V when expressed in NHE (Fig. 2b). In addition to exchange with Zr sites, there could also be additional Ti metal ions present around the clusters forming Ti–O linkages.19 Attempts were made to collect the single crystal structures to locate the exact Ti sites but the exchanged crystals showed a weak diffraction pattern. The TGA was performed for the exchanged samples and found that they show similar thermograms to the pristine MOF. The initial weight loss was observed before 200 °C and gradually decomposition happened at higher temperature (Fig. S14, ESI†). The BET surface area of the Ti-exchanged samples confirmed the retention of the structural integrity after the exchange process. However, a reduction in the N2 uptake was observed, which could possibly be due to the presence of Ti ions in the MOF pores in addition to the ones present in the hexanuclear cluster (Fig. S15, ESI†). Later the CO2 sorption ability of 1-Ti20 and 1-Ti30 was checked at room temperature and normal atmospheric pressure. These values were compiled with the N2 uptake collected in the same conditions. It can be observed that a decrease in the CO2 uptake has happened in the exchanged samples. The uptake value has reduced from 25 cm3 g−1 to 20 cm3 g−1 and 18 cm3 g−1 following the order 1 > 1-Ti20 > 1-Ti30 (Fig. S16, ESI†).
The photocatalytic experiments were carried out in the aqueous medium containing 0.1 M sodium bicarbonate and 0.2 M sodium sulfite. The sacrificial ability of the catalyst in the reaction medium was confirmed before the catalytic experiments. The catalyst was stable in water for more than one week and in the bicarbonate medium throughout the experiment time (4 hours). A 125 W medium-pressure mercury vapor lamp which emits UV radiation of 3.5 eV energy was used as the source of photo-irradiation to carry out the reaction. The selection of the light source is made depending on the band gap of the catalyst. The source energy should be slightly higher than the band gap to make sure that sufficient electrons are excited from the valence band to the conduction band. 3.5 eV energy is sufficient to excite electrons from the valence band to the conduction band since the band gap of the material is 2.9 eV.3,25 The photocatalytic setup is shown in Fig. S17 (ESI†). Light irradiation caused the production of formate, which was confirmed with the help of 1H-NMR (Fig. S18, ESI†). Also, when the reaction was carried out in the absence of light, no formate was formed, which confirmed that the production of formate is a result of the photocatalytic CO2 reduction process (Fig. S19, ESI†). It is noteworthy that formic acid is often used as a modulator in the synthesis of Zr MOFs; therefore, it is imperative to rule out the production of formic acid due to the release of modulator molecules from the metal clusters. To confirm this, the experiment was carried out in the aqueous medium alone without CO2 flow into the reactor and no formate peak was observed in the NMR for this reaction (Fig. S20, ESI†).
Product quantification was done using p-nitrophenol as the internal standard. As time progressed, the integrated area of the reference reduced with respect to the formate peak indicating an increase in the formate concentration6,22,31,32 (Fig. S21–S24, ESI†). The maximum amount of formate produced from the parent MOF catalyst was 7.6 μmol in 4 h, which resulted in the production of 152 μmol g−1 of formate at a rate of 38 μmol g−1 h−1 (Fig. 3). Carbon monoxide (CO) is another common product in Zr MOFs. The reduction potential of CO2 to CO is −0.53 V in NHE. Due to the unavailability of the gas chromatography equipment, we could not analyze and quantify CO. Similarly, under the same conditions, a photo experiment was carried out for Ti-exchanged samples. In four hours, the 1-Ti20 sample gave a yield of 200 μmol g−1 with a 50 μmol g−1 h−1 production rate, whereas 1-Ti30 showed a higher production of 284 μmol g−1 at a rate of 71 μmol g−1 h−1 (Fig. 3).
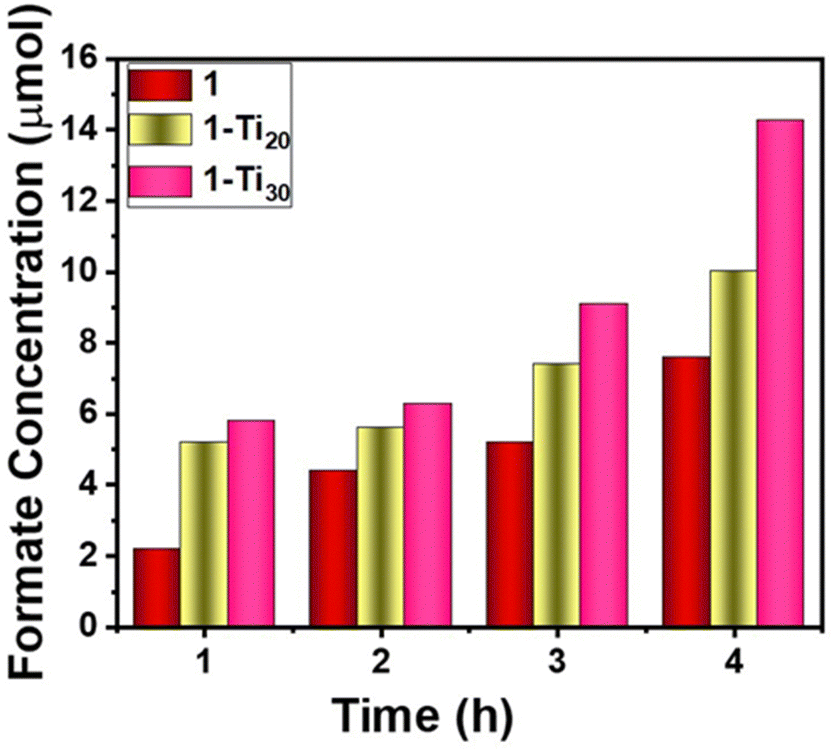 | ||
| Fig. 3 Formate production at different time intervals with different catalysts. | ||
A literature comparison is given in Table 1 for the production of formate with different MOF catalysts. Zr- and Fe-based MOFs like UiO-66(Zr/Ti)–NH2, PCN-222, and MIL-88 showed the highest production rates of formate under photoirradiation. The Ti-exchanged 1-Ti30 in this work showed nearly double the production rate compared to its pristine 1 version. This value overtook the production of formate for the Zr-based MOFs like PCN-222, NNU 28, amino functionalized UiO-66, and a few other MOFs. Also, we have checked the catalytic activity of the pristine MOF in the organic media (ACN/TEOA, 4:1) to check its efficiency for CO2 reduction. The production rate was found to be 10.5 μmol g−1 h−1, which was less than that in the aqueous media (Fig. S25 and S26, ESI†). To understand the improved catalytic properties of the Ti-exchanged MOF catalyst, we compared the electronic properties of the MOFs. The photoinduced charge separation was studied using photoluminescence (PL) and photocurrent studies. A major emission band is seen at 468 nm in all the MOFs when excited at 395 nm in the solid state (Fig. 4a).
| Catalyst | Irradiation range and illumination intensity | Reaction condition | Irradiation time per cycle (h) | Product formation rate (μmol h−1 g−1) | Ref. |
|---|---|---|---|---|---|
| NNU-28 | Visible light 420 nm < λ < 800 nm (300 W Xe lamp) | MeCN/TEOA (30:1) 50 mg catalyst |
10 | 52.8 | 33 |
| PCN-222 | Visible light 420 nm < λ < 800 nm (300 W Xe lamp) | MeCN/TEOA (10:1) 50 mg catalyst |
10 | 60 | 16 |
| NH2–Uio-66(Zr) | Visible light 420 nm < λ < 800 nm (500 W Xe lamp) | MeCN/TEOA (5:1) 50 mg catalyst |
10 | 41.4 | 34 |
| UiO-66(Zr/Ti)–NH2 | Visible light 420 nm < λ < 800 nm (300 W Xe lamp) | MeCN/TEOA (4:1 v/v), 0.1 M BNAH 5 mg catalyst |
6 | 148.2 | 20 |
| MIL-125(Ti) | Visible light 420 nm < λ < 800 nm (500 W Xe lamp) | MeCN/TEOA (5:1) |
10 | 4.28 | 9 |
| NH2–MIL-125(Ti) | Visible light 420 nm < λ < 800 nm (500 W Xe lamp) | MeCN/TEOA (5:1) |
10 | 16.28 | 9 |
| MIL-88(Fe) | Visible light 420 nm < λ < 800 nm (300 W Xe lamp) | MeCN/TEOA (5:1) |
8 | 22.5 | 35 |
| NH2–MIL-88(Fe) | Visible light 420 nm < λ < 800 nm (300 W Xe lamp) | MeCN/TEOA (5:1) |
8 | 75 | 35 |
| Pt/NH2–MIL-125(Ti) | Visible light 420 nm < λ < 800 nm (300 W Xe lamp) | MeCN/TEOA (5:1) 50 mg catalyst |
8 | 32.4 | 36 |
| Zr anthracene MOF | UV light 150 W (280 nm < λ < 400 nm) | H2O | 25 | 81.25 | 37 |
| Zr stilbene | 300 W Xe lamp (420 nm < λ < 800 nm) | CH3CN/TEOA (50 mL, v/v = 30/1) | 12 | 96.2 μmol h−1 mmolMOF−1 | 38 |
| 1 | UV-vis 125 W medium pressure Hg vapor lamp (200 nm < λ < 400 nm) |
H
2
O/Na
2
SO
3
(1![[thin space (1/6-em)]](https://www.rsc.org/images/entities/b_char_2009.gif) :1) 50 mg catalyst :1) 50 mg catalyst
|
4 | 38 | This work |
| 1-Ti20 | UV-vis 125 W medium pressure Hg vapor lamp (200 nm < λ < 400 nm) |
H
2
O/Na
2
SO
3
(1:1) 50 mg catalyst
|
4 | 50 | This work |
| 1-Ti30 | UV-vis 125 W medium pressure Hg vapor lamp (200 nm < λ < 400 nm) |
H
2
O/Na
2
SO
3
(1:1) 50 mg catalyst
|
4 | 71 | This work |
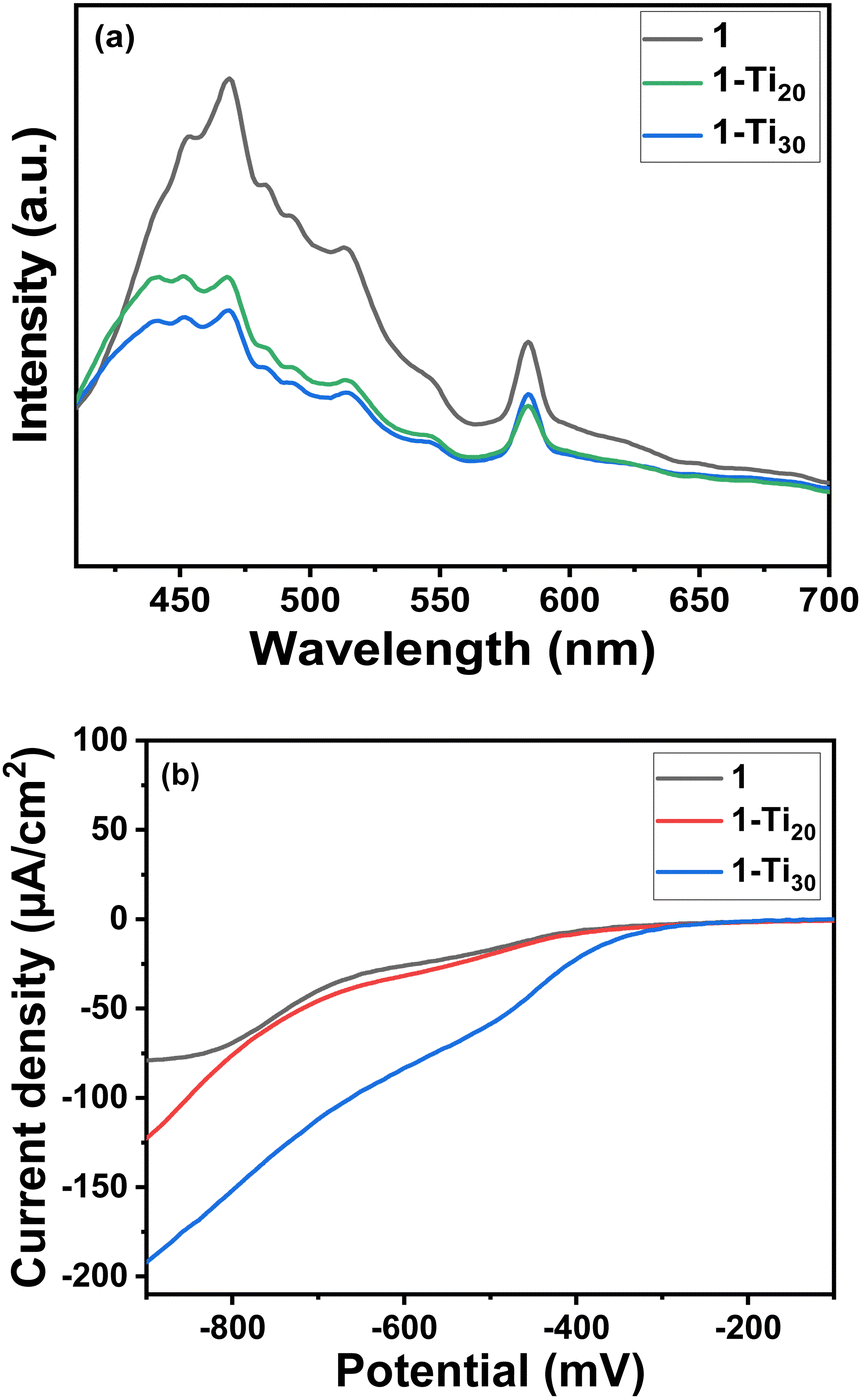 | ||
| Fig. 4 (a) Photoluminescent spectra of the MOFs at an excitation wavelength of 395 nm. (b) Photocurrent experiment showing current produced for different MOFs in the light on condition. | ||
But interestingly the emission intensity decreased with the increase in the Ti atomic percentage, which indicates that the electron–hole pair showed a lower recombination rate. This can be due to more charge transfer from the linker to the inorganic building unit in the Ti-exchanged samples.19,20 Also, among the MOFs, the photocurrent value was higher for 1-Ti30 and minimal for 1 (Fig. 4b and Fig. S27, ESI†). This means, when light shines, maximum free electrons are generated in the samples following the order 1-Ti30 > 1-Ti20 > 1 proving a better yield in the 1-Ti30 sample. The availability of electrons generated for the reaction depends also on the intrinsic resistance developed in the material towards the charge-carrying electrons. Hence the charge transfer resistance study is carried out (Fig. S23, ESI†). 1-Ti30 has the lowest diameter semi-circle impedance spectra followed by 1-Ti20 and the pristine MOF 1 (Fig. S28, ESI†). The charge transfer resistance study proves minimum resistance to electron flow in 1-Ti30 compared to the pristine MOF. Finally, the position of the valence band was determined from the calculated values of the bandgap (from UV-vis spectra) and the conduction band (Mott–Schottky plot) for all the catalysts (Fig. 5). NHE values are correlated with its corresponding electron volt scale. In all the catalysts, the conduction band lies near the reduction potential value of CO2 to formate in the NHE scale. But for the 1-Ti30 sample the conduction band almost overlaps with the CO2 reduction potential value. Hence, the reduction rate in this case is seen to be greater compared to the other catalysts.
 | ||
| Fig. 5 The optical band diagram of the catalysts in a comparative scale of NHE vs. eV. The valence band positions are determined from the Kubelka–Munk plot and Mott–Schottky plots. | ||
Conclusions
In conclusion, a Zr–TNDI MOF acts as a good catalyst for the conversion of CO2 to formate. Along with its semiconducting properties, the redox-active tetracarboxylate naphthalene diimide core also helps in harvesting light and electron transport to the SBU. The post-synthetic exchange with Ti metal helped in the fine-tuning of band gap values resulting in a better overlap between the conduction band of the MOF and the reduction potential value of CO2/HCOOH. This enhanced the production rate in post-synthetically modified MOFs compared to the parent MOF. This work shows that the post-synthetic metal exchange of the MOFs containing redox-active linkers could be a good strategy for designing efficient catalysts for CO2 reduction processes.Author contributions
ACP conceptualized the work and wrote the manuscript. ACP and GR synthesized and characterized the MOF. PCM helped with the photocatalytic experiments. SR and HA reviewed and corrected the manuscript.Data availability
The data supporting this article have been included as part of the ESI.†Conflicts of interest
There are no conflicts to declare.Acknowledgements
HA thanks DST-SERB for funding (grant sanction order number CRG/2022/004414) and ACP thanks BITS-Pilani, Hyderabad for research fellowship. The authors thank BITS-Pilani, Hyderabad Campus Central Analytical Laboratory for access to all the state-of-the-art facilities.Notes and references
- P. Shao, L. Yi, S. Chen, T. Zhou and J. Zhang, J. Energy Chem., 2020, 40, 156–170 CrossRef
.
- J. Albero, Y. Peng and H. García, ACS Catal., 2020, 10, 5734–5749 CrossRef CAS
- S. Karmakar, S. Barman, F. A. Rahimi, S. Biswas, S. Nath and T. K. Maji, Energy Environ. Sci., 2023, 16, 2187–2198 RSC
- K. P. Kuhl, E. R. Cave, D. N. Abram and T. F. Jaramillo, Energy Environ. Sci., 2012, 5, 7050–7059 RSC
- T. Kong, Y. Jiang and Y. Xiong, Chem. Soc. Rev., 2020, 49, 6579–6591 RSC
- S. Payra, S. Shenoy, C. Chakraborty, K. Tarafder and S. Roy, ACS Appl. Mater. Interfaces, 2020, 12, 19402–19414 CrossRef CAS PubMed
- C. Hon Lau, R. Babarao and M. R. Hill, Chem. Commun., 2013, 49, 3634–3636 RSC
- C. Hu, S. Bai, L. Gao, S. Liang, J. Yang, S. Cheng, S. Mi and J. Qiu, ACS Catal., 2019, 9, 11579–11588 CrossRef CAS
- Y. Fu, D. Sun, Y. Chen, R. Huang, Z. Ding, X. Fu and Z. Li, Angew. Chem., Int. Ed., 2012, 51, 3364–3367 CrossRef CAS PubMed
- C. Hu, Z. Jiang, Q. Wu, S. Cao, Q. Li, C. Chen, L. Yuan, Y. Wang, W. Yang, J. Yang, J. Peng, W. Shi, M. Zhai, M. Mostafavi and J. Ma, Nat. Commun., 2023, 14, 1–11 Search PubMed
- D. Yang and B. C. Gates, ACS Catal., 2019, 9, 1779–1798 CrossRef CAS
- X. Yang, Z. Wen, Z. Wu and X. Luo, Inorg. Chem. Front., 2018, 5, 687–693 RSC
- D. Sun, W. Liu, M. Qiu, Y. Zhang and Z. Li, Chem. Commun., 2015, 51, 2056–2059 RSC
- A. Wang, Y. Zhou, Z. Wang, M. Chen, L. Sun and X. Liu, RSC Adv., 2016, 6, 3671–3679 RSC
- C. D. Windle, M. W. George, R. N. Perutz, P. A. Summers, X. Z. Sun and A. C. Whitwood, Chem. Sci., 2015, 6, 6847–6864 RSC
- H. Q. Xu, J. Hu, D. Wang, Z. Li, Q. Zhang, Y. Luo, S. H. Yu and H. L. Jiang, J. Am. Chem. Soc., 2015, 137, 13440–13443 CrossRef CAS PubMed
- H. Huang, X. S. Wang, D. Philo, F. Ichihara, H. Song, Y. Li, D. Li, T. Qiu, S. Wang and J. Ye, Appl. Catal., B, 2020, 267, 118686 CrossRef CAS
- H. L. Nguyen, T. T. Vu, D. Le, T. L. H. Doan, V. Q. Nguyen and N. T. S. Phan, ACS Catal., 2017, 7, 338–342 CrossRef CAS
- S. Navalon and A. Fateeva, J. Mater. Chem. A, 2022, 10, 24938–24950 RSC
- Y. Lee, S. Kim, J. K. Kang and S. M. Cohen, Chem. Commun., 2015, 1, 5735–5738 RSC
- G. Radha, S. Roy, C. Chakraborty and H. Aggarwal, Chem. Commun., 2022, 58, 4024–4027 RSC
- T. Chatterjee, E. Boutin and M. Robert, Dalt. Trans., 2020, 49, 4257–4265 RSC
- Y. Zhang, X. Zhang, Z. Chen, K. Otake, G. W. Peterson, Y. Chen, X. Wang, L. R. Redfern, S. Goswami, P. Li, T. Islamoglu, B. Wang and O. K. Farha, ChemSusChem, 2020, 13, 1710–1714 CrossRef CAS PubMed
- P. H. M. Andrade, H. Ahouari, C. Volkringer, T. Loiseau, H. Vezin, M. Hureau and A. Moissette, ACS Appl. Mater. Interfaces, 2023, 15, 31032–31048 CrossRef CAS PubMed
- X. Jiao, K. Zheng, L. Liang, X. Li, Y. Sun and Y. Xie, Chem. Soc. Rev., 2020, 49, 6592–6604 RSC
- Y. Chen, D. Wang, X. Deng and Z. Li, Catal. Sci. Technol., 2017, 7, 4893–4904 RSC
- C. Sun, L. Liu, L. Qi, H. Li, H. Zhang, C. Li, F. Gao and L. Dong, J. Colloid Interface Sci., 2011, 364, 288–297 CrossRef CAS PubMed
- M. Li, X. Li, G. Jiang and G. He, Ceram. Int., 2015, 41, 5749–5757 CrossRef CAS
- A. Melillo, M. Cabrero-Antonino, S. Navalón, M. Álvaro, B. Ferrer and H. García, Appl. Catal., B, 2020, 278, 119345 CrossRef CAS
- A. Santiago-Portillo, S. Navalón, M. Álvaro and H. García, J. Catal., 2018, 365, 450–463 CrossRef CAS
- S. Payra and S. Roy, J. Phys. Chem. C, 2021, 125, 8497–8507 CrossRef CAS
- S. Payra, S. Ray, R. Sharma, K. Tarafder, P. Mohanty and S. Roy, Inorg. Chem., 2022, 61, 2476–2489 CrossRef CAS PubMed
- D. Chen, H. Xing, C. Wang and Z. Su, J. Mater. Chem. A, 2016, 4, 2657–2662 RSC
- D. Sun, Y. Fu, W. Liu, L. Ye, D. Wang, L. Yang, X. Fu and Z. Li, Chem. – A Eur. J, 2013, 19, 14279–14285 CrossRef CAS PubMed
- D. Wang, R. Huang, W. Liu, D. Sun and Z. Li, ACS Catal., 2014, 4, 4254–4260 CrossRef CAS
- D. Sun, W. Liu, Y. Fu, Z. Fang, F. Sun, X. Fu, Y. Zhang and Z. Li, Chem. – A Eur. J, 2014, 20, 4780–4788 CrossRef CAS PubMed
- S. K. Mostakim, S. Barman, S. Paul, R. De, S. S. Sreejith, H. Reinsch, M. Grzywa, N. Stock, D. Volkmer, S. Biswas and S. Roy, Chem. – A Eur. J, 2021, 27, 4098–4107 CrossRef
- M. Sun, S. Yan, Y. Sun, X. Yang, Z. Guo, J. Du, D. Chen, P. Chen and H. Xing, Dalt. Trans., 2018, 47, 909–915 RSC
Footnote |
| † Electronic supplementary information (ESI) available: Materials and physical measurements, synthesis, PXRD patterns, BET, SEM, etc. See DOI: https://doi.org/10.1039/d4ma00517a |
| This journal is © The Royal Society of Chemistry 2024 |