 Open Access Article
Creative Commons Attribution 3.0 Unported Licence
Hydroflux-assisted cold sintering: eutectic mixtures for boosting ionic conductivity in LATP solid-state electrolytes†
Andrés
Mormeneo-Segarra
 ab,
Sergio
Ferrer-Nicomedes
 ab,
Nuria
Vicente-Agut
 *ab and
Antonio
Barba-Juan
 ab
ab
aDepartment of Chemical Engineering, Universitat Jaume I, 12071, Castellón, Spain. E-mail: vicenten@uji.es
bInstitute of Ceramic Technology, Universitat Jaume I, 12071, Castellón, Spain
First published on 11th July 2024
Abstract
Superior electrical properties have been achieved for a Li1.3Al0.3Ti1.7(PO4)3 (LATP) solid-state electrolyte (SSE) by using the novel hydroflux-assisted cold sintering process (HACSP) at 400 MPa, 200 °C and 90 minutes of sintering time. The use of the eutectic LiOH:LiNO3 mixture, with 20 wt% content, as an hydroflux to assist the CSP has allowed to obtain a total ionic conductivity of 1.51 × 10⁻⁴ S cm−1 and an activation energy of 0.366 eV. Using water to better distribute the hydroflux along the LATP structure was found to be critical to the homogeneity and properties of the sample.
Introduction
Energy has become the key piece on the chessboard in recent years, which is why an efficient and environmentally friendly form of storage is required. Solid state batteries (SSBs) are the most likely candidates to meet the future efforts and challenges to come.1–3 The use of solid state electrolytes (SSEs) in SSBs presents the greatest challenge in terms of design and performance, as they can prevent the growth of dendrites, providing greater stability to possible chemical reactions.4 The SSEs studied so far have different structures,5 of which NASICON is the most prominent. Among the materials with this type of structure, Li1.3Al0.3Ti1.7(PO4)3 (LATP) stands out for its high total ionic conductivity (∼10−3 S cm−1) as well as its stability in the presence of ambient humidity.6 In order to use SSEs in SSBs, the LATP powder has to be sintered. The method of sintering largely determines the properties of the final electrolyte, and the cost of manufacture. The cold sintering process (CSP) has emerged as a promising sintering technique to reduce the temperature and operating times, in contrast to conventional sintering techniques.7,8 The CSP is based on reducing high sintering temperatures by using a transient liquid phase (TLP), a low temperature (below 350 °C) and a pressure of hundreds of MPa. Sintering takes place through a mass transfer mechanism called pressure solution creep based on the dissolution–precipitation of the material in the TLP: the material is dissolved in the outer surface of the particles and, after evaporation of the TLP, it is precipitated at grain boundaries. The CSP has made it possible to obtain highly densified samples with excellent final physical properties.9 Most of the studies in the literature on the CSP show that liquids at room temperature are used as a TLP, which evaporate at a temperature close to, but below the process temperature. However, the possibility of using hydrofluxes as a TLP has recently been tested, achieving good properties as shown in.Table 1. In this case, a mixture of solid materials, that form an eutectic at sintering temperatures, acts as a TLP, remaining as a solid intergranular phase at room temperature.
| Material | Hydroflux | CSP conditions | Rel. density ϕ (%) | Ref. | |||
|---|---|---|---|---|---|---|---|
| P (MPa) | T (°C) | t (min) | TLP | ||||
| LAGP | LiNO3![[thin space (1/6-em)]](https://www.rsc.org/images/entities/char_2009.gif) : :![[thin space (1/6-em)]](https://www.rsc.org/images/entities/char_2009.gif) LiOH (60 LiOH (60![[thin space (1/6-em)]](https://www.rsc.org/images/entities/char_2009.gif) : :![[thin space (1/6-em)]](https://www.rsc.org/images/entities/char_2009.gif) 40 mol%) 40 mol%) |
400 | 220 | 300 | 18 (wt%) | 88–92 | 10 |
| ZnO | ZnO(OAc2)·2H2O | 530 | 120 | 30 | 4 | ∼97 | 11 |
| ZnO | NaOH![[thin space (1/6-em)]](https://www.rsc.org/images/entities/char_2009.gif) : :![[thin space (1/6-em)]](https://www.rsc.org/images/entities/char_2009.gif) KOH (51 KOH (51![[thin space (1/6-em)]](https://www.rsc.org/images/entities/char_2009.gif) : :![[thin space (1/6-em)]](https://www.rsc.org/images/entities/char_2009.gif) 49 mol%) 49 mol%) |
90 | 200 | 30 | 5 + 5 of H2O (vol%) | 96 | 12 |
| BaTiO3 | NaOH![[thin space (1/6-em)]](https://www.rsc.org/images/entities/char_2009.gif) : :![[thin space (1/6-em)]](https://www.rsc.org/images/entities/char_2009.gif) KOH (50 KOH (50![[thin space (1/6-em)]](https://www.rsc.org/images/entities/char_2009.gif) : :![[thin space (1/6-em)]](https://www.rsc.org/images/entities/char_2009.gif) 50 mol%) 50 mol%) |
520 | 300 | 720 | 4–6 (wt%) | 98–99 | 13 |
| KNN | NaOH![[thin space (1/6-em)]](https://www.rsc.org/images/entities/char_2009.gif) : :![[thin space (1/6-em)]](https://www.rsc.org/images/entities/char_2009.gif) KOH (50 KOH (50![[thin space (1/6-em)]](https://www.rsc.org/images/entities/char_2009.gif) : :![[thin space (1/6-em)]](https://www.rsc.org/images/entities/char_2009.gif) 50 mol%) 50 mol%) |
400 | 200 | ∼60 | 4–10 (vol%) | >92 | 14 |
| KNN | NaOH![[thin space (1/6-em)]](https://www.rsc.org/images/entities/char_2009.gif) : :![[thin space (1/6-em)]](https://www.rsc.org/images/entities/char_2009.gif) KOH (50 KOH (50![[thin space (1/6-em)]](https://www.rsc.org/images/entities/char_2009.gif) : :![[thin space (1/6-em)]](https://www.rsc.org/images/entities/char_2009.gif) 50 mol%) 50 mol%) |
400 | 200 | 120 | 10 (vol%) | 93 | 15 |
Recently, Takashima et al.10 have obtained cold-sintered samples of Li1.5Al0.5Ge1.5(PO4)3 (LAGP) by using the mixture LiNO3![[thin space (1/6-em)]](https://www.rsc.org/images/entities/char_2009.gif) :
:![[thin space (1/6-em)]](https://www.rsc.org/images/entities/char_2009.gif) LiOH (60
LiOH (60![[thin space (1/6-em)]](https://www.rsc.org/images/entities/char_2009.gif) :
:![[thin space (1/6-em)]](https://www.rsc.org/images/entities/char_2009.gif) 40 mol%) as a hydroflux to assist the CSP. They obtained ionic conductivities ranging from 0.8 × 10⁻⁵ to 1.9 × 10⁻⁵ S cm−1 and a total activation energy of 0.42 ± 0.01 eV, concluding that the use of the hydroflux improved the electrical properties of the LAGP pellets because of the non-formation of the AlPO4 layer at the grain boundaries.
40 mol%) as a hydroflux to assist the CSP. They obtained ionic conductivities ranging from 0.8 × 10⁻⁵ to 1.9 × 10⁻⁵ S cm−1 and a total activation energy of 0.42 ± 0.01 eV, concluding that the use of the hydroflux improved the electrical properties of the LAGP pellets because of the non-formation of the AlPO4 layer at the grain boundaries.
To elucidate how this hydroflux affects the CSP of LATP powder and enhance its final properties, the authors prepared different LATP samples at ultra-low temperature with various hydroflux contents and found an optimum content of 20 wt% (with 5 wt% water as the homogenizing agent). The outstanding electrical properties obtained were a total ionic conductivity of 1.51 × 10⁻⁴ S cm−1 and an activation energy of 0.366 eV that are competitive with the ones obtained via conventional sintering at high temperatures.
Materials and methods
Li1.3Al0.3Ti1.7(PO4)3 powder was prepared via a solid-state reaction as described in ref. 16 with a mean particle size of 0.415 μm. The hydroflux LiNO3![[thin space (1/6-em)]](https://www.rsc.org/images/entities/char_2009.gif) :
:![[thin space (1/6-em)]](https://www.rsc.org/images/entities/char_2009.gif) LiOH (99 and 98% purity – Sigma Aldrich) was prepared by dissolving a mixture of LiNO3 and LiOH in a molar ratio of 60
LiOH (99 and 98% purity – Sigma Aldrich) was prepared by dissolving a mixture of LiNO3 and LiOH in a molar ratio of 60![[thin space (1/6-em)]](https://www.rsc.org/images/entities/char_2009.gif) :
:![[thin space (1/6-em)]](https://www.rsc.org/images/entities/char_2009.gif) 40 in distilled water to obtain good homogeneity. When complete dissolution was achieved, the mixture was dried in an oven at 100 °C. The dried mixture was mixed with a mortar and pestle to homogenize the resulting eutectic. A schematic view can be seen in Fig. 1(a).
40 in distilled water to obtain good homogeneity. When complete dissolution was achieved, the mixture was dried in an oven at 100 °C. The dried mixture was mixed with a mortar and pestle to homogenize the resulting eutectic. A schematic view can be seen in Fig. 1(a).
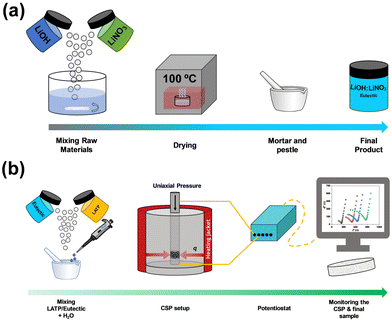 | ||
| Fig. 1 (a) Preparation of eutectic mixtures. (b) CSP sample processing and in operando impedance measurements. | ||
Two different amounts of hydroflux, 15 and 20 wt% (higher levels lead to powder leakage from the mould), were added to the LATP powder with 5 wt% H2O (15@H2O and 20@H2O samples) to improve the homogenization process of the LATP and the hydroflux, as shown in Fig. 1(b). Two other different samples were prepared without water as the homogenizing agent: one containing 20 wt% hydroflux (20@no-H2O sample) and the other one simply by directly mixing the LiOH and LiNO3 (without any previous treatment, 20@solids samples). Table 2 summarizes the four tested samples. The CSP experiments were carried out at 400 MPa, 200 °C and 90 minutes of dwell time, as these conditions allow the eutectic point of the hydroflux to be reached, as shown in Fig. 2, adapted from ref. 17, using an EQP-1 manual pellet press (EQUILAB). All sample's surface area equals 76.51 ± 0.01 mm2. Densities were measured by mercury immersion, and the results are shown in Table S1 of the ESI† with the procedure description.
![[thin space (1/6-em)]](https://www.rsc.org/images/entities/char_2009.gif) :
:![[thin space (1/6-em)]](https://www.rsc.org/images/entities/char_2009.gif) 40
40
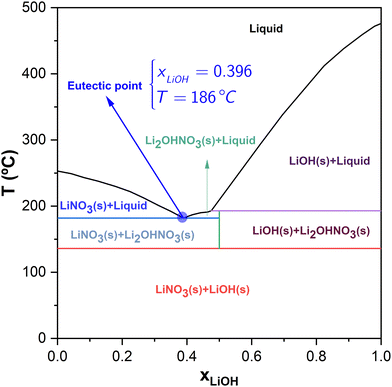 | ||
| Fig. 2 Phase diagram of the LiOH:LiNO3 mixture adapted from ref. 17. | ||
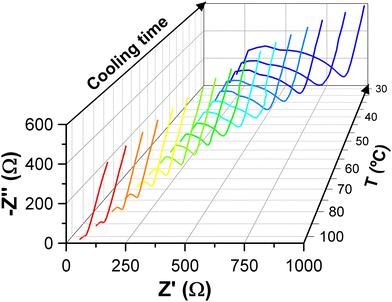
Potentiostatic impedance measurements were carried out along the CSP using a Multi Autolab M204 potentiostat from AUTOLAB equipped with an impedance module FRA32 controlled by Nova 2.1 software. In the frequency range 1 MHz–50 Hz, and with a perturbation of 0.2 V, further experimental details can be found in the literature.18,19 To fit the spectra, an equivalent circuit consisting of (RtotCPE1) (R1CPE2)C1 was used. Rtot, CPE1, and (R1CPE2)C1 represent the total resistance (sum of grain and grain-boundary), constant phase element and elements which fit impedance related to Li-ion diffusion within the electrolyte, respectively. Total ionic conductivities, σtot, were calculated by means of the following equation:
 | (1) |
Results and discussion
The normalized impedance spectra at 30 °C after the CSP, when no pressure is applied, are shown in Fig. 4 for the four tested samples together with the equivalent circuit used for the fitting. The values of the fitted spectra can be seen in Tables S2–S5 of the ESI,† where the last row in italics refers to the measurement without pressure. It can be observed how the 20@solid sample, prepared just by mixing the solids, has a resistance three or more times higher than the other samples. All the results are summarized in Table 3, where the activation energies are obtained from the Arrhenius plot shown in Fig. 5.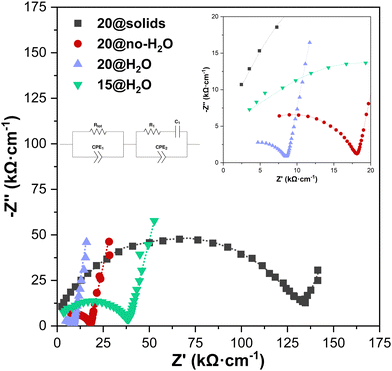 | ||
| Fig. 4 Normalized impedance spectra of the samples studied (symbols for experimental points and dotted line for the fitting). | ||
| Sample | R tot (kΩ) | t (mm) | σ tot (S cm−1) | E a (eV) |
|---|---|---|---|---|
| 20@solids | 14.885 | 1.10 | 9.66 × 10⁻⁶ | 0.595 ± 0.010 |
| 20@no-H2O | 2.267 | 1.22 | 7.03 × 10⁻⁵ | 0.358 ± 0.003 |
| 20@H2O | 0.875 | 1.01 | 1.51 × 10⁻⁴ | 0.366 ± 0.005 |
| 15@H2O | 4.664 | 1.20 | 3.36 × 10⁻⁵ | 0.434 ± 0.005 |
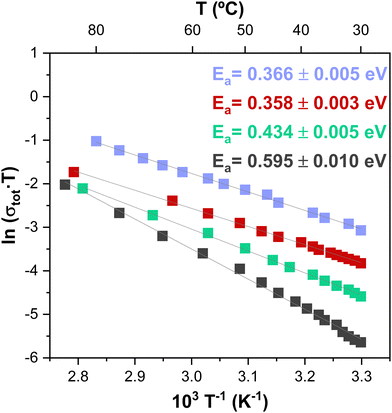 | ||
| Fig. 5 Arrhenius plot of the tested samples. The grey squares refer to 20@solids, the red ones to 20@no-H2O, the blue ones to 20@H2O and the green ones to 15@H2O. | ||
Sample 20@solids shows that mechanical mixing of the salts LiNO3 and LiOH with LATP leads to a non-homogeneous powder mixture, which worsens both the total ionic conductivity and activation energy, 9.66 × 10⁻⁶ S cm−1 and 0.595 eV, respectively. For the 20@no-H2O sample, the ionic conductivity is higher than in the previous one and the activation energy is lower: 7.03 × 10⁻⁵ S cm−1 and 0.358 eV, respectively. Despite the absence of water as the homogenizing agent, a previous mixing of both lithium chemicals (20@no-H2O) enhances the final properties when compared with the simultaneous mixing of raw lithium chemicals (20@solids). Both values are similar to those obtained by the authors when sintering the same LATP using a 3M acetic acid solution as the TLP instead of the eutectic LiNO3![[thin space (1/6-em)]](https://www.rsc.org/images/entities/char_2009.gif) :
:![[thin space (1/6-em)]](https://www.rsc.org/images/entities/char_2009.gif) LiOH (6.90 × 10⁻⁵ S cm−1 and 0.363 eV19).
LiOH (6.90 × 10⁻⁵ S cm−1 and 0.363 eV19).
Sample 20@H2O reveals the effect of water addition in a better homogenization process leading to a superior ionic conductivity (1.51 × 10⁻⁴ S cm−1) and an activation energy of 0.366 eV. This ionic conductivity is 2.2 times higher than that obtained with LATP cold-sintered using 3M acetic acid solution as the TLP [17]. Reducing the hydroflux content to 15 wt% (sample 15@H2O) results in the worsening of properties, although they are still competitive (ionic conductivity of 3.36 × 10⁻⁵ S cm−1 and activation energy of 0.434 eV). The increase of ∼20% in the activation energy reflects that a better homogenization process reduces the energetic barrier of the intergranular phase.
It should be emphasized that samples of LATP containing the hydroflux with appropriate processing prior to the CSP (i.e., samples 15@H2O and particularly 20@H2O):
(a) Have better ionic conductivity after the CSP than the same cold-sintered LATP with 3M acetic acid solution as the TLP, which means that the intergranular phase presents a lower energy barrier in terms of lithium-ion diffusion.
(b) Require lower demanding sintering conditions in terms of pressure (400 MPa) than the same cold-sintered LATP with 3M acetic acid solution as the TLP (700 MPa).
(c) Have better ionic conductivity than other LATP samples obtained via the CSP reported in the literature (see Table S6, ESI†). Some of these samples have undergone a post-annealing treatment.
The results demonstrate the positive impact of using a hydroflux as a TLP in the CSP on the ionic conductivity and its relevance towards the enhancement of the CSP.
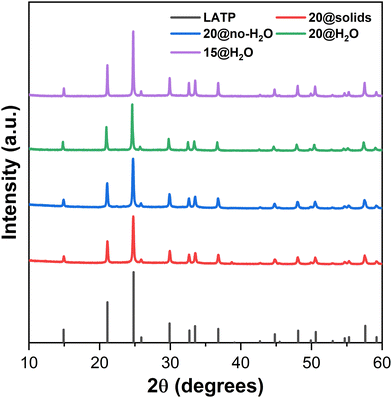
Samples were analysed by XRD, and the spectra are shown in Fig. 6. It can be observed that when eutectic mixtures were introduced into the CSP, no new peaks appeared with respect to the pure LATP (ICSD 14585), suggesting that eutectic forms a glassy phase that persists when cooling after sintering.
Fig. 7 shows the SEM images of the general microstructure for the tested samples. Two different behaviours can be observed: (i) for samples 20@solids and 20@no-H2O (Fig. 7(a) and (b)) the microstructure is heterogeneous, with pores denoting a poor sintering process, corresponding to a poor initial homogenization stage during sample preparation. Typically, the porosity leads to non-optimal properties in terms of ionic conductivity and/or activation energy; (ii) for samples 15@H2O and 20@H2O (Fig. 7(c) and (d)), the microstructure is markedly different. There is a homogeneous microstructure aimed by two factors, the introduction of the hydroflux in an appropriate amount and the use of water to better distribute the hydroflux around the LATP particles of the sample.
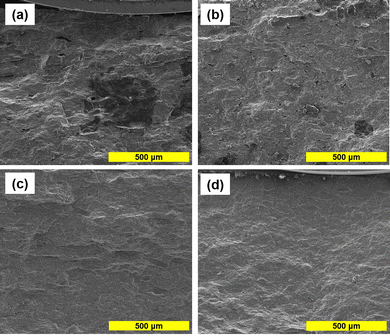 | ||
| Fig. 7 SEM images of the general microstructure of the tested samples: (a) 20@solids, (b) 20@no-H2O, (c) 15@H2O and (d) 20@H2O. | ||
For a better understanding, higher magnification images are shown in Fig. 8. These images show an improvement in the microstructure due to the effect of the hydroflux preparation and the addition of water as a homogenization agent in sample preparation. For the 20@solids sample (Fig. 8(a)), a non-homogeneous and discontinuous glassy phase appear over some LATP particles, proving that the hydroflux is in concentrated areas, justifying the poor densification due to its weak distribution. Fig. 8(b) shows the 20@no-H2O sample where hydroflux particles can be seen, different in shape from the LATP ones, reiterating the same behaviour as in the 20@solids sample, leading to a poor densification. To confirm this, an EDS mapping was carried out to identify if these particles correspond to the hydroflux. The results are shown in Fig. 9, where it can be seen that the contents of O and N are enhanced at these points due to the presence of LiOH and LiNO3, and the energy spectrum shows a peak corresponding to N. All these corroborate the previous discussion. The microstructures of 15@H2O and 20@H2O (Fig. 8(c) and (d)) show no clear difference between them. In both cases, the hydroflux is uniformly distributed, pointing out the influence of the use of water to enhance the homogenization of the hydroflux in the LATP and promote densification. The different hydroflux content of the 15@H2O and 20@H2O samples is responsible for obtaining such a high ionic conductivity for the 20@H2O sample, making it the optimal composition under these CSP conditions.
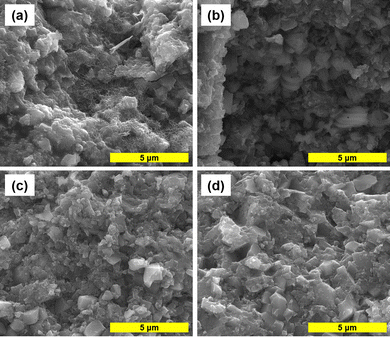 | ||
| Fig. 8 SEM images showing the distribution of the hydroflux along the microstructure of samples prepared (a) 20@solids, (b) 20@no-H2O, (c) 15@H2O and (d) 20@H2O. | ||
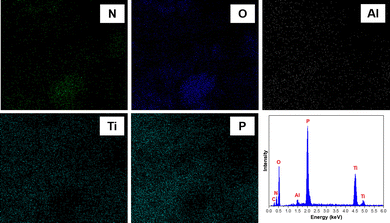 | ||
| Fig. 9 EDS mapping of the 20@no-H2O sample showing the most representative elements present and their energy spectra. | ||
Conclusions
In this work, the effect of hydroflux addition as a TLP for the CSP was validated. The hydroflux consisted of a eutectic mixture of LiNO3![[thin space (1/6-em)]](https://www.rsc.org/images/entities/char_2009.gif) :
:![[thin space (1/6-em)]](https://www.rsc.org/images/entities/char_2009.gif) LiOH in a molar ratio of 60
LiOH in a molar ratio of 60![[thin space (1/6-em)]](https://www.rsc.org/images/entities/char_2009.gif) :
:![[thin space (1/6-em)]](https://www.rsc.org/images/entities/char_2009.gif) 40 added to LATP, with and without water as a homogenizing agent. The effect of hydroflux addition resulted in an increase in the total ionic conductivity of up to 1.51 × 10⁻⁴ S cm−1 and an activation energy of 0.366 eV for the sample prepared at 400 MPa, 200 °C and 90 minutes of sintering time with 20 wt% of hydroflux. SEM images have demonstrated the necessity of water to initially disperse the hydroflux and obtain a well homogenized microstructure, as it has been pointed out to be a crucial step.
40 added to LATP, with and without water as a homogenizing agent. The effect of hydroflux addition resulted in an increase in the total ionic conductivity of up to 1.51 × 10⁻⁴ S cm−1 and an activation energy of 0.366 eV for the sample prepared at 400 MPa, 200 °C and 90 minutes of sintering time with 20 wt% of hydroflux. SEM images have demonstrated the necessity of water to initially disperse the hydroflux and obtain a well homogenized microstructure, as it has been pointed out to be a crucial step.
Author contributions
Andrés Mormeneo-Segarra: investigation, validation, and writing – original draft. Sergio Ferrer-Nicomedes: investigation, validation, and writing – original draft. Nuria Vicente-Agut: supervision and writing – review & editing. Antonio Barba-Juan: supervision, and writing – review & editing.Data availability
The data supporting the results of this study are currently available from the corresponding author, N. V.-A., upon reasonable request.Conflicts of interest
There are no conflicts to declare.Acknowledgements
This work has received funding from Generalitat Valenciana under Pla Complementari “Programa de Materials Avançats”, 2022 (grant number MFA/2022/030). A. B.-J. acknowledges the financial support from Ministerio de Ciencia e Innovación (Spain) grant number. MCIN/AEI/10.13039/501100011033. N. V.-A. acknowledges the support for the research from Universitat Jaume I under the project number UJI/2023/016. A. M.-S. and S. F.-N. thank Generalitat Valenciana for the FPI Fellowship Program (grant numbers ACIF/2021/294 and ACIF/2021/050).References
- T. Wang, W. Luo and Y. Huang, Acc. Chem. Res., 2023, 56, 667–676 CrossRef CAS PubMed.
- W. Zhang, V. Koverga, S. Liu, J. Zhou, J. Wang, P. Bai, S. Tan, N. K. Dandu, Z. Wang, F. Chen, J. Xia, H. Wan, X. Zhang, H. Yang, B. L. Lucht, A.-M. Li, X.-Q. Yang, E. Hu, S. R. Raghavan, A. T. Ngo and C. Wang, Nat. Energy, 2024, 9, 386–400 CrossRef CAS.
- T. Wang, J. Duan, B. Zhang, W. Luo, X. Ji, H. Xu, Y. Huang, L. Huang, Z. Song, J. Wen, C. Wang, Y. Huang and J. B. Goodenough, Energy Environ. Sci., 2022, 15, 1325–1333 RSC.
- J. Janek and W. G. Zeier, Nat. Energy, 2023, 8, 230–240 CrossRef.
- Q. Zhao, S. Stalin, C.-Z. Zhao and L. A. Archer, Nat. Rev. Mater., 2020, 5, 229–252 CrossRef CAS.
- W. Xiao, J. Wang, L. Fan, J. Zhang and X. Li, Energy Storage Mater., 2019, 19, 379–400 CrossRef.
- J. G. Guo Hanzheng, A. Baker, M. T. Lanagan, E. R. Kupp, G. L. Messing and C. A. Randall, Angew. Chem., Int. Ed., 2016, 55, 11457–11461 CrossRef.
- H. Guo, A. Baker, J. Guo and C. A. Randall, ACS Nano., 2016, 10, 10606–10614 CrossRef CAS PubMed.
- A. Galotta and V. M. Sglavo, J. Eur. Ceram. Soc., 2021, 41, 1–17 CrossRef CAS.
- K. Takashima, Y. Iwazaki and C. A. Randall, Jpn J. Appl. Phys., 2021, 60, 126505 CrossRef CAS.
- R. D. Floyd, S. Lowum and J. P. Maria, J. Mater. Sci., 2020, 55, 15117–15129 CrossRef CAS.
- S. Lowum, R. Floyd and J.-P. Maria, J. Mater. Sci., 2020, 55, 12747–12760 CrossRef CAS.
- K. Tsuji, A. Ndayishimiye, S. Lowum, R. Floyd, K. Wang, M. Wetherington, J. P. Maria and C. A. Randall, J. Eur. Ceram. Soc., 2020, 40, 1280–1284 CrossRef CAS.
- K. Tsuji, Z. Fan, S. H. Bang, S. Dursun, S. Trolier-Mckinstry and C. A. Randall, J. Eur. Ceram. Soc., 2022, 42, 105–111 CrossRef CAS.
- K. Nakagawa, M. Iwasaki, Z. Fan, J. I. Roscow and C. A. Randall, J. Eur. Ceram. Soc., 2023, 43, 4015–4020 CrossRef CAS.
- A. Mormeneo-Segarra, S. Ferrer-Nicomedes, N. Vicente-Agut and A. Barba-Juan, Ceram. Int., 2023, 49, 36497–36506 CrossRef CAS.
- Collection of Phase Diagrams, https://www.crct.polymtl.ca/fact/phase_diagram.php? file = LiNO3-LiOH.jpg&dir = FTsalt, (accessed 22 January 2024).
- A. Mormeneo-Segarra, S. Ferrer-Nicomedes, S. Simon, N. Vicente-Agut, J. C. Jarque-Fonfría and A. Barba-Juan, Solid State Ion, 2024, 406, 116482 CrossRef CAS.
- A. Mormeneo-Segarra, S. Ferrer-Nicomedes, N. Vicente-Agut and A. Barba-Juan, J. Eur. Ceram. Soc., 2024, 44, 5105–5114 CrossRef CAS.
- S. Ferrer-Nicomedes, A. Mormeneo-Segarra, N. Vicente-Agut and A. Barba-Juan, J. Power Sources, 2023, 581, 233494 CrossRef CAS.
Footnote |
| † Electronic supplementary information (ESI) available. See DOI: https://doi.org/10.1039/d4ma00582a |
| This journal is © The Royal Society of Chemistry 2024 |

