 Open Access Article
A multiplexed tension sensor reveals the distinct levels of integrin-mediated forces in adherent cells†
Xiaojun
Liu
ad,
Jiangtao
Li
a,
Xiaoyun
Wang
b,
Feng
Shao
 b,
Xingyou
Hu
c,
Juan
Li
e,
Lei
Yu
e,
Jicheng
Zang
*f,
Guixue
Wang
 *gh and
Yongliang
Wang
 *ai
*ai
aSchool of Health and Life Sciences, University of Health and Rehabilitation Sciences, Qingdao, 266113, China
bKey Laboratory of Marine Chemistry Theory and Technology, Ministry of Education, College of Chemistry and Chemical Engineering, Ocean University of China, Qingdao, China
cCollege of Textiles and Clothing, Qingdao University, Qingdao, 266071, China
dQingdao Central Hospital, University of Health and Rehabilitation Sciences, Qingdao, 266044, China
eDepartment of Quality Management, Qingdao Special Servicemen Recuperation Center of PLA NAVY, Qingdao, China
fSurgery of Department, Maternal and Child Care Hospital of Pingdu City, China. E-mail: 343347056@qq.com
gKey Laboratory for Biorheological Science and Technology of Ministry of Education, State and Local Joint Engineering Laboratory for Vascular Implants, Bioengineering College of Chongqing University, Chongqing, 400030, China. E-mail: yongliang.wang@uor.edu.cn
hJinfeng Laboratory, Chongqing, 401329, China. E-mail: wanggx@cqu.edu.cn
iQingdao Municipal Hospital, University of Health and Rehabilitation Sciences, Qingdao, 266011, China
First published on 19th September 2024
Abstract
Integrins are crucial for cell adhesion, spreading, and cell–cell interactions, contributing significantly to cellular functions. Various tension sensors have been developed to measure integrin tensions across different cell types and conditions. However, there is a lack of tools to accurately calibrate the high-level force range of integrins required for cell adhesion. In this study, we engineered a multiplexed tension sensor (TS) by combining a yellow fluorescence protein tension sensor (YFP TS) with a DNA integrative tension sensor (ITS) previously used. This innovative approach enabled us to detect integrin-mediated forces in adherent cells. Our findings revealed that high-motile fish keratocytes exhibited integrin-mediated forces ranging from 44 to 100 pN, whereas low-motile 3T3L1 and NRK cells generated integrin-mediated forces exceeding 100 pN. This difference may be attributed to the shorter dwelling time or interaction time between an integrin and a RGD ligand in keratocytes, suggesting a need to examine the loading rate information for the integrin and the ligand in focal adhesions.
Introduction
Integrins are transmembrane glycoproteins responsible for mediating cell adhesion, spreading, and cell–cell interactions. They form heterodimers composed of α and β subunits, facilitating the transmission of forces between the cell cytoskeleton and the extracellular matrix in adhesive cells.1 In T and B cells, integrins also contribute to the activation of the T cell receptor and B cell receptor, playing a crucial role in immune responses.2,3 Integrins can exist in an active, extended conformation or an inactive, bent conformation.4 Upon cell adhesion, integrin monomers aggregate and bind their ligands on the substrate, leading to sustained clustering through the ligand–integrin–adaptor proteins within the cell. Talin, vinculin, and integrins act as mechanosensors, detecting the local microenvironment and regulating cell proliferation, differentiation, and migration as needed.5–7 Biomechanical signals involving integrins have been extensively studied, including their impact on signaling pathways like FAK, ERK, Ca2+, Wnt, and AMPK.8–11 Researchers have explored integrins not only in terms of their expression and mutations linked to certain diseases but also in understanding force transmission characteristics. Despite progress in demonstrating the heterogeneity of force distribution in focal adhesions12 and variations in force levels and directions across different cells,13 further investigations are needed to delve into integrin tensions in various cellular contexts and their nuanced regulatory roles in cell migration.Cell migration varies depending on the components and lifespans of adhesive structures. Some adhesive structures exhibit high dynamics, with a relatively small number of clustered integrins. In contrast, structures like focal adhesions are larger in size, spanning micrometers and persisting for tens of minutes or even hours.14 Dynamic structures such as invadopodia and podosomes tend to adhere to smaller surface areas.15 High-motility cells such as neutrophils and fish keratocytes exhibit rapid migration. In contrast, 3T3L1 cells migrate infrequently, while NRK cells show slower migration on fibronectin-coated surfaces compared to fish keratocytes. Despite all three cells migrating in a mesenchymal mode, it remains uncertain whether integrin-mediated forces significantly differ among cells with varying levels of motility.
Various tools have been utilized to study cell mechanics, including atomic force microscopes, magnetic tweezers, optical tweezers, biomembrane tension probes, traction force microscopes, and single-molecule tension probes.16,17 These cutting-edge methods offer advantages such as high-frequency sampling and the ability to investigate single receptor–ligand interactions in vitro or ex vivo. A robotic fluidic force microscope (fluidFM BOT) has been designed to improve throughput while simultaneously detecting force dynamics.18,19 However, it measures the force at the level of the whole cell. To obtain detailed force distribution information for specific cell membrane receptors, single-molecule tension sensors (SMTS) have emerged as powerful tools for calibrating integrin tensions and understanding force distribution. SMTS have been used to map platelet integrin-mediated forces at submicron resolution and to study mechano-dependent activation in T cells and platelets.20,21 Recent studies have also analyzed adhesive structures in terms of integrin tensions at invadopodia and podosomes.22 Despite their capabilities in studying these interactions, it remains unclear whether integrin-mediated forces exhibit distinct properties in adherent cells.
Furthermore, integrin tension was previously calibrated using tension sensors. It has been demonstrated that many cells spreading on a PEGylated glass surface require an integrin tension greater than 40 pN, with tensions below 40 pN considered low.23 Platelets have shown two levels of integrin tension during adhesion and spreading.20 Previous studies calibrated the unfolding force of YFP at a pulling speed of 400 nm s−1, which was found to be 100 pN24 and 44 pN for shear-structured 20 bp dsDNA,25 respectively. The dissociation between biotin and avidin requires even higher force, >160 pN.26 We assumed that the integrin pulling speed remains unchanged at the single-molecule level, such as 400 nm s−1. Subsequently, we designed and combined YFP and ITS as probes to verify integrin pulling forces in three adherent cells. Interestingly, we observed different pulling strengths for RGD binding integrins between keratocytes, 3T3L1 cells and NRK cells, which may be caused by the interaction time between the integrin and the ligand is different. In the future, quantifying the loading rate of integrins in different cell types appears to be essential for a comprehensive understanding of cell mechanics.
Materials and methods
Biotin-YFP-RGD tension sensor preparation
The biotin-YFP-RGD construct was inserted into a pQE80 vector and expressed in BL21(DE3) cells. An avi-tag and a 6× His-tag were engineered at the N-terminal of YFP-RGD. Subsequently, the protein was purified using affinity chromatography due to the presence of the His-tag. Biotin conjugation was performed using the BirA enzyme, which was co-expressed in E. coli via the plasmid pET28a. The amino acid sequence for biotin-YFP-RGD is provided below:MRGSHHHHHHGSYFEAQKIEWHERSSAEELFTGVVPILVELDGDVNGHKFSVSGEGEGDATYGKLTLKFICTTGKLPVPWPTLVTTFGYGLMCFARYPDHMKQHDFFKSAMPEGYVQERTIFFKDDGNYKTRAEVKFEGDTLVNRIELKGIDFKEDGNILGHKLEYNYNSHNVYIMADKQKNGIKVNFKIRHNIEDGSVQLADHYQQNTPIGDGPVLLPDNHYLSYQSKLSKDPNEKRDHMVLLEFVTATGITLGMDELYKRSTVYAVTGRGDSPASSRSGGTK.
44 pN ITS preparation
The short single-stranded DNA fragment was synthesized by GenScript (Nanjing, China). One strand was modified with an SH group and a BHQ2 quencher group, while the other was linked with biotin and the Cy3 fluorophore. The cyclic RGDfK peptide was obtained from allpeptide® (Cat. No. 144182, Hangzhou, China). The conjugation process was facilitated using a linker sulfo-SMCC (Cat. No. 22322, Thermo Fisher, USA), with one end reacting with the SH group and the other end with the NH2 group in cRGDfK. The sequences of the ssDNA used are provided below.Upper strand: 5′-/BiosG//iCy3/ATG CTG AGG TCG CCG CCC/-3′
Down strand: 5′-/TiolMC3-dG/GGG CGG CGA CCT CAG CAT/dT-BHQ2/-3′
Tension sensor immobilization
The tension sensor was immobilized on a confocal Petri dish by first coating it with 200 μg mL−1 BSA-biotin (bovine serum albumin, A8549, Sigma-Aldrich) for 30 minutes, followed by Neutravidin (200 μg mL−1, Cat. No. 31000, Thermo Fisher Scientific) for another 30 minutes. The third coating involved applying 0.2 μM ITS and/or 1 mg mL−1 YFP TS for 30 minutes. Each coating step was followed by washing with PBS three times. After completing these steps, the Petri dish was ready for use.Fish keratocyte isolation
All animal experiments comply with the ARRIVE guidelines and were carried out in accordance with the U.K. Animals (Scientific Procedures) Act, 1986 and associated guidelines, EU Directive 2010/63/EU for animal experiments, or the National Institutes of Health guide for the care and use of Laboratory animals (NIH Publications No. 8023, revised 1978). In brief, the scales of a male goldfish were removed using clean tweezers and placed in a 35 mm Petri dish for 1 minute. Subsequently, 2 mL of the DMEM with 10% FBS and 1% P/S was added for overnight culture at room temperature. The keratocytes migrated out and were detached using EDTA solution [100 mL of 10 × HBSS + 10 mL of 1 M HEPES (PH7.6) + 10 mL of 7.5% sodium bicarbonate + 2.4 mL of 500 mM EDTA +1 L of H2O] and then re-seeded onto the tension sensor surface on confocal dishes for a specified period. Imaging was performed using a Nikon Ti2E microscope.Cell culture
3T3L1 cells were procured from Procell (Wuhan, China) and cultured in the DMEM supplemented with 10% FCS and 1% P/S in a standard mammalian cell culture incubator. Cells reaching 70% confluence were chosen for the cell force measurement. Sub-culturing was carried out every 2 to 3 days with an appropriate dilution. NRK cells were cultured in the DMEM with 10% FBS and 1% P/S, and the passage procedure was performed every 2–3 days.Myosin inhibition
After detaching the cells with an EDTA solution and resuspending them in the culture medium, the diluted cells were replated onto Petri dishes containing different concentrations of blebbistatin (2.5, 3.75, and 5 μM). The cells were incubated in a standard cell culture incubator for a specified time before imaging.Integrin inhibition
The detached cells were replated onto Petri dishes with either the 1 μM peptide GACRRETAWA (Genscript) or the 10 μg mL−1 12G10 monoclonal antibody (Thermo Fisher). The cells were then cultured for 2 hours before imaging.Mn2+ treatment
The detached cells were replated onto Petri dishes containing 0.5 mM MnCl2 and incubated in a cell culture incubator for a specified time. The cells were cultured for 2 hours before imaging.Imaging and data analysis
After allowing the cells to settle for a specific duration (30 minutes for fish keratocytes and 2 hours for 3T3L1/NRK cells), the Petri dishes were positioned on the imaging stage of a Nikon Ti2E fluorescence microscope. Images were captured using consistent exposure times for each dye. A time-lapse recording of keratocytes was conducted with 10-second intervals. All images were subsequently analyzed using MATLAB software, and the associated codes are accessible upon request. The key equation is listed below:| The rupture (%) = (IITS in FA − Ibackground)/Ibackground × 100%, |
Results and discussion
Integrin tension ranges from 44 pN to 100 pN in fish keratocytes
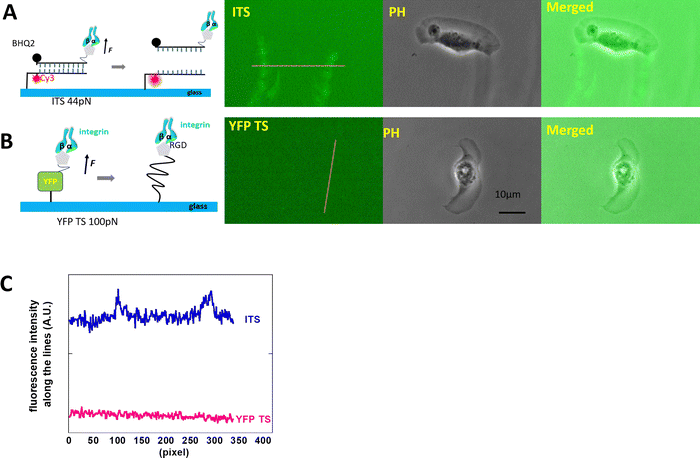
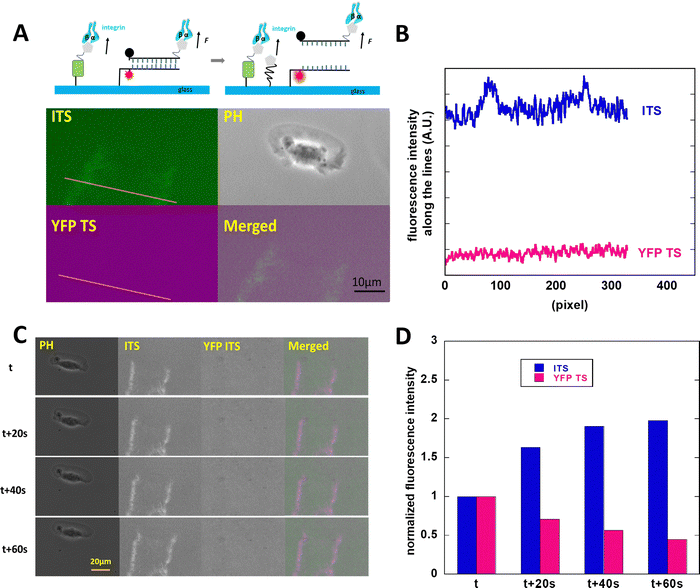
The high-motile keratocytes were cultured on surfaces coated with either YFP TS or ITS or a combination of both (multiplexed surface), allowing us to observe the ruptured tension sensor signals through changes in fluorescence intensity. In Fig. 1, both probes were tested on separate glass surfaces, and only the 44 pN ITS showed an increase in fluorescence, as seen in the two distinct tracks depicted in Fig. 1A. This pattern closely resembled Xuefeng Wang's findings.27 To further validate the integrin tension of keratocytes, we immobilized multiplexed YFP TS and 44 pN ITS on a glass surface, enabling simultaneous monitoring of integrin-mediated forces within the same cell. Fig. 2 illustrates the integrin tension recorded on the multiplexed probes surface, where only the 44 pN ITS exhibited a change in rupture signal. The discrepancy between YFP TS and 44 pN ITS signals was clearly evident, with a detailed representation provided in Movie S1 (ESI†). Fig. 2C displays typical images from Movie S1 (ESI†), showcasing the accumulation of integrin tension signals. The decrease in the YFP TS signal was likely due to photobleaching of YFP, a consideration for future real-time recording using YFP TS. Keratocytes migrate rapidly at approximately 10 μm per minute, adopting a fan-like spreading pattern with focal adhesions concentrated at the trailing edges. These fast-moving cells are invaluable for studying cell migration modes and force distributions. Studies by Barnhart et al.28 demonstrated that keratocytes initiate migration and spontaneously break symmetry, a behavior distinct from human epithelial cells, which cannot migrate as swiftly. Neutrophils, on the other hand, exhibit relatively high-speed translocation towards chemoattractants, warranting further comparative analysis.3T3L1 cells generate the integrin tension in the range of >100 pN
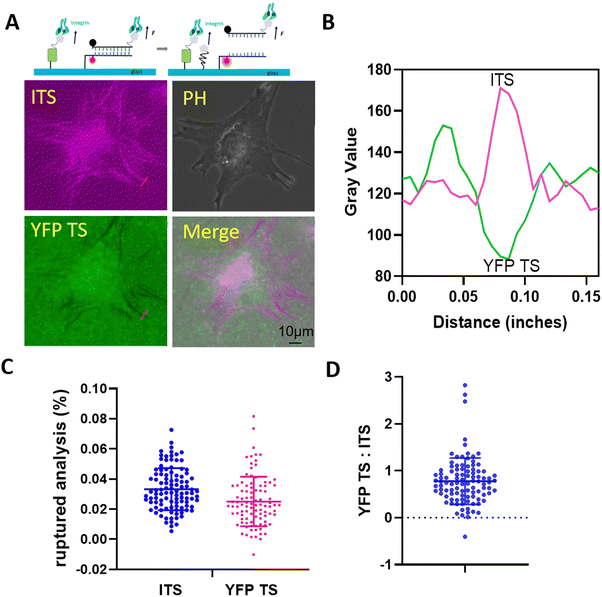
After examining high-motile keratocytes, we found that the range of integrin tension in low-motile cells may vary and warrants further investigation. We selected 3T3L1 cells and plated them on the multiplexed sensor surface, assessing the integrin-mediated force signals after a 2-hour incubation period. As depicted in Fig. 3, we imaged both the fluorescing of 44 pN ITS and the darkening of YFP TS, comparing the colocalization of forces in focal adhesions (FAs) in both channels (Fig. 3B). Clearly, low-motile 3T3L1 cells exhibited a higher force (>100 pN) compared to high-motile keratocytes. This measurement aligns well with findings by Salaita, where low-motile cells were capable of rupturing bonds between avidin and biotin, exceeding 160 pN in HCC 1143 cells.29 We then compared the rupture signals in FAs between ITS and YFP TS, revealing values of 0.025 in YFP TS versus 0.033 in ITS. The ratio of YFP TS to ITS was calculated to be 0.78 ± 0.49, indicating that integrins dissociated more ITS in FAs. Additionally, the high-level force distribution in FAs was calibrated, and the analysis of 103 FAs suggested variable forces in FAs, depicted as scattered dots in Fig. 3D.NRK cells generate the integrin retraction forces over 100 pN, but different from 3T3L1
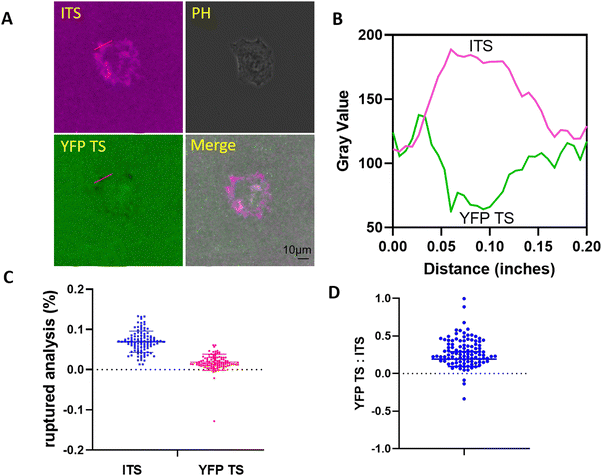
After testing fibroblasts, we plated kidney epithelial cells on the multiplexed probe surface. Fig. 4A clearly showed the fluorescence change in both channels. To visualize the fluorescence merge information, we displayed the YFP TS signal in the opposite color. In Fig. 4B, the ITS exhibited a longer focal adhesion pattern, ranging from 15 to 64 pixels. The colocalization between YFP TS and ITS was typically observed at the distal end of FAs, depicted as a whiter area indicating increased colocalization. Fig. 4C and D monitor integrin tensions in 104 FAs, confirming that the ITS could be ruptured more by integrins. However, the ratio between YFP TS and ITS was much lower in NRK cells compared to 3T3L1 cells, with values of 0.28 ± 0.19 for NRK versus 0.78 ± 0.49 for 3T3L1. Notably, NRK cells exhibited migration on fibronectin-coated glass surfaces in our system,30 with many cells achieving a migration speed of > 0.3 μm min−1 (not presented). In contrast, 3T3L1 cells did not migrate at a 2-h period, with a speed considered to be zero. We speculate that the difference in integrin-mediated forces may be attributed to the interaction time or the dwelling time between the integrin and the RGD motif. These results suggest that the calibration of integrin tensions with various tension sensors may align with each other, as the tension sensor calibration was performed either at a constant pulling speed mode31 or at a constant force mode,32 depending on the parameter settings. In other words, faster pulling speeds require a higher force to rupture the given probe. As a result, when in a hypothetical state, the speed of cell migration will impact the duration of interaction between the integrin and the ligand, potentially necessitating a greater force to unfold YFP in highly mobile fish keratocytes compared to NRK and 3T3L1 cells.High concentrations of blebbistatin block distinct integrin tensions
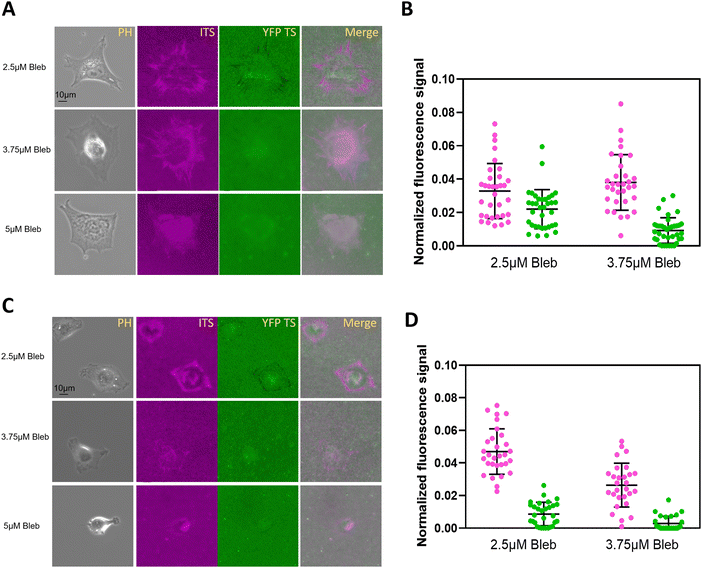
Cells transmit forces through the actomyosin system to integrins.33 We aimed to determine if myosin inhibition could selectively eliminate the 100 pN integrin tension without affecting the 44 pN tension. Different concentrations of blebbistatin (2.5, 3.75, and 5 μM) were added to the culture medium during replating. 3T3L1 and NRK cells were plated on sensor-coated glass surfaces for 2 hours before imaging. The force signals in both channels clearly declined due to the treatment (Fig. 5). At 3.75 μM, NRK cells could not rupture the YFP TS but still showed some force signals on ITS TS. In contrast, 3T3L1 cells were less sensitive to blebbistatin as the 3.75 μM concentration did not dampen the integrin signal of YFP TS completely. Our results confirmed that high integrin tension relies on actomyosin contraction. Additionally, the 100 pN YFP TS distinguished the tiny differences between NRK and 3T3L1 cells, indicating greater sensitivity in NRK cells. This observation suggests a mechanistic role of myosin tension in influencing high integrin tension.Inhibition of integrin α5β1 does not eliminate 100 pN integrin tension
Different integrins contribute to specific aspects of integrin adhesion complex formation and mechanotransduction, and that their force-related dynamics vary.34–38 Integrin α5β1 is responsible for firm adhesion and is supposed to sense higher integrin tension. It was reported that integrin αvβ3 is responsible for mechanotransduction, and integrin α5β1 transmit stronger cell forces.34 These two subtypes both recognize the RGD peptide in an extracellular matrix. So, we tried to collect more information regarding the integrin αvβ3 mechanical force range by α5β1 inhibition. To inhibit integrin α5β1, we used a specific inhibition peptide at 1 μM or the integrin α5β1 monoclonal antibody 12G10 at 5 μg mL−1. After 2 hours of incubation with these inhibitors or antibodies, the 100 pN integrin tension was still detected in Fig. 6. This may be because integrin αvβ3 can generate integrin-mediated forces higher than 100 pN. It is important to note that the previous statement was based on the total force generated by a cell, whereas tension sensors report the force range. Longer pulling times significantly increase the probability of unfolding events of YFP TS.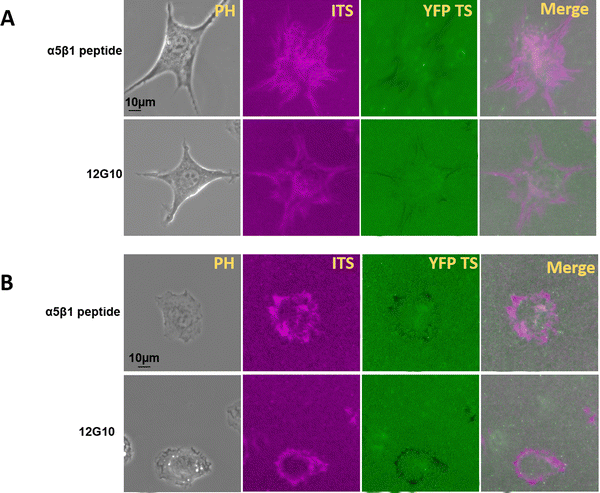 | ||
| Fig. 6 The inhibition of integrin α5 β1 did not inhibit high integrin tension. (A) The integrin-mediated force map for 3T3L1 cells. (B) The integrin tension map for NRK cells. | ||
Pre-activation of integrins did not change the integrin sensitivity
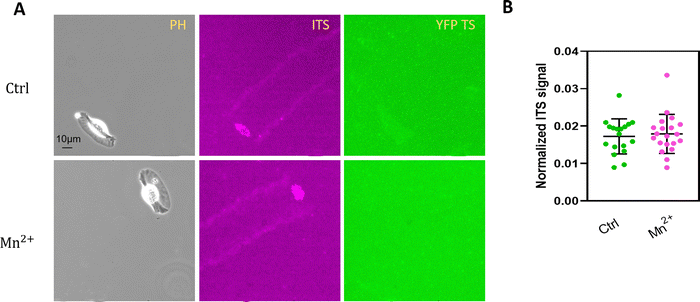
It has been reported that the availability of activated integrins by Mn2+ strongly influences force development in integrin-mediated cell adhesion.39 Mn2+ treatment is known to pre-activate integrins.40 Therefore, we aimed to determine whether cell integrin tension was affected by adding Mn2+. As low-motile cells rupture both integrin tension sensors, we concentrated on migrating fish keratocytes to test Mn2+ influence. In Fig. 7, the addition of Mn2+ (0.5 mM and 2 mM) did not affect the integrin pulling force for 100 pN TS, and the YFP TS still kept in a folded state. It is reasonable that Mn2+ primarily activates integrins to bind their ligands with high affinity.41 The integrin-mediated force level may be altered if the keratocytes was restricted for migration speed as macro-migration speed perhaps determines the integrin-ligand binding time.Keratocytes initiate the integrin tension properties differing from the later fan-shape
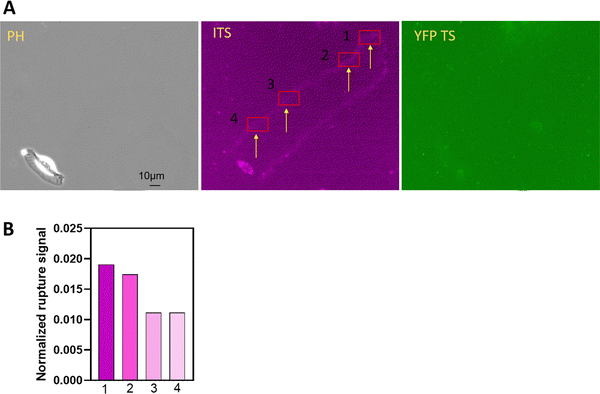
Replated keratocytes typically adhere to the glass surface, achieve shape polarization, and maintain a persistent migration pattern with the integrin-mediated force at the trailing edges. To gather information about polarization and persistent movement, we compared integrin tension at the onset of keratocyte adhesion and during the persistent stage. Interesting details emerged, as shown in Fig. 8. During the polarization stage, keratocytes attached to the surface with minimal movement, resulting in distinct integrin signals. Conversely, at a later stage, keratocytes migrated much faster, significantly reducing the number of ruptured ITS TS in the same selected region (indicated by the arrow in Fig. 8). Although early adhesion might be expected to generate low integrin tension due to the underdeveloped actomyosin network, our results suggest that the cell dwelling time has a more significant effect on integrin–ligand force levels. Another potential reason is that the integrin adhesion complexes might still be small and immature, and the single molecular clutches might therefore be exposed to higher forces deriving from the actomyosin contraction, because integrin clustering has not yet been concluded. Further research is needed to elucidate the relationship among focal adhesion maturation, integrin tension, and cell migration velocity.Monitoring integrin dynamics in cell–matrix interactions in real-time presents a significant challenge. Professor Müller's work demonstrated that integrins initiate cell adhesion in less than 1 second.42 Using a biomembrane force probe, Zhu detected three states of the integrin αIIbβ3: bent, extended closed, and extended open states.43 However, there is currently no method to monitor integrin dynamics in focal adhesions concerning pulling speed. Our method suggests that the dwelling time between the integrin and its ligand might vary if the integrin's power remains unchanged. However, we lack information about whether integrins operate at the same pulling speed in all three cell types. The comparison of integrin tension among these different cells limits our ability to conclusively demonstrate the duration and force required to rupture probes at the cellular level. Future investigations may benefit from using tools like atomic force microscopes, optical tweezers, and magnetic tweezers, which are more adept at studying single receptor–ligand interactions. If the dwelling time Td between the integrin and the ligand is calibrated in these three cells, the comparison among them will be more precise, eliminating the need to estimate the dwelling time based on the whole cell migration speed. Nonetheless, these methods also encounter challenges in accurately calibrating integrin tension within focal adhesions due to their systemic setups.
This method still has limitations in measuring the exact force for integrins, which is a common drawback of all types of tension sensors. For YFP TS, the unfolding force is in the range of 97 pN ± 27.1 pN at 400 nm s−1, with an error of 27.8%. To date, the loading rate was examined by T. Ha,44 Z. Liu,45 and K. Salaita,46 and their measurements were based on loading rate sensors, calibrated with optical tweezers or magnetic tweezers. Their quantification considered the unfolding force of DNA sensors at a fixed value and the Δt of fold-to-unfold of the sensor was detected. The loading rate was then derived by ΔF/Δt. These innovative designs have advanced our understanding of integrin mechanics.
Conclusions
This study primarily focused on monitoring the variation in integrin-mediated forces in adherent cells with differing motility, by combining two integrin tension sensors, YFP TS and ITS. It introduces a new approach to detect high-level integrin tensions exceeding 44 pN (equivalent to 54 pN as calibrated by Xuefeng Wang). Upon comparing three cell lines, we found that highly motile cells like fish keratocytes could not rupture 100 pN probes but could rupture 44 pN ones, whereas low-motility cells generated integrin tensions higher than 100 pN. This study suggests that cells with lower motility might rupture higher tension sensors potentially due to a longer pulling time.Pre-activating integrins with Mn2+ did not induce stronger integrin retraction, as reflected by the tension sensor signal. Inhibiting integrin α5β1 with an antibody and a specific peptide could not completely suppress 100 pN integrin tension, indicating that integrin αvβ3 is capable of rupturing 100 pN sensors. By selectively inhibiting myosin, we demonstrated that high integrin tension can be modulated pharmacologically, further proving the complexity of force transmission in cells and the varying efficiency of the actomyosin system.
Author contributions
Y. Wang conceived the project. X. Liu, J. Li, and X. Wang performed the experiments. X. Liu, J. Li, and Y. Wang analyzed the data. F. Shao, X. Hu, J. Li, L. Yu, J. Zang, G. Wang and Y. Wang discussed and supervised the project. Y. Wang and X. Liu wrote the manuscript.Data availability
The data that support the findings of this study are available upon reasonable request.Conflicts of interest
The authors have no conflicts of interest to disclose.Acknowledgements
This work is supported by the start-up fund from the University of Health and Rehabilitation Sciences to Yongliang Wang, the Visiting Scholar Foundation of the Key Laboratory of Biorheological Science and Technology (Chongqing University), the Ministry of Education (CQKLBST-2022-001) to Yongliang Wang, the Natural Science Foundation of Shandong Province to Xiaojun Liu (ZR2023QC286), and the National Natural Science Foundation of China (12032007 and 31971242) to Guixue Wang. We thank Prof. Li Yu (Tsinghua University) for the NRK cell lines.References
- L. R. Anderson, T. W. Owens and M. J. Naylor, Biophys. Rev., 2014, 6, 203–213 CrossRef CAS PubMed.
- Q. Zhang, S. Zhang, J. Chen and Z. Xie, Int. J. Mol. Sci., 2023, 24, 6170 CrossRef CAS PubMed.
- A. Bertoni, O. Alabiso, A. S. Galetto and G. Baldanzi, Int. J. Mol. Sci., 2018, 19, 485 CrossRef PubMed.
- R. Kolasangiani, T. C. Bidone and M. A. Schwartz, Cells, 2022, 11, 3584 CrossRef CAS PubMed.
- B. T. Goult, J. Yan and M. A. Schwartz, J. Cell Biol., 2018, 217, 3776–3784 CrossRef CAS PubMed.
- F. Franz, R. Tapia-Rojo, S. Winograd-Katz, R. Boujemaa-Paterski, W. Li, T. Unger, S. Albeck, C. Aponte-Santamaria, S. Garcia-Manyes, O. Medalia, B. Geiger and F. Gräter, Nat. Commun., 2023, 14, 4311 CrossRef CAS PubMed.
- T. P. Driscoll, T. C. Bidone, S. J. Ahn, A. Yu, A. Groisman, G. A. Voth and M. A. Schwartz, Biophys. J., 2021, 120, 4349–4359 CrossRef CAS PubMed.
- H. Hamidi and J. Ivaska, Nat. Rev. Cancer, 2018, 18, 533–548 CrossRef CAS PubMed.
- R. Ata and C. N. Antonescu, Int. J. Mol. Sci., 2017, 18, 189 CrossRef PubMed.
- C. Y. Lin, L. G. Hilgenberg, M. A. Smith, G. Lynch and C. M. Gall, Mol. Cell. Neurosci., 2008, 37, 770–780 CrossRef CAS PubMed.
- N. Tejeda-Muñoz, M. Morselli, Y. Moriyama, P. Sheladiya, M. Pellegrini and E. M. De Robertis, iScience, 2022, 25, 104123 CrossRef PubMed.
- J. Austin, Y. Tu, K. Pal and X. Wang, Biophys. J., 2023, 122, 156–167 CrossRef CAS PubMed.
- J. M. Brockman, A. T. Blanchard, V. M. Pui-Yan, W. D. Derricotte, Y. Zhang, M. E. Fay, W. A. Lam, F. A. Evangelista, A. L. Mattheyses and K. Salaita, Nat. Methods, 2018, 15, 115–118 CrossRef CAS PubMed.
- S. J. Stehbens and T. Wittmann, Methods Cell Biol., 2014, 123, 335–346 Search PubMed.
- V. V. Artym, K. Matsumoto, S. C. Mueller and K. M. Yamada, Eur. J. Cell Biol., 2011, 90, 172–180 CrossRef CAS PubMed.
- K. Haase, A. E. Pelling and J. R. Soc, Interface, 2015, 12, 20140970 Search PubMed.
- P. H. Wu, D. R. Aroush, A. Asnacios, W. C. Chen, M. E. Dokukin, B. L. Doss, P. Durand-Smet, A. Ekpenyong, J. Guck, N. V. Guz, P. A. Janmey, J. S. H. Lee, N. M. Moore, A. Ott, Y. C. Poh, R. Ros, M. Sander, I. Sokolov, J. R. Staunton, N. Wang, G. Whyte and D. Wirtz, Nat. Methods, 2018, 15, 491–498 CrossRef CAS PubMed.
- Á. G. Nagy, I. Székács, A. Bonyár and R. Horvath, Eur. J. Cell Biol., 2022, 101, 151273 CrossRef PubMed.
- M. Sztilkovics, T. Gerecsei, B. Peter, A. Saftics, S. Kurunczi, I. Szekacs, B. Szabo and R. Horvath, Sci. Rep., 2020, 10, 61 CrossRef CAS PubMed.
- Y. Wang, D. N. LeVine, M. Gannon, Y. Zhao, A. Sarkar, B. Hoch and X. Wang, Biosens. Bioelectron., 2018, 100, 192–200 CrossRef CAS PubMed.
- A. V. Kellner, R. Hunter, P. Do, J. Eggert, M. Jaffe, D. K. Geitgey, M. Lee, J. A. G. Hamilton, A. J. Ross, R. S. Ank, R. L. Bender, R. Ma, C. C. Porter, E. C. Dreaden, B. B. Au-Yeung, K. A. Haynes, C. J. Henry and K. Salaita, bioRxiv, 2024, preprint DOI:10.1101/2024.01.31.578101.
- K. Pal, Y. Tu and X. Wang, ACS Nano, 2022, 16, 2481–2493 CrossRef CAS PubMed.
- X. Wang and T. Ha, Science, 2013, 340, 991–994 CrossRef CAS PubMed.
- Y. Wang, H. Wang, M. V. Tran, W. R. Algar and H. Li, Chem. Commun., 2020, 56, 5556–5559 RSC.
- T. Strunz, K. Oroszlan, R. Schäfer and H. J. Güntherodt, Proc. Natl. Acad. Sci. U. S. A., 1999, 96, 11277–11282 CrossRef CAS PubMed.
- V. T. Moy, E. L. Florin and H. E. Gaub, Science, 1994, 266, 257–259 CrossRef CAS PubMed.
- Y. Zhao, Y. Wang, A. Sarkar and X. Wang, iScience, 2018, 9, 502–512 CrossRef CAS PubMed.
- E. Barnhart, K.-C. Lee, G. M. Allen, J. A. Theriot and A. Mogilner, Proc. Natl. Acad. Sci. U. S. A., 2015, 112, 5045–5050 CrossRef CAS PubMed.
- C. Jurchenko, Y. Chang, Y. Narui, Y. Zhang and K. S. Salaita, Biophys. J., 2014, 106, 1436–1446 CrossRef CAS PubMed.
- L. Ma, Y. Li, J. Peng, D. Wu, X. Zhao, Y. Cui, L. Chen, X. Yan, Y. Du and L. Yu, Cell Res., 2015, 25, 24–38 CrossRef CAS PubMed.
- P. Ringer, A. Weissl, A. L. Cost, A. Freikamp, B. Sabass, A. Mehlich, M. Tramier, M. Rief and C. Grashoff, Nat. Methods, 2017, 14, 1090–1096 CrossRef CAS PubMed.
- C. Grashoff, B. D. Hoffman, M. D. Brenner, R. Zhou, M. Parsons, M. T. Yang, M. A. McLean, S. G. Sligar, C. S. Chen, T. Ha and M. A. Schwartz, Nature, 2010, 466, 263–266 CrossRef CAS PubMed.
- M. Murrell, P. W. Oakes, M. Lenz and M. L. Gardel, Nat. Rev. Mol. Cell Biol., 2015, 16, 486–498 CrossRef CAS PubMed.
- P. Roca-Cusachs, N. C. Gauthier, A. del Rio and M. P. Sheetz, Proc. Natl. Acad. Sci. U. S. A., 2009, 106, 16245–16250 CrossRef CAS PubMed.
- H. B. Schiller, M. R. Hermann, J. Polleux, T. Vignaud, S. Zanivan, C. C. Friedel, Z. Sun, A. Raducanu, K. E. Gottschalk, M. Théry, M. Mann and R. Fässler, Nat. Cell Biol., 2013, 15, 625–636 CrossRef CAS PubMed.
- A. Elosegui-Artola, E. Bazellières, M. D. Allen, I. Andreu, R. Oria, R. Sunyer, J. J. Gomm, J. F. Marshall, J. L. Jones, X. Trepat and P. Roca-Cusachs, Nat. Mater., 2014, 13, 631–637 CrossRef CAS PubMed.
- H. E. Balcioglu, H. van Hoorn, D. M. Donato, T. Schmidt and E. H. Danen, J. Cell Sci., 2015, 128, 1316–1326 CrossRef CAS PubMed.
- O. Rossier, V. Octeau, J. B. Sibarita, C. Leduc, B. Tessier, D. Nair, V. Gatterdam, O. Destaing, C. Albigès-Rizo, R. Tampé, L. Cognet, D. Choquet, B. Lounis and G. Giannone, Nat. Cell Biol., 2012, 14, 1057–1067 CrossRef CAS PubMed.
- M. Chighizola, A. Previdi, T. Dini, C. Piazzoni, C. Lenardi, P. Milani, C. Schulte and A. Podestà, Nanoscale, 2020, 12, 14708–14723 RSC.
- R. Changede, X. Xu, F. Margadant and M. P. Sheetz, Dev. Cell, 2015, 35, 614–621 CrossRef CAS PubMed.
- F. Ye, J. Liu, H. Winkler and K. A. Taylor, J. Mol. Biol., 2008, 378, 976–986 CrossRef CAS PubMed.
- N. Strohmeyer, M. Bharadwaj, M. Costell, R. Fässler and D. J. Müller, Nat. Mater., 2017, 16, 1262–1270 CrossRef CAS PubMed.
- Y. Chen, L. A. Ju, F. Zhou, J. Liao, L. Xue, Q. P. Su, D. Jin, Y. Yuan, H. Lu, S. P. Jackson and C. Zhu, Nat. Mater., 2019, 18, 760–769 CrossRef CAS PubMed.
- M. H. Jo, P. Meneses, O. Yang, C. C. Carcamo, S. Pangeni and T. Ha, Science, 2024, 383, 1374–1379 CrossRef CAS PubMed.
- Y. Hu, H. Li, C. Zhang, J. Feng, W. Wang, W. Chen, M. Yu, X. Liu, X. Zhang and Z. Liu, Cell, 2024, 187, 3445–3459 CrossRef CAS PubMed.
- J. D. Combs, A. K. Foote, H. Ogasawara, A. Velusamy, S. A. Rashid, J. N. Mancuso and K. Salaita, bioRxiv, 2024, preprint DOI:10.1101/2024.03.15.585042.
Footnote |
| † Electronic supplementary information (ESI) available. See DOI: https://doi.org/10.1039/d4ma00600c |
| This journal is © The Royal Society of Chemistry 2024 |

