 Open Access Article
Creative Commons Attribution 3.0 Unported Licence
Amorphous Li2O–LiI–MoO3 solid electrolytes: mechanochemical synthesis and application to all-solid-state batteries
Yushi
Fujita
 a,
Tomoya
Otono
a,
Taichi
Asakura
a,
Tomoya
Otono
a,
Taichi
Asakura
 a,
Jiong
Ding
b,
Hirofumi
Tsukasaki
b,
Shigeo
Mori
b,
Kota
Motohashi
a,
Atsushi
Sakuda
a,
Jiong
Ding
b,
Hirofumi
Tsukasaki
b,
Shigeo
Mori
b,
Kota
Motohashi
a,
Atsushi
Sakuda
 *a and
Akitoshi
Hayashi
a
aDepartment of Applied Chemistry, Graduate School of Engineering, Osaka Metropolitan University, Sakai, Osaka 599-8531, Japan. E-mail: saku@omu.ac.jp
bDepartment of Materials Science, Graduate School of Engineering, Osaka Metropolitan University, Sakai, Osaka 599-8531, Japan
First published on 19th August 2024
Abstract
All-solid-state batteries are attractive because of their high safety and energy densities. The use of oxide solid electrolytes in all-solid-state batteries can enhance safety. Crystalline oxide solid electrolytes have attracted attention owing to their high ionic conductivity. However, they require high-temperature sintering for densification, which leads to unfavorable side reactions; hence, an oxide solid electrolyte with high ionic conductivity, ductility, and stability to Li metal prepared by low-temperature synthesis is required. In this study, amorphous-type Li2O–LiI–MoO3 solid electrolytes are prepared using a mechanochemical method. The materials are synthesized, characterized, and fabricated, and measurements were subsequently obtained under specific conditions of temperature and pressure. The Li2O–LiI–MoO3 solid electrolytes exhibit a high ionic conductivity of 10−5 S cm−1 at 25 °C, sufficient ductility to densify by pressing at room temperature, and stability to Li metals. In addition, full cells with Li2S and Si as active materials and the Li2O–LiI–MoO3 solid electrolytes work reversibly at 25 °C. This study demonstrates the potential of amorphous solid electrolytes to enhance the performance of all-solid-state batteries, thereby prompting further research and development of oxide-based solid electrolytes.
1. Introduction
All-solid-state lithium-ion batteries are promising alternatives to conventional liquid-type batteries owing to their high safety and energy densities. Oxide-based solid electrolytes are attractive for application in all-solid-state batteries owing to their chemical stability; moreover, they enable the construction of batteries that are safer than conventional batteries.1 To date, there have been many reports on crystalline oxide-based solid electrolytes such as garnet2 and NASICON-type3 solid electrolytes, which exhibit a high ionic conductivity of approximately 10−4–10−3 S cm−1 at room temperature. However, these crystal-type solid electrolytes usually need to be sintered at high temperatures (>800 °C) to densify and reduce grain boundaries, which causes unfavorable side reactions. Consequently, preparation methods at low temperatures have been studied extensively,4 including cold-sintering5,6 and sol–gel methods.7,8 For application in all-solid-state lithium-ion batteries, oxide solid electrolytes must be prepared at low temperatures; moreover, they should have high ionic conductivity and ductility and exhibit stability to Li metal.One way to achieve the desired oxide solid electrolytes is to use glass or amorphous oxide solid electrolytes with low melting points.9,10 These solid electrolytes are prepared by low-temperature sintering and mechanochemical methods and have relatively high ionic conductivities and mechanical properties.11–13 We have also investigated and reported glass and glass-ceramic oxide solid electrolytes.14–18 For example, 90Li3BO3·10Li2SO4 glass-ceramics have an ionic conductivity of 10−5 S cm−1, good formability and stability to Li metal, and have been applied to all-solid-state batteries.19–21
Recently, new types of Li2O–LiI amorphous materials have been developed as solid electrolytes superior to these glass-based oxide solid electrolytes in terms of their ionic conductivity, ductility, and stability to Li metal.22,23 The Li2O–LiI solid electrolytes were prepared simply by a mechanochemical process using lithium oxide and lithium iodide as starting materials and were largely composed of amorphous structures comprising Li+, O2−, and I− with high ionic conductive properties. All-solid-state batteries with Li2O–LiI solid electrolytes were also investigated and showed high capacity and stable cycling.24–27 Therefore, the Li2O–LiI solid electrolyte is a promising material for all-solid-state batteries, and it is necessary to explore new materials that are based on it. Two methods may be used to enhance the ionic conductivity of the Li2O–LiI solid electrolyte, namely (1) increasing the amorphous region in the Li2O–LiI solid electrolyte and (2) increasing the ionic conductivity of the amorphous component. The Li2O–LiI solid electrolyte is composed of 70–80% amorphous components and 20–30% unreacted Li2O and LiI crystals.23 Li2O crystals are known to form ionically conductive glasses with glass-forming oxides such as B2O3,28 SiO2,29 and P2O5.30 When forming lithium-ion conductive glasses, the addition of glass-forming oxides is expected to increase the amorphous region and ionic conductivity. However, the addition of an oxide that readily reacts with Li2O to form glass reduces the ratio of the amorphous structure with high ionic conductivity formed between Li2O and LiI; thus, the choice of oxide type is important. Zachariasen's law31 is widely recognized for its relevance to the ease of glass formation and the vitrification conditions for oxide glasses. In the context of solid electrolytes, such as the Li2O–LiI solid electrolyte, the addition of a small amount of oxides is considered one of the most effective methods for enhancing ionic conductivity.
In this study, Li2O–LiI–MoO3 solid electrolytes were investigated using MoO3, which is an intermediate oxide that has a favorable glass-forming ability to enhance the properties of Li2O–LiI, including its ionic conductivity. The Li2O–LiI–MoO3 solid electrolytes were prepared using a mechanochemical method. The structures of the obtained samples were analyzed using several techniques, and their ionic conductivities were measured. To investigate the stability of the Li metals, Li symmetric cells were assembled and charge–discharge tests were performed. Furthermore, for application to all-solid-state batteries, half cells and full cells were fabricated using Li2S and Si as active materials, and charge–discharge tests were conducted.
2. Experimental
2.1 Synthesis
A mechanochemical process was employed to prepare Li2O–LiI–MoO3 samples. The starting materials Li2O (99.9%, Furuuchi Chem.), LiI (99.999%, Sigma-Aldrich), and MoO3 (99%, FUJIFILM Wako Pure Chem. Co.) were weighed according to the following ratios: Li2O![[thin space (1/6-em)]](https://www.rsc.org/images/entities/char_2009.gif) :
:![[thin space (1/6-em)]](https://www.rsc.org/images/entities/char_2009.gif) LiI
LiI![[thin space (1/6-em)]](https://www.rsc.org/images/entities/char_2009.gif) :
:![[thin space (1/6-em)]](https://www.rsc.org/images/entities/char_2009.gif) MoO3 = 67
MoO3 = 67![[thin space (1/6-em)]](https://www.rsc.org/images/entities/char_2009.gif) :
:![[thin space (1/6-em)]](https://www.rsc.org/images/entities/char_2009.gif) 33
33![[thin space (1/6-em)]](https://www.rsc.org/images/entities/char_2009.gif) :
:![[thin space (1/6-em)]](https://www.rsc.org/images/entities/char_2009.gif) 0, 66
0, 66![[thin space (1/6-em)]](https://www.rsc.org/images/entities/char_2009.gif) :
:![[thin space (1/6-em)]](https://www.rsc.org/images/entities/char_2009.gif) 33
33![[thin space (1/6-em)]](https://www.rsc.org/images/entities/char_2009.gif) :
:![[thin space (1/6-em)]](https://www.rsc.org/images/entities/char_2009.gif) 1, 63
1, 63![[thin space (1/6-em)]](https://www.rsc.org/images/entities/char_2009.gif) :
:![[thin space (1/6-em)]](https://www.rsc.org/images/entities/char_2009.gif) 32
32![[thin space (1/6-em)]](https://www.rsc.org/images/entities/char_2009.gif) :
:![[thin space (1/6-em)]](https://www.rsc.org/images/entities/char_2009.gif) 5, and 60
5, and 60![[thin space (1/6-em)]](https://www.rsc.org/images/entities/char_2009.gif) :
:![[thin space (1/6-em)]](https://www.rsc.org/images/entities/char_2009.gif) 30
30![[thin space (1/6-em)]](https://www.rsc.org/images/entities/char_2009.gif) :
:![[thin space (1/6-em)]](https://www.rsc.org/images/entities/char_2009.gif) 10 (mol%). The weighed materials were placed in a ZrO2 pot (45 mL) containing 32.5 g of ZrO2 balls (diameter = 5 mm). Ball milling was conducted at 510 rpm for 70 h using a planetary ball-milling apparatus (PULVERISETTE 7; Fritsch). The Li3PS4 glass was synthesized using the mechanochemical process. The starting materials, Li2S (99.9%, Mitsuwa Chemicals Co., Ltd.) and P2S5 (99%, Sigma-Aldrich), were weighed at a molar ratio of 3
10 (mol%). The weighed materials were placed in a ZrO2 pot (45 mL) containing 32.5 g of ZrO2 balls (diameter = 5 mm). Ball milling was conducted at 510 rpm for 70 h using a planetary ball-milling apparatus (PULVERISETTE 7; Fritsch). The Li3PS4 glass was synthesized using the mechanochemical process. The starting materials, Li2S (99.9%, Mitsuwa Chemicals Co., Ltd.) and P2S5 (99%, Sigma-Aldrich), were weighed at a molar ratio of 3![[thin space (1/6-em)]](https://www.rsc.org/images/entities/char_2009.gif) :
:![[thin space (1/6-em)]](https://www.rsc.org/images/entities/char_2009.gif) 1 and placed in a ZrO2 pot (250 mL) with 450 g of ZrO2 balls (diameter = 4 mm). The mechanochemical technique was performed at 210 rpm for 70 h using a planetary ball-milling apparatus (PULVERISETTE 5; Fritsch). All the procedures were performed under a dry Ar atmosphere.
1 and placed in a ZrO2 pot (250 mL) with 450 g of ZrO2 balls (diameter = 4 mm). The mechanochemical technique was performed at 210 rpm for 70 h using a planetary ball-milling apparatus (PULVERISETTE 5; Fritsch). All the procedures were performed under a dry Ar atmosphere.
2.2 Material characterization
X-ray diffraction (XRD) measurements (CuKα) were conducted using a diffractometer (SmartLab; Rigaku Corp.). The diffraction data were collected in increments of 0.02° in the 2θ range of 10–80° at a scan rate of 10° min−1. XRD measurements were performed using the reference intensity ratio (RIR) technique to determine the proportion of amorphous components in the prepared samples. The prepared Li2O–LiI–MoO3 samples and Al2O3 powder (FUJIFILM Wako Pure Chem. Co.) were mixed at a weight ratio of 1![[thin space (1/6-em)]](https://www.rsc.org/images/entities/char_2009.gif) :
:![[thin space (1/6-em)]](https://www.rsc.org/images/entities/char_2009.gif) 2 using an agate mortar. The starting materials Li2O, LiI, and MoO3 powders were mixed with Al2O3 powders. XRD measurements were conducted for both mixtures, and the weight ratios of the crystalline and amorphous phases were calculated by comparing the peak intensities of both mixtures using the peaks derived from Al2O3 in the obtained XRD as a reference. Raman spectroscopy was performed using a Raman spectrophotometer (LabRAM HR-800, HORIBA) with a 325-nm He–Cd laser. X-ray photoelectron spectroscopy (XPS) was conducted using an apparatus (K-Alpha, Thermo Fisher Scientific) with a monochromatic Al Kα source (1486.6 eV). The obtained peaks were aligned to the peak of C 1s at 284.7 eV on the surface for calibration. The alignment was consistent with that of another one using the Au 4f peak at 84.0 eV. Ar+ etching was performed on some samples to remove surface impurities. Samples whose electronic states were changed by etching are not discussed with respect to the depth profiles. 7Li magic-angle spinning nuclear magnetic resonance (MAS-NMR) measurements were performed using an NMR spectrometer (JEOR JNM-ECX 400). The spectra were obtained using a single pulse width of 3.5 μs (equivalent to one-third of the 90° pulse width). Samples were placed in a cylindrical zirconia spinner and rotated at 12–15 kHz. LiCl (−1.19 ppm) was used as the standard material. The recycle delay was 5 s, and the accumulation count was 50. The morphologies of the prepared samples were observed by scanning electron microscopy (SEM, JSM-6610A; JEOL). Energy-dispersive X-ray (EDX) spectroscopy analysis was also performed. Transmission electron microscopy (TEM) observation was performed using a JEM-2100Plus microscope (JEOL Co., Ltd) at an accelerating voltage of 200 kV. A single-tilt vacuum-transfer TEM specimen holder (Mel-Build) was used to prevent exposure of the samples to air during the TEM experiments. A complementary metal–oxide–semiconductor (CMOS) camera (OneView, Gatan Inc.) was utilized, which can acquire 16-megapixel images and videos with high speed and high sensitivity. The microstructures were examined by obtaining electron diffraction (ED) patterns and hollow-cone dark-field (HCDF) images. All measurements were conducted under a dry Ar atmosphere. The relative densities were calculated by dividing the bulk density of the pellets pressed at 360 MPa by the apparent density of the powder. The bulk densities of the pellets were calculated from their weights and volumes. The apparent density was measured using a gas pycnometer (AccuPycII 1340, Shimadzu Corp.).
2 using an agate mortar. The starting materials Li2O, LiI, and MoO3 powders were mixed with Al2O3 powders. XRD measurements were conducted for both mixtures, and the weight ratios of the crystalline and amorphous phases were calculated by comparing the peak intensities of both mixtures using the peaks derived from Al2O3 in the obtained XRD as a reference. Raman spectroscopy was performed using a Raman spectrophotometer (LabRAM HR-800, HORIBA) with a 325-nm He–Cd laser. X-ray photoelectron spectroscopy (XPS) was conducted using an apparatus (K-Alpha, Thermo Fisher Scientific) with a monochromatic Al Kα source (1486.6 eV). The obtained peaks were aligned to the peak of C 1s at 284.7 eV on the surface for calibration. The alignment was consistent with that of another one using the Au 4f peak at 84.0 eV. Ar+ etching was performed on some samples to remove surface impurities. Samples whose electronic states were changed by etching are not discussed with respect to the depth profiles. 7Li magic-angle spinning nuclear magnetic resonance (MAS-NMR) measurements were performed using an NMR spectrometer (JEOR JNM-ECX 400). The spectra were obtained using a single pulse width of 3.5 μs (equivalent to one-third of the 90° pulse width). Samples were placed in a cylindrical zirconia spinner and rotated at 12–15 kHz. LiCl (−1.19 ppm) was used as the standard material. The recycle delay was 5 s, and the accumulation count was 50. The morphologies of the prepared samples were observed by scanning electron microscopy (SEM, JSM-6610A; JEOL). Energy-dispersive X-ray (EDX) spectroscopy analysis was also performed. Transmission electron microscopy (TEM) observation was performed using a JEM-2100Plus microscope (JEOL Co., Ltd) at an accelerating voltage of 200 kV. A single-tilt vacuum-transfer TEM specimen holder (Mel-Build) was used to prevent exposure of the samples to air during the TEM experiments. A complementary metal–oxide–semiconductor (CMOS) camera (OneView, Gatan Inc.) was utilized, which can acquire 16-megapixel images and videos with high speed and high sensitivity. The microstructures were examined by obtaining electron diffraction (ED) patterns and hollow-cone dark-field (HCDF) images. All measurements were conducted under a dry Ar atmosphere. The relative densities were calculated by dividing the bulk density of the pellets pressed at 360 MPa by the apparent density of the powder. The bulk densities of the pellets were calculated from their weights and volumes. The apparent density was measured using a gas pycnometer (AccuPycII 1340, Shimadzu Corp.).
2.3 Electrochemical characterization
The ionic conductivities of the samples were measured using the alternating current (AC) impedance method with an impedance/gain phase analyzer (SI-1260A; Solartron). Pellets (diameter: 10 mm) were formed using a uniaxial press at 360 MPa for 5 min. Gold electrodes were formed by sputtering both surfaces of the pellets as current collectors. The AC impedance was measured under a dry Ar atmosphere. Direct current (DC) measurements were performed to determine the electronic conductivity of the samples using ion-blocking cells (stainless steel (SS)/sample/SS). The electronic conductivity was calculated using the current density and potential after 300 s. The prepared cells were measured at 25 °C using a potentiostat/galvanostat (SI-1287; Solartron Analytical). To investigate the stability of the prepared samples to Li metals, Li symmetric cells (SS/Li/sample/Li/SS) were fabricated, and electrochemical measurements were performed at 100 °C using a charge–discharge measurement device (BTS-2005, Nagano Co. Ltd.).2.4 Fabrication of all-solid-state batteries
The composite positive and negative electrodes were fabricated using the ball-milling technique. The composite electrodes were composed of Li2S or small-sized silicon (<1 μm), vapor-grown carbon fiber (VGCF, Showa-Denko), and the Li2O–LiI–MoO3 samples in the weight ratio 30![[thin space (1/6-em)]](https://www.rsc.org/images/entities/char_2009.gif) :
:![[thin space (1/6-em)]](https://www.rsc.org/images/entities/char_2009.gif) 10
10![[thin space (1/6-em)]](https://www.rsc.org/images/entities/char_2009.gif) :
:![[thin space (1/6-em)]](https://www.rsc.org/images/entities/char_2009.gif) 60. The weighed materials were placed in a ZrO2 pot (45 mL) containing 40 g of ZrO2 balls (diameter = 5 mm). Ball-milling was conducted at 370 rpm for 8 h. The prepared composites were used as electrode layers and three types of cells were fabricated: Li2S-half cells (Li–In/Li3PS4 glass/Li2S-VGCF–Li2O–LiI–MoO3), Si-half cells (Li–In/Li3PS4 glass/Si–Li2O–LiI–MoO3-VGCF), and Si/Li2S full cells (Si–Li2O–LiI–MoO3-VGCF/Li2O–LiI–MoO3/Li2S-VGCF–Li2O–LiI–MoO3). Li3PS4 glass powders (80 mg) or Li2O–LiI–MoO3 samples (30 mg) used as separator layers were placed in a polycarbonate cylinder (diameter = 10 mm) and pressed for a few seconds at ∼100 MPa. To fabricate the half-cells, composite electrodes were placed on the surface of the separator, and the composites and separator were pressed together at 720 MPa for 5 min. Li–In alloys were prepared by touching lithium foils (99.9%, 250 μm, Furuuchi Chemical Corp.) and In foils (99.999%, 300 μm, Furuuchi Chem. Corp.). The Li–In alloy was placed on another surface of the separator and pressed together at 36 MPa for 2 min. For the Si/Li2S full cells, the Li2S composite electrode was placed on the surface of the separator and pressed at 180 MPa for 2 min. A Si-composite electrode was placed on the other side of the separator, and they were pressed together at 720 MPa for 5 min. Stainless steel stamps were used as current collectors. All the cells were tightly constrained (>100 MPa). Li2S- and Si-loadings were ca. 3.8 mg cm−2 and ca. 2 mg cm−2, respectively. Charge–discharge tests were performed at 25 °C at 0.1 mA using a charge–discharge measurement device (BTS-2004, Nagano Co. Ltd.).
60. The weighed materials were placed in a ZrO2 pot (45 mL) containing 40 g of ZrO2 balls (diameter = 5 mm). Ball-milling was conducted at 370 rpm for 8 h. The prepared composites were used as electrode layers and three types of cells were fabricated: Li2S-half cells (Li–In/Li3PS4 glass/Li2S-VGCF–Li2O–LiI–MoO3), Si-half cells (Li–In/Li3PS4 glass/Si–Li2O–LiI–MoO3-VGCF), and Si/Li2S full cells (Si–Li2O–LiI–MoO3-VGCF/Li2O–LiI–MoO3/Li2S-VGCF–Li2O–LiI–MoO3). Li3PS4 glass powders (80 mg) or Li2O–LiI–MoO3 samples (30 mg) used as separator layers were placed in a polycarbonate cylinder (diameter = 10 mm) and pressed for a few seconds at ∼100 MPa. To fabricate the half-cells, composite electrodes were placed on the surface of the separator, and the composites and separator were pressed together at 720 MPa for 5 min. Li–In alloys were prepared by touching lithium foils (99.9%, 250 μm, Furuuchi Chemical Corp.) and In foils (99.999%, 300 μm, Furuuchi Chem. Corp.). The Li–In alloy was placed on another surface of the separator and pressed together at 36 MPa for 2 min. For the Si/Li2S full cells, the Li2S composite electrode was placed on the surface of the separator and pressed at 180 MPa for 2 min. A Si-composite electrode was placed on the other side of the separator, and they were pressed together at 720 MPa for 5 min. Stainless steel stamps were used as current collectors. All the cells were tightly constrained (>100 MPa). Li2S- and Si-loadings were ca. 3.8 mg cm−2 and ca. 2 mg cm−2, respectively. Charge–discharge tests were performed at 25 °C at 0.1 mA using a charge–discharge measurement device (BTS-2004, Nagano Co. Ltd.).
3. Results and discussion
3.1 Material characteristics
The XRD patterns (Fig. 1) show peaks derived from Li2O and LiI, which are supposed to be non-reactive. The starting materials MoO3 and its related compounds, such as Li2MoO4 (ref. 32 and 33) and Li4MoO5 (ref. 34), were not observed in the XRD patterns. In addition, MoO3 is an intermediate oxide and this experiment demonstrated that MoO3 alone cannot achieve an amorphous phase by ball-milling. This indicates that MoO3 formed amorphous phases with Li2O and LiI. The prepared samples have mainly amorphous components such as Li2O–LiI solid electrolytes, which have large amounts of amorphous components, i.e., approximately 70 to 80%.23 As the amount of MoO3 increased, the peak intensity of LiI increased. This indicates that the formation of an amorphous structure between Li2O and MoO3 was more dominant than that between Li2O and LiI. Fig. 2(a) shows SEM-EDX images of the 63Li2O·32LiI·5MoO3 sample powders. No aggregation of the starting materials was observed at the micrometer scale. Fig. 2(b) shows the ED pattern and the HCDF image of the 63Li2O·32LiI·5MoO3 sample. The ED pattern exhibits the Debye–Scherrer rings of LiI, along with several discrete diffraction spots of Li2O, which is consistent with the XRD patterns. Nanocrystalline MoO3 and related compounds were not observed, confirming that MoO3 forms an amorphous structure with Li2O and LiI. The HCDF image was derived from the 022 diffraction ring of LiI, revealing the precipitation of LiI nanocrystals with sizes ranging from approximately 2 to 12 nm.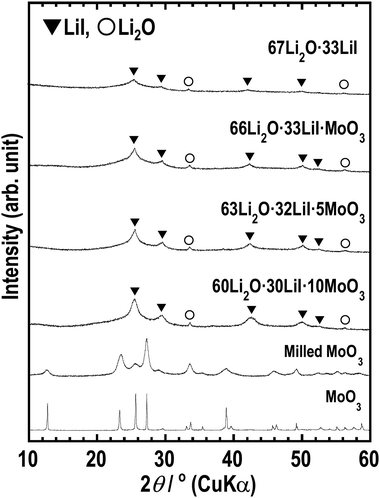 | ||
| Fig. 1 XRD patterns of 67Li2O·33LiI, 66Li2O·33LiI·MoO3, 63Li2O·32LiI·5MoO3, 60Li2O·30LiI·10MoO3, milled MoO3, and MoO3. | ||
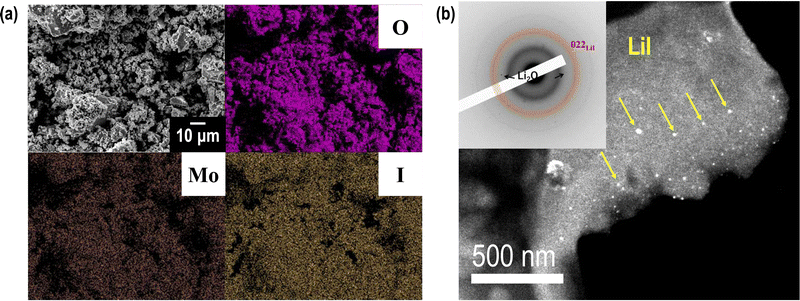 | ||
| Fig. 2 (a) SEM-EDS images and (b) HCDF image and ED pattern of 63Li2O·32LiI·5MoO3. In (b), bright-contrast regions indicated by arrows in yellow correspond to the LiI nanocrystals. | ||
Raman spectroscopy is an important method for investigating amorphous structures. Fig. 3 shows the Raman spectra of the samples. The samples with MoO3 showed peaks that were different from the peaks obtained for the 67Li2O·33LiI sample. The peak at approximately 900 cm−1 is attributed to MoO42−,33,35,36 indicating that MoO3 reacted with Li2O. The other peaks were not completely assigned to any other previously reported material; this may be because of the disordered amorphous-like structure prepared by ball milling. If these peaks are estimated, peaks at ca. 250, 350, 800, and 1000 cm−1 appear to be shifted MoO3 peaks, and peaks at around 500 cm−1 and 900 cm−1 are attributed to Li2MoO3 (ref. 37) and Li2MoO4,32,33 respectively.
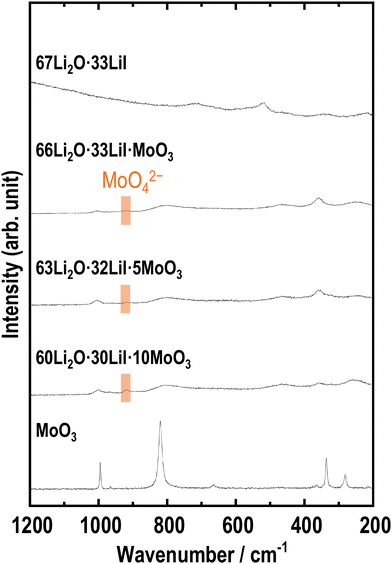 | ||
| Fig. 3 Raman spectra of 67Li2O·33LiI, 66Li2O·33LiI·MoO3, 63Li2O·32LiI·5MoO3, 60Li2O·30LiI·10MoO3, and MoO3. | ||
To examine the effects of incorporating MoO3 into the amorphous structure on the local mobility and environment around the Li ions, 7Li MAS-NMR measurements were conducted on the prepared samples. Fig. 4 shows the 7Li MAS NMR spectra of the prepared samples. We previously reported that the 67Li2O·33LiI sample showed three kinds of peaks of Li2O, LiI, and amorphous components.23 The samples containing MoO3 also exhibit three types of peaks, indicating the presence of amorphous components. In addition, the peak derived from the amorphous phase at approximately 0 ppm shifted to lower chemical shifts with increasing MoO3 content. 7Li MAS-NMR of Li2MoO4 has already been reported, and a sharp peak appears below 0 ppm.38 The peak shift may indicate a change in the environment of Li in amorphous components by forming MoO42−.
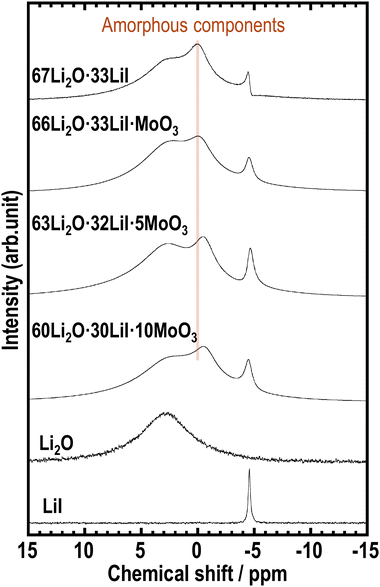 | ||
| Fig. 4 7Li MAS-NMR spectra of 67Li2O·33LiI, 66Li2O·33LiI·MoO3, 63Li2O·32LiI·5MoO3, 60Li2O·30LiI·10MoO3, Li2O, and LiI. | ||
XPS measurements were performed to investigate the electronic states of the prepared samples. If MoO3 was reduced and formed reduction products such as MoO32− by high energy ball-milling, the valence of Mo should be reduced from Mo6+ to Mo4+. Fig. 5 shows the (a) Mo 3d and (b) I 3d XPS spectra of all the samples and their starting materials. The Mo 3d and I 3d spectra were separated into 3d5/2 and 3d3/2 peaks, and only the binding energies of the 3d5/2 peaks were discussed. The Mo 3d spectra of the prepared samples exhibited binding energies that were comparable to those of the starting material MoO3, indicating that the electronic state of Mo is Mo6+. This indicates that Mo did not undergo reduction during the mechanochemical process. In addition, the I 3d spectra showed only one peak attributed to I− in all samples, indicating that I− is present in LiI or the amorphous components whose electronic states were almost the same.23 The XPS measurements show that the valence of Mo remained Mo6+, and MoO3 reacted with Li2O, leading to the formation of MoO42− amongst a group of compounds consisting of Li, O, and Mo elements.
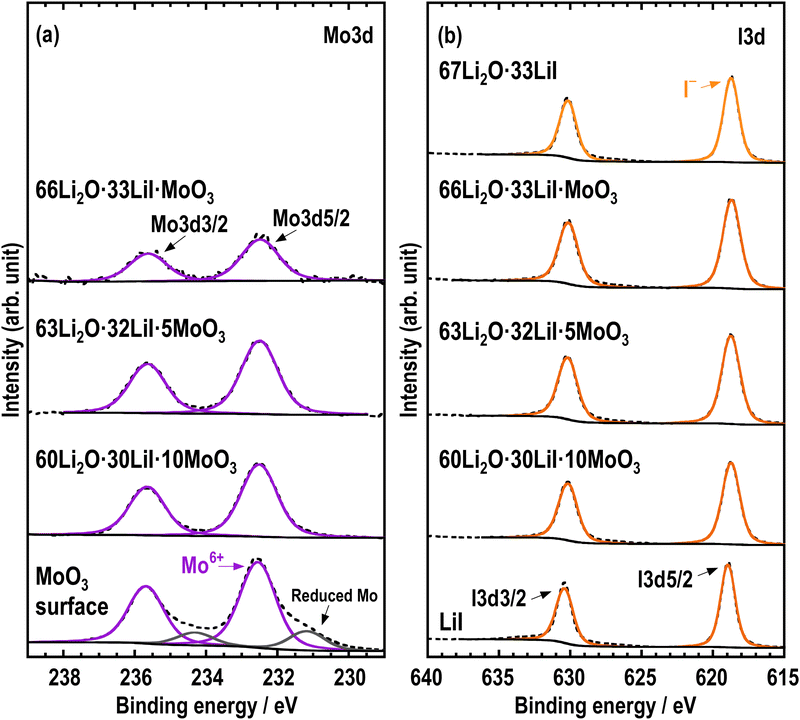 | ||
| Fig. 5 (a) Mo 3d and (b) I 3d XPS spectra of 67Li2O·33LiI, 66Li2O·33LiI·MoO3, 63Li2O·32LiI·5MoO3, 60Li2O·30LiI·10MoO3, MoO3, and LiI. | ||
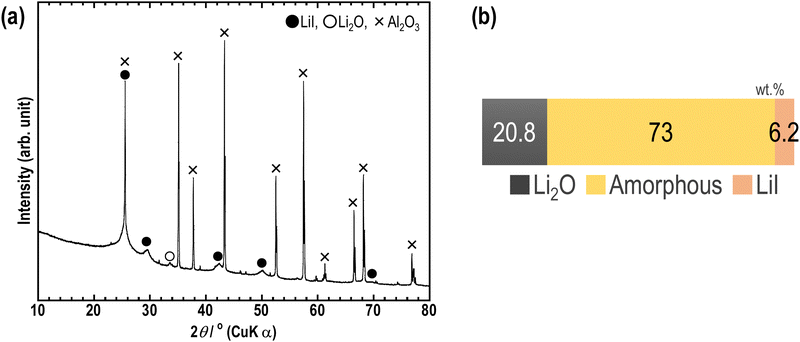
Furthermore, RIR measurements were conducted on the sample to investigate the ratio of amorphous components in the sample. Fig. 6(a) shows the XRD pattern of a mixture of 63Li2O·32LiI·5MoO3 and Al2O3; Fig. 6(b) shows the weight ratio of Li2O crystal, LiI crystal, and amorphous components. The peaks of MoO3 were not observed, and the ratio of the three components was therefore calculated. Based on the results obtained, the ratio was 20.8![[thin space (1/6-em)]](https://www.rsc.org/images/entities/char_2009.gif) :
:![[thin space (1/6-em)]](https://www.rsc.org/images/entities/char_2009.gif) 73
73![[thin space (1/6-em)]](https://www.rsc.org/images/entities/char_2009.gif) :
:![[thin space (1/6-em)]](https://www.rsc.org/images/entities/char_2009.gif) 6.2 among Li2O crystals, amorphous components, and LiI crystals. Previously, the same experiments were conducted on the Li2O–LiI samples, and the corresponding ratio was 20.3
6.2 among Li2O crystals, amorphous components, and LiI crystals. Previously, the same experiments were conducted on the Li2O–LiI samples, and the corresponding ratio was 20.3![[thin space (1/6-em)]](https://www.rsc.org/images/entities/char_2009.gif) :
:![[thin space (1/6-em)]](https://www.rsc.org/images/entities/char_2009.gif) 77.8
77.8![[thin space (1/6-em)]](https://www.rsc.org/images/entities/char_2009.gif) :
:![[thin space (1/6-em)]](https://www.rsc.org/images/entities/char_2009.gif) 1.8.23 To add MoO3 into the Li2O–LiI sample, the ratio of Li2O crystals was slightly increased whereas that of amorphous components was decreased and that of LiI crystals was increased. This result correlates well with the augmented intensity of the LiI peak in the XRD pattern shown in Fig. 1. It is speculated that the addition of MoO3 favors the reaction between Li2O and MoO3, inhibiting the formation of Li2O–LiI amorphous. The decrease in Li2O–LiI amorphous was larger than the increase in Li2O–MoO3 amorphous, and thus the amorphous region decreased. Although the amorphous region was not expanded in this study, the samples still consisted predominantly of amorphous components, which is expected to lead to high ionic conductivity.
1.8.23 To add MoO3 into the Li2O–LiI sample, the ratio of Li2O crystals was slightly increased whereas that of amorphous components was decreased and that of LiI crystals was increased. This result correlates well with the augmented intensity of the LiI peak in the XRD pattern shown in Fig. 1. It is speculated that the addition of MoO3 favors the reaction between Li2O and MoO3, inhibiting the formation of Li2O–LiI amorphous. The decrease in Li2O–LiI amorphous was larger than the increase in Li2O–MoO3 amorphous, and thus the amorphous region decreased. Although the amorphous region was not expanded in this study, the samples still consisted predominantly of amorphous components, which is expected to lead to high ionic conductivity.
In this study, the structural analyses performed so far have shown that the Li2O–LiI–MoO3 sample is an amorphous material with MoO3 incorporated into the original Li2O–LiI system, and MoO42− was partially formed although unreacted LiI was observed. There have been previous reports on Ag2O–AgI–MoO3 electrolytes, which are silver ionic conductors composed of elements similar to the elements treated in this study.39–47 However, most studies reported compositions rich in AgI or MoO3 and low in Ag2O, which are different from the compositions of samples prepared in this study, including a large molar ratio of Li2O. The amorphous structure would also differ from that of well-known Ag ionic conductors because the Raman spectroscopy results of the prepared samples in this study were not in perfect agreement with those of the reported Ag ionic conductors. Indeed, locally formed MoO42− itself showed lithium ionic conduction,48,49 and it may thus have a positive effect on ionic conductivity. More advanced and detailed analyses, such as pair distribution function analysis, are required to identify the amorphous structures.
3.2 Conductivity
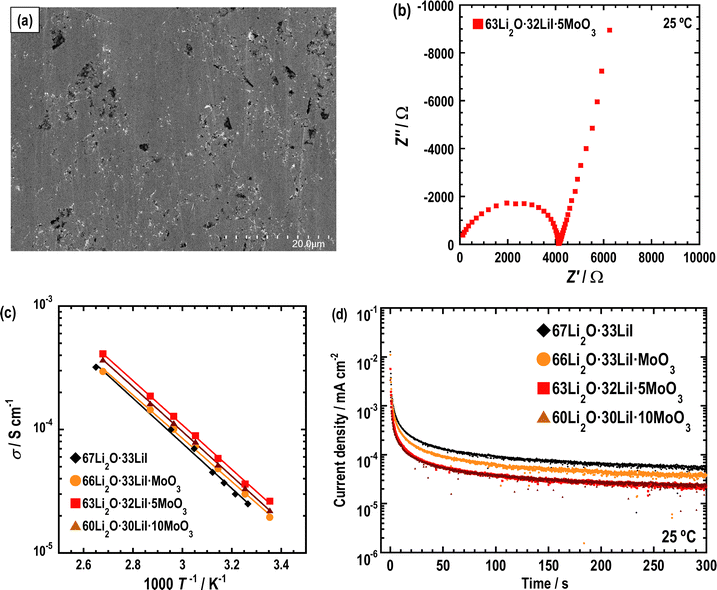
AC impedance measurements were conducted on the prepared samples. Fig. 7(a) displays a cross-sectional SEM image of a pellet of 63Li2O·32LiI·5MoO3 pressed at 360 MPa at ca. 25 °C. The sample was densified by pressing; the relative density was 84%. The relative densities of the other samples are listed in Table 1; they are observed to be almost the same. Fig. 7(b) shows Nyquist plots of the prepared sample at 25 °C. A semicircle and spike were observed. The semicircle is attributed to the contributions of the bulk and grain boundary resistances in the samples, which are not distinctly separated. The ionic conductivities were determined using the resistance at the cross-point of the semicircle and spike, as summarized in Table 1. Ionic conductivity increased with the addition of MoO3. In particular, the 63Li2O·32LiI·5MoO3 sample showed the highest conductivity at 25 °C. The ionic conductivity of Li2O–LiI–MoO3 solid electrolytes is higher than those of other amorphous oxide solid electrolytes.11,14,17,18Fig. 7(c) shows the temperature dependence of the ionic conductivity of each sample. The plots of all the samples followed Arrhenius’ law. The activation energy (Ea) was calculated from the temperature dependence and is listed in Table 1. Ea decreased slightly in the sample with MoO3. This enhancement in ionic conductivity and decrease in Ea may be due to the structural changes in the amorphous component. The electronic conductivities of the prepared samples were investigated using DC measurements. Fig. 7(d) shows the DC curve; the electronic conductivities are summarized in Table 1. Although the electronic conductivity was enhanced with an increase in the amount of MoO3, the electronic conductivity was considerably lower than the ionic conductivity, which explains why electronic conduction is negligible to ionic conduction. In addition, the relative densities were calculated for all samples and are also summarized in Table 1. The relative densities were not significantly changed by the addition of MoO3, indicating that the ductility of the samples was almost the same. Considering all the conductivity measurements, the ionic conductivity should be enhanced by adding MoO3 owing to the decreasing bulk resistance. To enhance the ionic conductivity of the Li2O–LiI solid electrolytes by adding MoO3, it is necessary to either increase the amorphous region or increase the conductivity of the amorphous components. The ionic conductivity should therefore be enhanced for the latter reason because the RIR measurement showed a decrease in the amorphous region. Typically, lithium ions are conducted through the large free volume in lithium-ion conductive glass solid electrolytes. Therefore, the free volume is considered to be partially expanded by adding MoO3 into Li2O–LiI. The increase in the ionic conductivity of the amorphous component is believed to be due to a structural change in the amorphous component, as shown in the previous structural analysis. A slight increase in the electronic conductivity may contribute to an increase in ionic conduction; however, the causal relationship and mechanism were not fully examined in this study.| Ionic conductivity (S cm−1) | E a (kJ mol−1) | Electronic conductivity (S cm−1) | Relative density (%) | |
|---|---|---|---|---|
| 67Li2O·33LiI | 1.7 × 10⁻⁵ | 35 | 3.9 × 10⁻¹¹ | 85 |
| 66Li2O·33LiI·MoO3 | 1.9 × 10⁻⁵ | 34 | 6.0 × 10⁻¹¹ | 84 |
| 63Li2O·32LiI·5MoO3 | 2.6 × 10⁻⁵ | 34 | 1.0 × 10⁻¹⁰ | 84 |
| 60Li2O·30LiI·10MoO3 | 2.2 × 10⁻⁵ | 35 | 1.2 × 10⁻¹⁰ | 83 |
3.3 Battery performance
To investigate the stability of the Li2O–LiI–MoO3 solid electrolytes to Li metal, Li symmetric cells were fabricated using 63Li2O·32LiI·5MoO3, and galvanostatic cycle tests were performed. Fig. 8 shows the long-term galvanostatic cycling tests of the cells at 100 °C. The cell with the Li2O–LiI–MoO3 solid electrolytes was cycled stably over 100 h, indicating that Li2O–LiI–MoO3 solid electrolytes were stable to Li metals. Although MoO3 is not thermodynamically stable against the Li metal, a small amount of MoO3 did not decrease the stability of the entire Li2O–LiI–MoO3 solid electrolyte against the Li metal. In addition, the overvoltage of the cell with the Li2O–LiI–MoO3 solid electrolyte was lower than that with the Li2O–LiI solid electrolyte. This is because the ionic conductivity of the Li2O–LiI–MoO3 solid electrolytes was higher than that of the Li2O–LiI solid electrolytes. | ||
| Fig. 8 Galvanostatic cycling tests of the symmetric cells (Li/67Li2O·33LiI/Li) and (Li/63Li2O·32LiI·5MoO3/Li). | ||
To enable the application of the Li2O–LiI–MoO3 solid electrolytes for all-solid-state batteries, all-solid-state cells were fabricated using composite electrodes, including the Li2O–LiI–MoO3 solid electrolyte. Lithium sulfide and silicon were used as active materials in the composite positive and negative electrodes, respectively. Fig. 9 shows the XRD patterns of the composite electrodes prepared via ball-milling. Sharp peaks of Li2S and Si and halo patterns were observed, indicating that the composites consisted of crystalline active materials distributed in an amorphous matrix. The peaks derived from LiI disappeared because LiI formed a solid solution with Li2S, or Si or SiOx on the surface of Si. Fig. 10(a) and (b) show half-cells with Li2S and Si, respectively. The Li2O–LiI–MoO3 electrolytes were used in the composite to evaluate suitability to the active materials. The half-cell with Li2S exhibited an irreversible capacity during the initial cycle. This is because the Li2O–LiI–MoO3 solid electrolyte may be oxidized at ca. 2.2 V vs. Li–In. The oxidation voltage of the Li2O–LiI solid electrolyte was ca. 2.1 V vs. Li–In.24 In addition, the Li2O–LiI–MoO3 solid electrolytes include Li2O–LiI components and should have the same oxidation voltage. After the first cycle, the cell with Li2S operated reversibly, indicating that the initial irreversible capacity did not adversely affect subsequent cycles. The half-cell using Si exhibited almost 2000 mA h g−1 over 20 cycles. These results showed that the Li2O–LiI–MoO3 solid electrolyte can be used for both positive and negative electrodes.
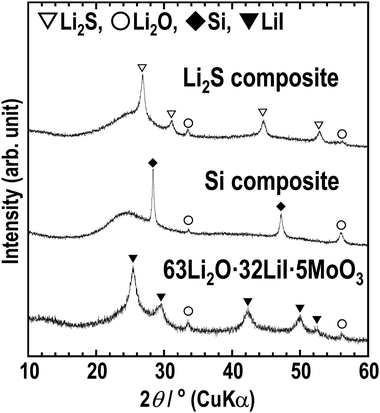 | ||
| Fig. 9 XRD patterns of the Li2S-VGCF–63Li2O·32LiI·5MoO3 composite (Li2S composite), Si-VGCF–63Li2O·32LiI·5MoO3 composite (Si composite), and 63Li2O·32LiI·5MoO3. | ||
Finally, all-solid-state Si/Li2S full cells were fabricated, and charge–discharge tests were performed at 25 °C. The Li2O–LiI–MoO3 sample was contained in both the composite electrodes and the separator layer. Fig. 10(c) shows the charge–discharge curves of the full cell. Although an irreversible capacity was observed (for the same reason as for the Li2S-half cell), the cell worked reversibly at 25 °C over 20 cycles. Therefore, Li2O–LiI–MoO3 solid electrolytes can be used in all-solid-state batteries.
4. Conclusions
To improve the ionic conductivity of Li2O–LiI solid electrolytes, Li2O–LiI–MoO3 solid electrolytes were prepared by adding MoO3 to Li2O–LiI solid electrolytes. Then, amorphous-like samples were prepared using a mechanochemical process. MoO3 was incorporated into the amorphous structure and MoO42− was partially formed in the amorphous components. The addition of MoO3 to the Li2O–LiI solid electrolytes was found to improve the ionic conductivity. The Li2O–LiI–MoO3 solid electrolytes were stable to Li metal and full cells that used them worked reversibly at 25 °C, which proved that Li2O–LiI–MoO3 solid electrolytes were suitable for application in all-solid-state batteries. This work will contribute to the further study of solid oxide electrolytes.Author contributions
Y. F. wrote the manuscript. Y. F. synthesized and characterized the samples. T. A. fabricated and measured Li-symmetric cells. T. O. subjected the samples to NMR and RIR and analyzed the data. D. J., H. T., and S. M. analyzed the samples using TEM. A. S. and A. H. supervised the study. All authors discussed the results and reviewed and approved the final manuscript.Data availability
The information to confirm the reproducibility of the experiments is basically presented in the figures and tables of the main text.Conflicts of interest
There are no conflicts to declare.Acknowledgements
This research was supported by JSPS KAKENHI (grant no. JP19H05816, JP23KJ1833, and JP23H04633) and the GteX Program Japan (grant No. JPMJGX23S5).Notes and references
- P. Jiang, G. Du, J. Cao, X. Zhang, C. Zou, Y. Liu and X. Lu, Energy Technol., 2023, 11, 2201288 CrossRef CAS.
- C. Chen, K. Wang, H. He, E. Hanc, M. Kotobuki and L. Lu, Small, 2023, 19, e2205550 CrossRef PubMed.
- P. Wu, W. Zhou, X. Su, J. Li, M. Su, X. Zhou, B. W. Sheldon and W. Lu, Adv. Energy Mater., 2023, 13, 2203440 CrossRef CAS.
- G. Kalita, T. Endo and T. Nishi, J. Alloys Compd., 2023, 969, 172282 CrossRef CAS.
- P. J. Kumar, K. Nishimura, M. Senna, A. Düvel, P. Heitjans, T. Kawaguchi, N. Sakamoto, N. Wakiya and H. Suzuki, RSC Adv., 2016, 6, 62656–62667 RSC.
- Y. Liu, J. Liu, Q. Sun, D. Wang, K. R. Adair, J. Liang, C. Zhang, L. Zhang, S. Lu, H. Huang, X. Song and X. Sun, ACS Appl. Mater. Interfaces, 2019, 11, 27890–27896 CrossRef CAS PubMed.
- X. Tao, Y. Liu, W. Liu, G. Zhou, J. Zhao, D. Lin, C. Zu, O. Sheng, W. Zhang, H.-W. Lee and Y. Cui, Nano Lett., 2017, 17, 2967–2972 CrossRef CAS PubMed.
- M. Monchak, T. Hupfer, A. Senyshyn, H. Boysen, D. Chernyshov, T. Hansen, K. G. Schell, E. C. Bucharsky, M. J. Hoffmann and H. Ehrenberg, Inorg. Chem., 2016, 55, 2941–2945 CrossRef CAS PubMed.
- Y. Ren, K. Chen, R. Chen, T. Liu, Y. Zhang and C.-W. Nan, J. Am. Ceram. Soc., 2015, 98, 3603–3623 CrossRef CAS.
- Z. Wang, S.-H. Luo, X. Zhang, S. Guo, P. Li and S. Yan, J. Non-Cryst. Solids, 2023, 619, 122581 CrossRef CAS.
- H. Nagata and J. Akimoto, J. Power Sources, 2021, 491, 229620 CrossRef CAS.
- T. Okumura, S. Taminato, Y. Miyazaki, M. Kitamura, T. Saito, T. Takeuchi and H. Kobayashi, ACS Appl. Energy Mater., 2020, 3, 3220–3229 CrossRef CAS.
- T. Okumura, T. Takeuchi and H. Kobayashi, Solid State Ionics, 2016, 288, 248–252 CrossRef CAS.
- K. Nagao, A. Hayashi and M. Tatsumisago, J. Ceram. Soc. Jpn., 2016, 124, 915–919 CrossRef CAS.
- K. Nagao, M. Nose, A. Kato, A. Sakuda, A. Hayashi and M. Tatsumisago, Solid State Ionics, 2017, 308, 68–76 CrossRef CAS.
- K. Nagao, M. Shigeno, A. Inoue, M. Deguchi, H. Kowada, C. Hotehama, A. Sakuda, M. Tatsumisago and A. Hayashi, J. Non-Cryst. Solids: X, 2022, 14, 100089 CAS.
- Y. Yoneda, M. Shigeno, T. Kimura, K. Nagao, C. Hotehama, A. Sakuda, M. Tatsumisago and A. Hayashi, Solid State Ionics, 2021, 363, 115605 CrossRef CAS.
- Y. Yoneda, C. Hotehama, A. Sakuda, M. Tatsumisago and A. Hayashi, J. Ceram. Soc. Jpn., 2021, 129, 458–463 CrossRef CAS.
- M. Tatsumisago, R. Takano, M. Nose, K. Nagao, A. Kato, A. Sakuda, K. Tadanaga and A. Hayashi, J. Ceram. Soc. Jpn., 2017, 125, 433–437 CrossRef.
- K. Nagao, M. Suyama, A. Kato, C. Hotehama, M. Deguchi, A. Sakuda, A. Hayashi and M. Tatsumisago, ACS Appl. Energy Mater., 2019, 2, 3042–3048 CrossRef CAS.
- K. Nagao, A. Sakuda, A. Hayashi and M. Tatsumisago, J. Power Sources, 2019, 424, 215–219 CrossRef CAS.
- Y. Fujita, Y. Kawasaki, T. Inaoka, T. Kimura, A. Sakuda, M. Tatsumisago and A. Hayashi, Electrochemistry, 2021, 89, 334–336 CrossRef CAS.
- Y. Fujita, T. Kimura, M. Deguchi, K. Motohashi, A. Sakuda, M. Tatsumisago, H. Tsukasaki, S. Mori, K. Ikeda, K. Ohara, N. Kuwata, K. Amezawa and A. Hayashi, J. Phys. Chem. C, 2023, 127, 14687–14693 CrossRef CAS.
- Y. Fujita, A. Sakuda, Y. Hasegawa, M. Deguchi, K. Motohashi, D. Jiong, H. Tsukasaki, S. Mori, M. Tatsumisago and A. Hayashi, Small, 2023, 19, 2302179 CrossRef CAS PubMed.
- J. Ding, Y. Fujita, H. Tsukasaki, H. Nakajima, A. Sakuda, A. Hayashi and S. Mori, ACS Appl. Energy Mater., 2023, 6, 9737–9742 CrossRef CAS.
- H. Nagata and J. Akimoto, Solid State Ionics, 2022, 379, 115905 CrossRef CAS.
- H. Nagata and J. Akimoto, Electrochemistry, 2022, 90, 017006 CrossRef CAS.
- M. Tatsumisago, M. Takahashi, T. Minami, M. Tanaka, N. Umesaki and N. Iwamoto, Yogyo Kyokaishi, 1986, 94, 464–469 CrossRef CAS.
- M. Tatsumisago, T. Minami and M. Tanaka, J. Am. Ceram. Soc., 1981, 64, C-97–C-98 CrossRef CAS.
- A. Pradel, T. Pagnier and M. Ribes, Solid State Ionics, 1985, 17, 147–154 CrossRef CAS.
- W. H. Zachariasen, J. Am. Chem. Soc., 1932, 54, 3841–3851 CrossRef CAS.
- W. Ben Nasr, H. Kchaou and A. Ben Rhaiem, Phys. E, 2018, 102, 110–116 CrossRef CAS.
- G. D. Saraiva, W. Paraguassu, P. T. C. Freire, A. J. Ramiro de Castro, F. F. de Sousa and J. Mendes Filho, J. Mol. Struct., 2017, 1139, 119–124 CrossRef CAS.
- K. Zhang, Q. Kuang, X. Zeng, N. Wen, Z. Zhou, Q. Fan, Y. Dong and Y. Zhao, Electrochim. Acta, 2020, 348, 136309 CrossRef CAS.
- V. V. Solov’ev, N. F. Kovalenko, K. B. Kushkhov and V. I. Shopoval, Theor. Exp. Chem., 1991, 27, 113–116 CrossRef.
- O. Barinova, S. Kirsanova, A. Sadovskiy and I. Avetissov, J. Cryst. Growth, 2014, 401, 853–856 CrossRef CAS.
- E. C. Self, L. Zou, M.-J. Zhang, R. Opfer, R. E. Ruther, G. M. Veith, B. Song, C. Wang, F. Wang, A. Huq and J. Nanda, Chem. Mater., 2018, 30, 5061–5068 CrossRef CAS.
- L. L. Driscoll, E. H. Driscoll, B. Dong, F. N. Sayed, J. N. Wilson, C. A. O’Keefe, D. J. Gardner, C. P. Grey, P. K. Allan, A. A. L. Michalchuk and P. R. Slater, Energy Environ. Sci., 2023, 16, 5196–5209 RSC.
- N. Satyanarayana, G. Govindaraj and A. Karthikeyan, J. Non-Cryst. Solids, 1991, 136, 219–226 CrossRef CAS.
- B. Tanujit, G. S. Varma and S. Asokan, J. Am. Ceram. Soc., 2019, 102, 7244–7252 CrossRef CAS.
- T. Minami, K. Imazawa and M. Tanaka, J. Non-Cryst. Solids, 1980, 42, 469–476 CrossRef CAS.
- Z. Wiśniewski, R. Wiśniewski, D. Zasada, R. Dziduszko and T. Wilczyńska, J. Phys.: Conf. Ser., 2009, 144, 012084 CrossRef.
- A. Karthikeyan and K. J. Rao, J. Phys. Chem. B, 1997, 101, 3105–3114 CrossRef CAS.
- S. Hemlata, P. R. Sarode and K. J. Rao, J. Non-Cryst. Solids, 1983, 54, 313–321 CrossRef CAS.
- T. Minami, T. Katsuda and M. Tanaka, J. Non-Cryst. Solids, 1978, 29, 389–395 CrossRef CAS.
- H. Senapati, G. Parthasarathy, S. T. Lakshmikumar and K. J. Rao, Philos. Mag. B, 1983, 47, 291–297 CAS.
- A. Sanson, F. Rocca, G. Dalba, P. Fornasini and R. Grisenti, New J. Phys., 2007, 9, 88 CrossRef.
- K. Nassau, A. M. Glass, M. Grasso and D. H. Olson, J. Electrochem. Soc., 1980, 127, 2743–2747 CrossRef CAS.
- L. Bih, M. El Omari, J. M. Réau, A. Nadiri, A. Yacoubi and M. Haddad, Mater. Lett., 2001, 50, 308–317 CrossRef CAS.
| This journal is © The Royal Society of Chemistry 2024 |

