 Open Access Article
Electrical conductivity of monolithic and powdered carbon aerogels and their composites
Jessica
Kröner
a,
Dominik
Platzer
b,
Barbara
Milow
a and
Marina
Schwan
 *a
*a
aGerman Aerospace Center, Institute of Material Research, Cologne, Germany. E-mail: Marina.Schwan@dlr.de
bUniversity of Stuttgart, Institute of Aircraft Design, Stuttgart, Germany
First published on 18th September 2024
Abstract
The electrical conductivity of powdered carbon aerogels is one of the key factors required for electro-chemical applications. This study investigates the correlation between the structural, physical, mechanical and electrical properties of pure and activated carbon aerogels, as well as aerogel-composites. The thermal activation with carbon dioxide led to higher electrical conductivity and a decrease in density and particle size. Furthermore, the influence of applied force, compressibility of aerogels and aerogel composites on electrical conductivity was studied. A number of different carbonaceous powdered additives with various morphologies, from almost spherical to fiber- and flake-like shaped, were investigated. For two composites, theoretical values for conductivity were calculated showing the great contribution of particle shape to the conductivity. The results show that the conductive behavior of composites during compression is based on both the mechanical particle arrangement mechanism and increasing particle contact area.
1. Introduction
Carbon aerogels are three-dimensional, nanostructured open-porous, amorphous materials produced via carbonization of organic aerogels (e.g. resorcinol–formaldehyde,1–5 phenol–formaldehyde,6 resorcinol–formaldehyde–melamine,7 melamine–formaldehyde,8 cresol–formaldehyde9 or biomass-based materials10). The unique properties of carbon aerogels such as well-controlled porosity, large specific surface area, high electrical conductivity, and low envelope density make them promising materials for application in adsorption,11 catalysis,12 and supercapacitors13 or as a cathode host in lithium–sulfur cells.14The network of carbon aerogels consists of interconnected nanosized primary particles within a largely porous space. Micropores (pores smaller 2 nm) have the intraparticle structure – pores inside of primary particles; and meso- (pores between 2 and 50 nm) and macropores have the interparticle (outside and between the particles) structure, as can be seen in Fig. 1. The particle and pore sizes, as well as pore-size distribution, depend on the gelation and aging conditions as well as the morphology of their organic counterparts,15 solvent exchange procedure,16 drying methods,17 and carbonization parameters.18
Carbon aerogels exhibit remarkable electrical conductivity which induces the potential for electrochemical applications. In amorphous carbon both sp2- and sp3-hybridized carbon atoms are present, and the conductive sp2-phase is distributed in the electrically insulated sp3-phase. The weak π bonds and different orientations of the π interactions cause the localization of π and π* bands within the σ–σ* gap. Since, the σ–σ* mobility gap is higher than that of π–π*, it is expected that the electronic transport will occur within the π–π* localized state via a hopping mechanism.19 The electrical conductivity of amorphous carbon materials is related to their electronic structure, the size of graphitic lattices or graphitic character,20 heteroatoms21 and the so-called bulk electrical conductivity of the skeleton.
Despite the high number of possible applications, the number of studies on the electrical conductivity of carbon aerogels is rather low. Wang et al. evaluated the electrical conductivity of monolithic carbon aerogels with different microstructures.22 They showed that the envelope density and electrical conductivity are well-correlated. Carbon aerogels with high density and closely packed particles (conducting grains) exhibited high electrical conductivity. Mesoporous carbon aerogels, where the distance between the particles is higher showed a lower ability to conduct. Similar results were shown by Lu et al.23 For carbon aerogels with densities in the range of 60 to 650 kg m−3 the scaling exponent was found to be 1.5 ± 0.1. This is due to the fact that in a dense network more transport paths are present. Wiener et al. studied the influence of carbonization temperature on the electrical conductivity of carbon aerogels.24 They observed that the electrical conductivity increased with increasing temperature between 800 °C and 2500 °C. However, the surface area decreased significantly above temperatures of 1000 °C.
In most electrochemical applications the carbon aerogels are used as a powder (e.g. electrode materials). However, studies on the electrical conductivity of carbon aerogels, in particular powdered aerogels, are lacking. Thus, the measurement of the electrical conductivity of powder materials is becoming very important. In the powdered state, the conductivity of the sample constitutes
– Conductivity of individual grains.
– Conductivity of powder.
The conductivity of individual grains depends only on the conductivity of the material (monolithic conductivity). In contrast, the conductivity of powders depends on several factors such as the shape of grains, their packing density, compressibility, and the contact between the grains. The measurements of the electrical resistivity of powders are mostly performed on the bed of grains under pressure.25–28
In this study, first the correlation between the morphological, structural and electrical properties of four different carbon aerogels is discussed. Carbon aerogels were activated using the well-known Boudouard reaction, wherein, carbon dioxide reacts with carbon to produce carbon monoxide. The influence of thermal activation with CO2 on the properties of carbon aerogels is shown. In the second part, the electrical conductivity of several aerogel-composites and the role of conductive additives, their particle shape and compressibility are presented.
2. Experimental
2.1. Classification of aerogels
For our study, we produced four types of resorcinol–formaldehyde (RF) aerogels and carbonized them to carbon aerogels (CA). The first type RF1 is a stiff RF aerogel, which results in a carbonized stiff carbon aerogel CA1. The second type is a flexible RF aerogel (RF2), and its carbonized form is termed flexible carbon aerogel (CA2).29 The third type is a ductile carbon aerogel RF3 and the carbonized form is called CA3, while the fourth aerogel is RF4 and the carbonized form CA4 is based on the work of Richard Pekala.302.2. Synthesis of resorcinol–formaldehyde (RF) aerogels
At room temperature, resorcinol (R) (98%, Aldrich) was dissolved in deionized water (W) and stirred at 150 rpm using a cross-magnetic stirring bar. Then, an aqueous solution of formaldehyde (F) and sodium carbonate (C) (Aldrich) was added to the stirred resorcinol solution. For RF2, an aqueous solution of formaldehyde 37% w/w, stabilized with 10% methanol (Merck) and for RF3 an aqueous solution of formaldehyde 24% w/w, not stabilized (VWR) was used. RF4 and RF1 were prepared using an aqueous solution of formaldehyde 23% and 5% w/w stabilized with 1% methanol (Carl Roth). The molar ratios of the chemicals used are given in Table 1. After 5 min of stirring, the pH of RF2 was adjusted to 5.4–5.6 by dropwise addition of 2 N nitric acid (Alfa Aesar). The pH value of RF2, RF3 and RF4 was not changed. The stirring at room temperature was continued, followed by transferring the homogeneous transparent solution in a sealable polypropylene container for 2 days for RF1 and 7 days for RF2, RF3 and RF4 to an oven at 60 °C (Memmert GmbH, Germany) for storage. After the given gelation time, the wet RF1 gel was dried for 2 days at 80 °C in a drying cabinet (Memmert GmbH, Germany). RF2, RF3 and RF4 were cooled down to room temperature and transferred into an acetone bath (pure, technical grade, TH. Geyer) to remove the residual chemicals and to exchange water with acetone, which was soluble in supercritical carbon dioxide. The acetone was refreshed six times within 3 days. Supercritical drying was performed with CO2 (purity ≥99.995%, Praxair) in an autoclave of 60 L volume (Eurotechnica, Germany) at 60 °C and 110 bars for about 21 h. The degassing rate was adjusted to 0.2 bars per minute.| Type of aerogel | R![[thin space (1/6-em)]](https://www.rsc.org/images/entities/char_2009.gif) : :![[thin space (1/6-em)]](https://www.rsc.org/images/entities/char_2009.gif) C molar ratio C molar ratio |
R![[thin space (1/6-em)]](https://www.rsc.org/images/entities/char_2009.gif) : :![[thin space (1/6-em)]](https://www.rsc.org/images/entities/char_2009.gif) W molar ratio W molar ratio |
R![[thin space (1/6-em)]](https://www.rsc.org/images/entities/char_2009.gif) : :![[thin space (1/6-em)]](https://www.rsc.org/images/entities/char_2009.gif) F molar ratio F molar ratio |
pH of initial solution | Stirring time (min) | Gelation time (days) | Drying conditions |
|---|---|---|---|---|---|---|---|
| RF1 | 1500 | 0.044 | 0.66 | 30 | 2 | Ambient pressure 80 °C | |
| RF2 | 50 | 0.008 | 0.5 | 5.4–5.6 | 60 | 7 | Supercritical CO2 |
| RF3 | 250 | 0.038 | 0.74 | 30 | 7 | Supercritical CO2 | |
| RF4 | 200 | 0.019 | 0.5 | 30 | 7 | Supercritical CO2 |
2.3. Carbonization
The carbonization was carried out in an electric furnace (KS-3-80-Vac-Sonder, Linn High Therm, Germany) using nitrogen (purity ≥99.999%, Linde). The RF aerogels were placed in the furnace, purged three times with nitrogen, and heated to the carbonization temperature of 1000 °C. The heating rate was adjusted to 5 K min−1, and the pressure was adjusted to 50 mbar. Subsequently the activation was performed using CO2 at 1000 °C. The carbonization and activation time (as shown in Table 2) was varied. After carbonization and activation, the aerogels were cooled down to room temperature under a flow of nitrogen.| Sample | Carbonization | Activation |
|---|---|---|
| N2 | 1000 °C, 1 h, N2, 22 L h−1 | — |
| 1hN2/1hCO2 | 1000 °C, 1 h, N2, 22 L h−1 | 1000 °C, 1 h, CO2, 10 L h−1 |
| 2hN2/2hCO2 | 1000 °C, 2 h, N2, 22 L h−1 | 1000 °C, 2 h, CO2, 10 L h−1 |
2.4. Preparation of composites
In order to increase the electrical conductivity of the carbon aerogels, different additives were used to create aerogel composites with the help of a shaker mill. In this work carbon aerogel CA2 were combined with (1) spherical graphite (SG, ProGraphite, Germany); (2) high-conductive graphite (HCG, ProGraphite, Germany); (3) graphite felt (GF, Alfa Aesar, Germany); (4) graphene nanoplatelets (GN1, Fisher Scientific, Canada); and (5) graphene nanoplatelets (GN2, ZEN Graphene Solutions, Canada). The additive contents were adjusted to mixture ratios of 1![[thin space (1/6-em)]](https://www.rsc.org/images/entities/char_2009.gif) :
:![[thin space (1/6-em)]](https://www.rsc.org/images/entities/char_2009.gif) 1 (50 wt%) and 1
1 (50 wt%) and 1![[thin space (1/6-em)]](https://www.rsc.org/images/entities/char_2009.gif) :
:![[thin space (1/6-em)]](https://www.rsc.org/images/entities/char_2009.gif) 5 (16.67 wt%).
5 (16.67 wt%).
2.5. Preparation of powdered samples
For pulverization of the aerogel as well as to create aerogel-composites a shaker mill MM 400 (Retsch, Germany) was used. The milling process was conducted at a frequency of 30 Hertz for 30 seconds for aerogels and 60 seconds for composites under dry conditions. Three hardened steel balls with a diameter of 15 mm were added into each grinding jar. Because of their powder property, pure graphene nanoplatelet materials were taken as-received without milling for conductivity measurements.2.6. Characterization of carbon aerogels
The microstructure of the aerogels was investigated using a scanning electron microscope (SEM) (Zeiss Merlin, Germany). For specimen preparation, all aerogels were coated with platinum for 90 s with 16 mA. The bulk densities were measured using a GeoPyc instrument and the skeletal densities using an AccuPyc instrument based on displacement measurement techniques (Micromeritics, Germany). For physisorption experiments the samples were degassed for 12 h at 200 °C and 0.1–0.5 mbar (SmartVacPrep, Micromeritics, Germany). The measurements of specific surface area, meso- and micropore size distribution, mesopore volume, and micropore volume were measured at 77 K via nitrogen adsorption–desorption isotherms (3Flex, Micromeritics, Germany). The calculations were based on BET/BJH/DFT/t-plot methods. For t-plot and BJH, a carbon black STSA model and for the DFT method, an N2-DFT Model was used. The level of graphitization was investigated using Raman spectroscopy (XploRA PLUS, Horiba Scientific). The ratio ID/IG was calculated from the peak areas of the D and G peaks.2.7. Conductivity measurements
The electrical conductivity of the sample materials was investigated using the resistivity measuring system Loresta GX (Mitsubishi Chemical Europe). This system is based on the 4-pin measuring method of surface resistivity and can be used either for monoliths or for powder materials depending on the probe unit. As seen in Fig. 2, a current flows through the outer pins 1 and 4, which leads to a measurable potential difference between the two inner pins. This potential difference depends on the surface resistivity of the sample material, which is further used to calculate volume resistivity and thus the electrical conductivity. These calculations are implemented in the Loresta GX measuring system.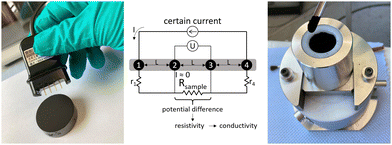 | ||
| Fig. 2 (left) Measurement of electrical conductivity on the monolithic carbon aerogel; (middle) sketch of the measurement principle (adapted from the manual); (right) measurement of electrical conductivity of the powdered carbon aerogel.31 | ||
Monolithic samples were measured using an ASP Probe RMH110 (Mitsubishi Chemical Europe). Shown in Fig. 2 left, this probe unit is equipped with four needle pins in a linear pattern with a distance L of 5 mm between neighboring pins. For conductivity measurements, the probe unit was placed in the middle of each sample and manually pressed on the sample until all four pins were inserted.
Powder samples were investigated by using the powder measuring unit PD-51 (Mitsubishi Chemical Europe) at force levels between 1 and 20 kN. In this system, approximately 1 g of powder is filled in a probe cylinder which will be moved upwards against a probe piston. The four measuring pins for conductivity measurements are located at the bottom of the probe cylinder on a flat contact surface in a linear pattern. The distance between neighboring pins is 3 mm. The thickness of the sample is determined using a displacement transducer. In Fig. 3 the interior setup of a PD-51 measuring unit is seen.
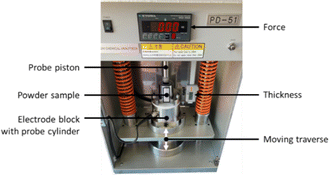 | ||
| Fig. 3 Setup for measurements on powdered materials.31 | ||
Additional to the force levels of 1–20 kN it was decided to calculate an approximate value for “uncompressed” initial bulk density ρ by measuring the sample thickness t at a force of F = 0.02 kN to evaluate the compression behavior. The bulk density was calculated using the sample weight m, the constant inner probe cylinder radius r = 10 mm and the sample thickness t by
 | (1) |
For evaluation of the results, the pressure p and compression ε were calculated using
 | (2) |
3. Results and discussion
In this section, first the morphology of the monolithic carbon aerogels is illustrated and discussed and then the influence of the microstructure and activation on the electrical conductivity on both monolithic and powdered aerogels. This is followed by discussions of the electrical conductivity of the additives and aerogel composites.3.1. Aerogels
The properties of the studied monolithic carbon aerogels are summarized in Table 3. CA3 exhibits the highest envelope density in the 0.57–0.61 g cm−3 range, while the envelope densities of CA1 are 0.41–0.45 g cm−3 and those of CA4 are 0.30–0.33 g cm−3, which are lower. In contrast, CA2 is a very light aerogel with exceptionally low envelope densities of only 0.06–0.08 g cm−3. For CA2 and CA4, the density decreases with a longer activation time. The skeletal densities vary in the typical range for amorphous carbons between 1.8 and 2.2 g cm−3,32 and no noticeable changes were observed.| Properties | Carbonization | CA1 | CA2 | CA3 | CA4 |
|---|---|---|---|---|---|
| a Calculation using eqn 4–7. | |||||
| Envelope density (g cm−3) | 1h N2 | 0.420 ± 0.0009 | 0.076 ± 0.0002 | 0.565 ± 0.0013 | 0.328 ± 0.0007 |
| 1hN2/1hCO2 | 0.453 ± 0.0023 | 0.073 ± 0.0001 | 0.614 ± 0.0016 | 0.325 ± 0.0008 | |
| 2hN2/2hCO2 | 0.410 ± 0.0011 | 0.062 ± 0.0001 | 0.599 ± 0.0017 | 0.303 ± 0.0010 | |
| Skeletal density (g cm−3) | 1h N2 | 2.14 ± 0.06 | 1.78 ± 0.04 | 2.08 ± 0.02 | 2.03 ± 0.02 |
| 1hN2/1hCO2 | 2.10 ± 0.02 | 1.99 ± 0.08 | 1.95 ± 0.01 | 2.08 ± 0.01 | |
| 2hN2/2hCO2 | 2.29 ± 0.03 | 2.05 ± 0.12 | 1.85 ± 0.002 | 2.22 ± 0.03 | |
| Porositya (%) | 1h N2 | 80 | 96 | 73 | 84 |
| 1hN2/1hCO2 | 78 | 96 | 69 | 84 | |
| 2hN2/2hCO2 | 82 | 97 | 68 | 86 | |
| Specific surface area (m2 g−1) | 1h N2 | 590 ± 14 | 500 ± 60 | 629 ± 13 | 692 ± 22 |
| 1hN2/1hCO2 | 664 ± 9 | 770 ± 40 | 660 ± 18 | 714 ± 45 | |
| 2hN2/2hCO2 | 680 ± 71 | 1153 ± 72 | 731 ± 31 | 823 ± 29 | |
| Micropore volume (cm3 g−1) | 1h N2 | 0.19 ± 0.01 | 0.17 ± 0.03 | 0.10 ± 0.01 | 0.10 ± 0.00 |
| 1hN2/1hCO2 | 0.22 ± 0.01 | 0.27 ± 0.02 | 0.13 ± 0.01 | 0.11 ± 0.01 | |
| 2hN2/2hCO2 | 0.22 ± 0.03 | 0.42 ± 0.03 | 0.15 ± 0.01 | 0.14 ± 0.01 | |
| Mesopore volume (cm3 g−1) | 1h N2 | 0.40 ± 0.01 | 0.12 ± 0.02 | 1.01 ± 0.04 | 2.57 ± 0.03 |
| 1hN2/1hCO2 | 0.49 ± 0.07 | 0.10 ± 0.02 | 1.03 ± 0.03 | 2.47 ± 0.16 | |
| 2hN2/2hCO2 | 0.39 ± 0.03 | 0.12 ± 0.02 | 1.03 ± 0.01 | 2.72 ± 0.12 | |
| Total pore volumea (cm3 g−1) | 1hN2 | 1.91 | 12.63 | 1.29 | 2.56 |
| 1hN2/1hCO2 | 1.73 | 13.14 | 1.12 | 2.59 | |
| 2hN2/2hCO2 | 2.00 | 15.61 | 1.13 | 2.85 | |
| Average pore diametera (nm) | 1h N2 | 13.0 | 101.0 | 8.2 | 14.8 |
| 1hN2/1hCO2 | 10.4 | 68.3 | 6.8 | 14.5 | |
| 2hN2/2hCO2 | 11.8 | 54.2 | 6.2 | 13.9 | |
| Average particlea size (nm) | 1h N2 | 4.7 | 6.8 | 4.6 | 4.3 |
| 1hN2/1hCO2 | 4.3 | 3.9 | 4.7 | 4.0 | |
| 2hN2/2hCO2 | 3.9 | 2.5 | 4.4 | 3.3 | |
| I D/IG (powder) | 1h N2 | 4.06 ± 0.23 | 4.68 ± 0.15 | 4.94 ± 0.05 | 5.36 ± 0.27 |
| 1hN2/1hCO2 | 5.05 ± 0.56 | 4.86 ± 2.19 | 5.05 ± 0.05 | 5.69 ± 0.06 | |
| 2hN2/2hCO2 | 4.99 ± 0.22 | 4.90 ± 0.17 | 5.06 ± 0.03 | 5.41 ± 0.28 | |
The porosity Φ is calculated from the envelope and skeletal densities (ρe and ρs), as
 | (3) |
CA2 exhibits the highest porosity of approx 96%. The porosity of CA4, CA1 and CA3 is about 85%, 80% and 70%, respectively. Since the skeletal density can be considered constant, the porosity decreases with increasing envelope density.
The specific surface area increases with longer activation time for all carbon aerogels. With increase in holding and activation time the continual devolatilization and the reaction of carbon dioxide with carbon, results in the formation of new micropores and smaller particles, which increases the surface area and micropore volume of activated carbons. In the case of CA2, the specific surface area is doubled during activation with 2 h CO2, while the other aerogels show a smaller increase in the specific surface area. The same behaviour can be observed for the micropore volume. In the case of CA2, the micropore volume is more than doubled by activation, while in the case of the other aerogels it increases only slightly. CA1 and CA2 exhibit the highest micropore volume at 0.19 cm3 g−1 and 0.17 cm3 g−1, respectively, whereas that of CA3 and CA4 is 0.10 cm3 g−1 lower. CA2 has only a small amount of mesopores with a volume of 0.12 cm3 g−1, while CA3 and CA4 are almost completely mesoporous with mesopore volumes of 1.01 cm3 g−1 and 2.62 cm3 g−1, respectively.
The total pore volume Vpore is calculated from the envelope and skeletal densities (ρe and ρs) using
 | (4) |
It includes micropores and mesopores as well as macropores. It can be seen that CA2 has the highest total pore volume and CA3 the lowest. The calculated total pore volume shows that the CA3 and CA4 exhibit a very low macropore volume, while the microstructure of CA2 consists of a large proportion of macropores. Furthermore, it can be identified for CA2 and CA4 that the pore volume increases with longer activation time. Thereby, the increase is more pronounced for CA2 and is about 23.6%.
The average pore diameter dpore is calculated using eqn 5.
 | (5) |
The initial average pore diameter is the highest for CA2 (101 nm), which is 8 to 12 times higher than the dpore value of other aerogels. Tsuchiya et al. hypothesized that the presence of larger pores led to activation with higher efficiencies via enhanced diffusion of CO2 molecules within the carbon aerogel pore network during activation.33 This is in agreement with the results of this study. As described above, CA2 undergoes the highest changes in the microstructure compared to other aerogels.
The average particle size dP can be calculated using the BET surface area (SBET) and ρs using
 | (6) |
The particle size also decreases with longer holding and activation time for all carbon aerogels. The results are shown in Table 3. With increasing time, more carbon could react with CO2 to consume the solid material, and thus create smaller particles.
In general, the results show that changes in the microstructure are highly dependent on the original structure. Carbon aerogels with large pores in their structure are most strongly affected by thermal activation.
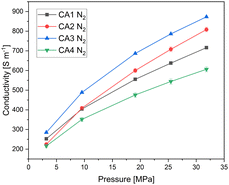
Fig. 4 shows the electrical conductivity of the carbon aerogel powders depending on the applied pressure. It can be seen that the electrical conductivity increases with increasing pressure for all carbon aerogels. As the applied pressure increases, the powder becomes more compact, resulting in an increased density. The higher the density, the more the electron pathways that are present and the higher is the electrical conductivity.
CA3, which exhibits the highest envelope density, shows the highest electrical conductivity, while CA4 shows the lowest electrical conductivity. It can be seen that the electrical conductivity increases with increasing envelope density, due to a higher solid content for electron. CA2 is an exception, as it shows a different behaviour: The slope for CA2 is steeper than for the other aerogels. At a pressure of 3 MPa, the electrical conductivity of CA2 is similar to that of CA4. With increasing pressure, the electrical conductivity of CA2 increases strongly and is higher than that of CA1 starting at about 10 MPa. At low applied pressures, CA2 exhibits low electrical conductivity, which is due to its low envelope density. Nevertheless, the conductivity at low pressures is almost as high as that of CA4. The reason for this is that CA2 was already compressed, as shown in Fig. 5, by about 63% at 3 MPa, whereas CA1, CA3 and CA4 are only compressed by half at this pressure. When the applied pressure is increased, the conductivity of CA2 increases more strongly than that of the other aerogels. Due to the high macropore volume and the softness, a strong compression is achieved.
In general, Fig. 5 shows clearly the influence of envelope density on compression behaviour of aerogels. Aerogels with a dense packed structure can only be compressed slightly. Thereby the aerogel CA2 with the lowest density can be very strongly deformed. Looking at both Fig. 4 and 5, it becomes clear that the compression behaviour of powders should be considered when interpreting the results of electrical conductivity. Additionally, Fig. 6 shows the electrical conductivity of different aerogels at a bulk density of 0.5 g cm−3 showing the intraparticle conductivity of the compressed network. To achieve a comparable density of 0.5 g cm−3, the different aerogels are compressed between 20% and 75%. It can be seen that the conductivity increases almost linearly for activated aerogels. For comparison purposes a similar approach was proposed by Rezaei et al.34 They calculated specific electrical conductivity considering both the bulk electrical conductivity and density in order to achieve a better comparison of conductivity under pressure. In our study CA3 and CA4 exhibit the highest conductivity at the same density. The influence of activation is the highest for CA2 and CA3 which is in agreement with previous discussion.
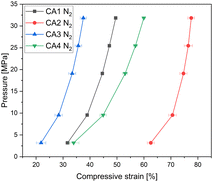 | ||
| Fig. 5 Compression curves of CA1–CA4 aerogels showing different deformation degrees, as measured starting from a pressure of 3 MPa. Flexible carbon aerogel CA2 exhibits the highest compression. | ||
 | ||
| Fig. 6 Conductivities of CA1–CA4 aerogels at the bulk density ρ = 0.5 g cm−3 showing a linear increase of conductivity from non-activated to activated samples. | ||
In Fig. 7 the electrical conductivity of carbon aerogel powders activated with CO2 is shown. For CA2 and CA4, measurements were also carried out on monoliths (“pressure 0 MPa” – without pressure). Due to the high brittleness of CA1 and CA3, the measurements were only conducted using CA2 and CA4. As expected, the electrical conductivity of the powders of CA1 (Fig. 7a) and CA4 (Fig. 7d) increases with longer activation time. Due to the activation and the longer heat treatment, the particles became smaller (Table 3), resulting in the powder being more compact and denser, thus leading to an increase in the electrical conductivity.
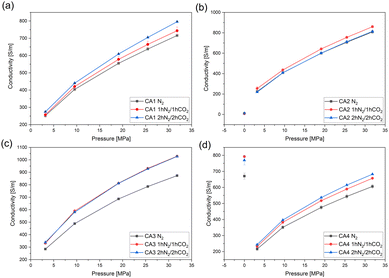 | ||
| Fig. 7 Electrical conductivity of (a) CA1-, (b) CA2-, (c) CA3- and (d) CA4-powders with and without activation. The monolithic aerogels (CA2 and CA4) were measured without applied pressure. | ||
The electrical conductivity of monolithic CA4 is higher than in the pulverized condition and the activated monoliths exhibit higher conductivities than those without activation.
For both CA2 powder and monoliths (Fig. 7b), the changes in electrical conductivity are negligibly small. The electrical conductivity of monolithic CA2 is much lower than that of powder. Furthermore, the electrical conductivity is the same for all carbonization reactions. The low conductivity of monolithic CA2 can be explained by the fact that it is an aerogel with a very high porosity and a large macro pore volume. For this reason, there is limited crosslinking and thus only few pathways for the electrons to flow. As a powder, CA2 is already strongly compressed at very low pressures, which leads to a higher electrical conductivity. In the case of CA2 the influence of high compression seems to prevalent microstructural properties.
The electrical conductivity of the activated aerogels of CA3 (Fig. 7c) is higher than that of the aerogels without activation. The activation with CO2 for 1 h and for 2 h shows similar conductivities.
In general, it can be observed that activation results in smaller particles, which leads to a more compact and dense structure, higher contact areas between single particles, and thus to a higher electrical conductivity.35 Moreover, during the heat treatment the formation of carbon atoms in the sp2-state and the associated π-bonds causes the delocalization of electrons.36
The Raman spectra provide information about the molecular vibrational modes of carbon aerogels.37 The ratio of graphitic carbonaceous material in the sample was evaluated using the G band. The G band at around 1580 cm−1 is originated from intramolecular in-plane vibration of sp2-hybridized carbon atoms.34 The D band is caused by breathing of sp2-carbon. It appears at around 1350 cm−1 and indicates that structural defects in the graphitic sp2 network are present in the material. Additional information can be obtained by calculating the ID/IG ratio. The ratio indicates the ratio between ordered structure and defects in it. An increase in ID/IG ratio is ascribed to an increase in the number and/or the size of sp2 clusters.
Fig. 8a shows two typical bands D and G of CA1. The Raman spectra of CA2, 3 and 4 look very similar to CA1. The relative intensity and the width of D bands compared to G bands increase slightly after activation with CO2 and after prolonged carbonization. These results indicate that after the carbon aerogels were subjected to the heat treatment and activation, the ordering of their structure slightly decreased with increasing ID/IG ratio. Fig. 8b shows the ID/IG ratios of carbon aerogels. The highest degree of disorder is exhibited by the aerogel CA4 and the lowest by CA1. As expected, the structure of aerogels became more disordered as activation with carbon dioxide proceeded.38 Presumably, the removal of carbon atoms during activation caused formation of defects and thus higher disorder in the structure.39 Jiang et al. also has observed a decrease in the graphitization degree, due to the fact that the activation time is directly related to the reaction time between the carbon network and the carbon dioxide. The more the carbon that could be gassified, the more the defects within the carbon plane that could be formed, which typically led to an increase in the ID/IG.40These results are in agreement with changes in specific surface area and particle sizes of activated carbon aerogels (Table 3).
 | ||
| Fig. 8 (a) Raman spectra of CA1 with different heat treatments; (b) ID/IG ratios of carbon aerogels with different heat treatments. | ||
3.2. Electrical conductivity of additives
In this study five different conductive additives were used. The additives were characterized in the original form as powders. Fig. 9 shows the electrical conductivity of additives and of one carbon aerogel CA2 for comparison. As can be observed, graphene nanoplates type GN1 exhibits the highest conductivity followed by high conductive graphite HCG, spherical graphite SG, graphite felt GF, and graphene nanoplate type GN2. High differences between graphene nanoplates from type GN1 and GN2 were not expected. However, the aerogel CA2 has the lowest conductivity, so it can be concluded that all of investigated additives can be used to increase the electrical conductivity of pure aerogel. | ||
| Fig. 9 Electrical conductivity of different conductive additives and of carbon aerogel CA2 under pressure. | ||
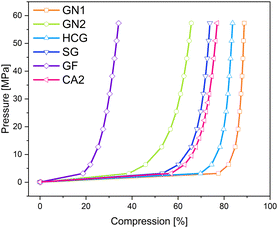
Similar to pure aerogels, described in the previous sub-section, the conductivity of additives increases with increased pressure. The applied pressure on the samples causes partial deformation of the particles and leads to the formation of irregular conductive pathways through the sample. Euler investigated the pressure dependence of powder conductivity and postulated three regions during compression.41 At the beginning of compression, where the slope is the highest, only dislocations of particles takes place. Upon further compression elastic and plastic deformation of granules takes place. The conductivity increases, but the slope is flatter. The last region appears at very high pressures, characterized by densification and closing of pores. The slope of the increase in conductivity in this region remains nearly constant. In the above-mentioned work, this region was not achieved due to the force limitation of the analysis machine. In Fig. 10 the changes in density and corresponding conductivities are shown. The conductivity seems to increase exponentially with increased density. The materials with the lowest densities CA2, GN2, and GF exhibit low electrical conductivities and the lowest slope of compression curves. All materials showed the highest conductivity at the pressure of 57.3 MPa. Nevertheless, the changes in density vary for different kinds of materials. The density of CA2, GN1, GN2, HCG, and SG was almost doubled under pressure. In contrast, the density of GF increased only by 30% in the same pressure range.
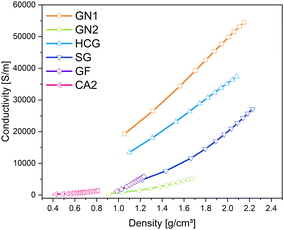 | ||
| Fig. 10 Changes in density of carbon materials with different electrical conductivities under pressure (0.06–57.3 MPa). | ||
The relationship between applied pressure and resulting compression is shown in Fig. 11. Here, it is important to note, that GN1 is heavily compressed to more than 70% until the pressure increases from 0.06 MPa to 3.18 MPa, which was even higher than the compression of the carbon aerogel CA2, indicating more free spaces between the particles. In contrast to that, the compression of GN2 was significantly lower. The lowest compression underwent graphite felt (GF), where the density change was the smallest.
In order to understand the reason for different compression behaviours and the influence of applied pressure, the morphology of additives was investigated.
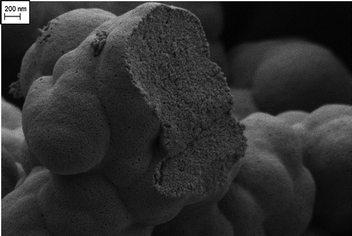
In Fig. 12 the morphology of additives and of CA2 are shown. The microstructured appearance of the samples can be classified into five different particle shape categories. First, the pure carbon aerogel CA2 in Fig. 12 shows typical aerogel structure – long chains of small spherical particles. Graphite felt (GF) contains broken fibers with different lengths. The particles of spherical graphite (SG), of graphene nanoplatelets of type GN1 and high conductive graphite (HCG) exhibit flat particles that look like platelets. However, the particles of SG are smaller than HCG and GN1, this corresponds to the information in the data sheet: the mean particle diameter of SG is 6 μm and is 45 μm for HCG. The particles of graphene nanoplatelets GN2 appear flake-like. According to the SEM images in Fig. 12, the sample materials with the self-defined particle shapes are ordered by conductivity in Table 4.
| Additive name | Conductivity at 0.06 MPa, [S m−1] | Maximum compression, [%] | Particle shape (self-defined) |
|---|---|---|---|
| GN1 (graphene) | 54![[thin space (1/6-em)]](https://www.rsc.org/images/entities/char_2009.gif) 534 534 |
89 | Platelet |
| HCG (graphite) | 37![[thin space (1/6-em)]](https://www.rsc.org/images/entities/char_2009.gif) 354 354 |
84 | Platelet |
| SG (graphite) | 27![[thin space (1/6-em)]](https://www.rsc.org/images/entities/char_2009.gif) 122 122 |
74 | Platelet |
| GF (graphite) | 6649 | 39 | Broken fibers |
| GN2 (graphene) | 5323 | 67 | Flakes |
| CA2 (amorphous carbon) | 1372 | 78 | Spherical |
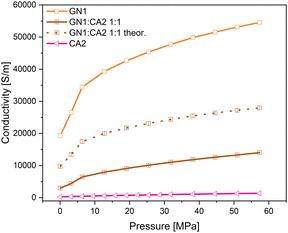
The additives with a particle shape of platelets achieved the highest conductivities. The graphene platelet material GN1 features the highest conductivity and is followed by the graphite platelet materials of high-conductive graphite and spherical graphite. Other samples show a lower conductivity level. Graphite felt with its broken fiber particles has only about 12% of the conductivity of the leading GN1. The GN2 consists of flake-like particles and exhibits the lowest conductivity of the additive materials used in this test series. Combining the particle shape categories with the measured densities during the conductivity measurement shown in Fig. 10, the highest compression and density increase were achieved by large platelet materials GN1 and HCG, followed by spherical particles of aerogel CA2, the small platelet particles of SG and the flake particles of GN2. The broken fibers of GF revealed the lowest compression ability. Thus, the compression and densification behavior strongly depends on particle shape, which in turn influences the electrical conductivity under pressure.
However, this simplified model demonstrates the differences only in interparticle contact resistance under pressure. The samples with platelet particles seem to be more compressible, thus the interparticle conductivity increases rapidly with applied forces.
3.3. Composites
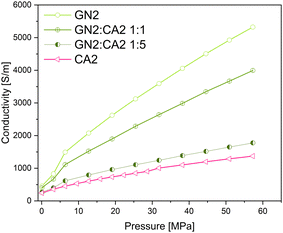
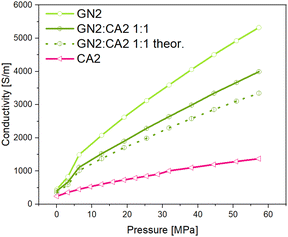
In order to investigate the changes in electrical conductivity of carbon aerogel CA2, two different types of graphene nanoplates GN1 from Fisher Scientific (Canada) and GN2 from ZEN Graphene Solutions (Canada) were used and investigated. The conductivity–pressure curves from both materials and their composites are shown in Fig. 14 and 15. Both, pure materials as well as composites with 1![[thin space (1/6-em)]](https://www.rsc.org/images/entities/char_2009.gif) :
:![[thin space (1/6-em)]](https://www.rsc.org/images/entities/char_2009.gif) 1 and 1
1 and 1![[thin space (1/6-em)]](https://www.rsc.org/images/entities/char_2009.gif) :
:![[thin space (1/6-em)]](https://www.rsc.org/images/entities/char_2009.gif) 5 mixtures show an increase in conductivity during increasing pressure. However, as already shown, the conductivity of GN1 is higher than that of GN2 by a factor of 10. In both cases the electrical conductivity of composites with a higher amount of additives (mixture 1
5 mixtures show an increase in conductivity during increasing pressure. However, as already shown, the conductivity of GN1 is higher than that of GN2 by a factor of 10. In both cases the electrical conductivity of composites with a higher amount of additives (mixture 1![[thin space (1/6-em)]](https://www.rsc.org/images/entities/char_2009.gif) :
:![[thin space (1/6-em)]](https://www.rsc.org/images/entities/char_2009.gif) 1) is significantly higher.
1) is significantly higher.
Even though the GN1![[thin space (1/6-em)]](https://www.rsc.org/images/entities/char_2009.gif) :
:![[thin space (1/6-em)]](https://www.rsc.org/images/entities/char_2009.gif) CA2 1
CA2 1![[thin space (1/6-em)]](https://www.rsc.org/images/entities/char_2009.gif) :
:![[thin space (1/6-em)]](https://www.rsc.org/images/entities/char_2009.gif) 1 sample revealed the highest conductivity of all composites, the calculated theoretical conductivity mean value is significantly higher than that measured for the 1
1 sample revealed the highest conductivity of all composites, the calculated theoretical conductivity mean value is significantly higher than that measured for the 1![[thin space (1/6-em)]](https://www.rsc.org/images/entities/char_2009.gif) :
:![[thin space (1/6-em)]](https://www.rsc.org/images/entities/char_2009.gif) 1 composite. For the calculation the simple rule of mixture was applied. In contrast to the GN1 composite, the measured GN2
1 composite. For the calculation the simple rule of mixture was applied. In contrast to the GN1 composite, the measured GN2![[thin space (1/6-em)]](https://www.rsc.org/images/entities/char_2009.gif) :
:![[thin space (1/6-em)]](https://www.rsc.org/images/entities/char_2009.gif) CA2 1
CA2 1![[thin space (1/6-em)]](https://www.rsc.org/images/entities/char_2009.gif) :
:![[thin space (1/6-em)]](https://www.rsc.org/images/entities/char_2009.gif) 1 sample achieved higher conductivities than the calculated mean value. The measured and theoretical conductivity values are shown in Fig. 16 and 17.
1 sample achieved higher conductivities than the calculated mean value. The measured and theoretical conductivity values are shown in Fig. 16 and 17.
Comparing the results, it can be assumed that the relative increase of electrical conductivity is influenced by the different particle shapes of GN1 and GN2. Spherical particles of the carbon aerogel combined with the flake-like particles of GN2 interact differently compared to aerogel particles with the platelet particles of GN1.
In Fig. 18 a simplified model of interaction between carbon aerogel particles and additive materials with flake and platelet is visualized. Keeping in mind the results shown in Fig. 13, it is assumed that the contact areas between neighboring platelet (GN1) particles are significantly reduced due to the spherical aerogel particles, located between parallel platelets. The orientation of non-spherical particles strongly enhances the percolation threshold of composites.42,43 The connecting points of neighbored flake particles (GN2) are multiplied by the aerogel particles. Small spherical particles fill the dead spaces between flakes and create new pathways, making the composite more conductive. Since the rule of mixture excludes the particle shape, the differences between theoretical and measured conductivities arise. Thus, the particle shape should be considered in the preparation of composites.
 | ||
| Fig. 13 Schematic visualization of electron transfer in graphene nanoplates of different types.31 The electrical conductivity of the platelet material is almost 10 times higher than in the flake-like structure. | ||
 | ||
| Fig. 14 Conductivity–pressure curve of graphene nanoplates GN1 (platelet), CA2 and their composites. | ||
 | ||
| Fig. 18 Schematic visualization of distribution of aerogel particles in flake-like (GN2) and platelet (GN1) structures of graphene nanoplates.31 | ||
4. Conclusions
The electrical conductivity of four different carbon aerogels has been investigated in this work. The results confirm that the conductivity is influenced by the envelope density of aerogels. Under pressure the deformation behaviour of aerogels influences the powder conductivity. With increased pressure the powder is compacted and the contact area between powder granules is increased. Thus, the conductivity grows by applied force. The heat treatment and activation with carbon dioxide clearly influence the structure and the conductivity of aerogels.Investigation of different conductive additives indicates the crucial role of particle shape in the electrical conductivity of powdered samples. Increased contact area of flat particles leads to high conductivity. In contrast, randomly oriented non-spherical particles exhibit lower conductivity. In composites, in addition to the particle shapes, the orientation of particles and dead spaces between particles can negatively influence the conductivity.
Author contributions
Conceptualization, J. K., D. P., and S. M.; methodology, J. K. and S. M.; validation, J. K., and D. P; writing – original draft preparation, J. K., and D. P.; writing – review and editing, J. K., S. M. and B. M.; All authors have read and agreed to the published version of the manuscript.Data availability
The original data are available from the corresponding author upon reasonable request.Conflicts of interest
There are no conflicts to declare.Acknowledgements
The authors acknowledge the contribution of Benjamin Ignatzi and Rebekka Probst for measurements on aerogels; ZEN Graphene Solutions, Ltd, Canada, and Prof. Lukas Bichler from UBCO, Kelowna, Canada, for donating materials used for experiments.References
- V. Bock, A. Emmerling and J. Fricke, J. Non-Cryst. Solids, 1998, 225, 69–73, DOI:10.1016/S0022-3093(98)00060-X.
- F. Li, L. Xie, G. Sun, Q. Kong, F. Su, Y. Cao, J. Wei, A. Ahmad, X. Guo and C.-M. Chen, Microporous Mesoporous Mater., 2019, 279, 293–315, DOI:10.1016/j.micromeso.2018.12.007.
- R. Saliger, V. Bock, R. Petricevic, T. Tillotson, S. Geis and J. Fricke, J. Non-Cryst. Solids, 1997, 221, 144–150, DOI:10.1016/S0022-3093(97)00411-0.
- A. Szczurek, G. Amaral-Labat, V. Fierro, A. Pizzi, E. Masson and A. Celzard, Mater. Chem. Phys., 2011, 129, 1221–1232, DOI:10.1016/j.matchemphys.2011.06.021.
- Z. Zapata-Benabithe, F. Carrasco-Marin, J. de Vicente and C. Moreno-Castilla, Langmuir, 2013, 29, 6166–6173, DOI:10.1021/la4007422.
- D. Wu, R. Fu, Z. Sun and Z. Yu, J. Non-Cryst. Solids, 2005, 351, 915–921, DOI:10.1016/j.jnoncrysol.2005.02.008.
- S. E. Muehlemann, L. Huber, S. Zhao, S. K. Matam and M. M. Koebel, Mater. Today Proc., 2018, 5, 13776–13784, DOI:10.1016/j.matpr.2018.02.018.
- Y. Nakanishi, Y. Hara, R. Miyamoto, K. Nakanishi and K. Kanamori, Mater. Adv., 2021, 2, 2604–2608, 10.1039/D1MA00034A.
- W. Li and S. Guo, Carbon, 2000, 38, 1520–1523, DOI:10.1016/S0008-6223(00)00114-7.
- D. K. Sam, E. K. Sam, A. Durairaj, X. Lv, Z. Zhou and J. Liu, Carbohydr. Res., 2020, 491, 107986, DOI:10.1016/j.carres.2020.107986.
- A. M. Saeed, P. M. Rewatkar, H. Majedi Far, T. Taghvaee, S. Donthula, C. Mandal, C. Sotiriou-Leventis and N. Leventis, ACS Appl. Mater. Interfaces, 2017, 9, 13520–13536, DOI:10.1021/acsami.7b01910.
- A. Sarapuu, K. Kreek, K. Kisand, M. Kook, M. Uibu, M. Koel and K. Tammeveski, Electrochim. Acta, 2017, 230, 81–88, DOI:10.1016/j.electacta.2017.01.157.
- D.-W. Park, N. A. Cañas, M. Schwan, B. Milow, L. Ratke and K. A. Friedrich, Curr. Appl. Phys., 2016, 16, 658–664, DOI:10.1016/j.cap.2016.03.021.
- M. Nojabaee, B. Sievert, M. Schwan, J. Schettler, F. Warth, N. Wagner, B. Milow and K. A. Friedrich, J. Mater. Chem. A, 2021, 9, 6508–6519, 10.1039/D0TA11332H.
- M. Wiener, G. Reichenauer, T. Scherb and J. Fricke, J. Non-Cryst. Solids, 2004, 350, 126–130, DOI:10.1016/j.jnoncrysol.2004.06.029.
- K. Kraiwattanawong, H. Tamon and P. Praserthdam, Microporous Mesoporous Mater., 2011, 138, 8–16, DOI:10.1016/j.micromeso.2010.10.001.
- N. Job, A. Théry, R. Pirard, J. Marien, L. Kocon, J.-N. Rouzaud, F. Béguin and J.-P. Pirard, Carbon, 2005, 43, 2481–2494, DOI:10.1016/j.carbon.2005.04.031.
- C. Lin and J. A. Ritter, Carbon, 2000, 38, 849–861, DOI:10.1016/S0008-6223(99)00189-X.
- C. Godet, Philos. Mag. B, 2001, 81, 205–222, DOI:10.1080/13642810108216536.
- D. Pantea, H. Darmstadt, S. Kaliaguine and C. Roy, Appl. Surf. Sci., 2003, 217, 181–193, DOI:10.1016/S0169-4332(03)00550-6.
- S. Pérez-Rodríguez, D. Torres and M. J. Lázaro, Powder Technol., 2018, 340, 380–388, DOI:10.1016/j.powtec.2018.09.038.
- J. Wang, S. Q. Zhang, J. Shen, Y. Z. Guo, S. M. Attia, B. Zhou, Z. Q. Lai, G. Z. Zheng and Y. S. Gui, J. Porous Mater., 2001, 8, 167–170, DOI:10.1080/13642810108216536.
- X. Lu, O. Nilsson, J. Fricke and R. W. Pekala, J. Appl. Phys., 1993, 73, 581–584, DOI:10.1063/1.353367.
- M. Wiener, G. Reichenauer, F. Hemberger and H. P. Ebert, Int. J. Thermophys., 2006, 27, 1826–1843, DOI:10.1007/s10765-006-0086-6.
- A. Celzard, J. Marêché, F. Payot and G. Furdin, Carbon, 2002, 40, 2801–2815, DOI:10.1016/S0008-6223(02)00196-3.
- V. Hoffmann, C. Rodriguez Correa, D. Sautter, E. Maringolo and A. Kruse, GCB Bioenergy, 2019, 11, 230–248, DOI:10.1111/gcbb.12545.
- J. M. Montes, F. G. Cuevas, F. Ternero, R. Astacio, E. S. Caballero and J. Cintas, Metals, 2017, 7, 479, DOI:10.3390/met7110479.
- J. Sánchez-González, A. Macías-García, M. F. Alexandre-Franco and V. Gómez-Serrano, Carbon, 2005, 43, 741–747, DOI:10.1016/j.carbon.2004.10.045.
- M. Schwan and L. Ratke, C, 2016, 2, 22, DOI:10.3390/c2030022.
- R. W. Pekala, J. Mater. Sci., 1989, 24, 3221–3227, DOI:10.1007/BF01139044.
- D. Platzer, M. Sc, University of Stuttgart, 2020, https://elib.dlr.de/140258/.
- H. Grünewald, in CRC Handbook of Chemistry and Physics, ed. R. C. Weast, S. M. Selby and C. D. Hodgman, CRC Press, Ohio, 1974 DOI:10.1002/ange.19660781827.
- T. Tsuchiya, T. Mori, S. Iwamura, I. Ogino and S. R. Mukai, Carbon, 2014, 76, 240–249, DOI:10.1016/j.carbon.2014.04.074.
- A. Rezaei, B. Kamali and A. R. Kamali, Measurement, 2020, 150, 107087, DOI:10.1016/j.measurement.2019.107087.
- L. J. Kennedy, J. J. Vijaya and G. Sekaran, Mater. Chem. Phys., 2005, 91, 471–476, DOI:10.1016/j.matchemphys.2004.12.013.
- S. Biniak, A. Swiatkowski, M. Pakula and L. Radovic, Chemistry and Physics of Carbon, Marcel Dekker, New York, 2001, 27, 125–225, https://silo.pub/chemistry-and-physics-of-carbon-volume-27-a-series-of-advances.html Search PubMed.
- A. C. Ferrari and J. Robertson, Phys. Rev. B: Condens. Matter Mater. Phys., 2000, 61, 14095–14107, DOI:10.1103/PhysRevB.61.14095.
- J.-S. Roh, Carbon Lett., 2008, 9, 127–130, DOI:10.5714/CL.2008.9.2.127.
- G. Raptopoulos, M. Papastergiou, D. Chriti, E. Effraimopoulou, T. Čendak, N. Samartzis, G. Mali, T. Ioannides, P. Gurikov, I. Smirnova and P. Paraskevopoulou, Mater. Adv., 2021, 2, 2684–2699, 10.1039/D0MA01025A.
- C. Jiang, G. A. Yakaboylu, T. Yumak, J. W. Zondlo, E. M. Sabolsky and J. Wang, Renewable Energy, 2020, 155, 38–52, DOI:10.1016/j.renene.2020.03.111.
- K.-J. Euler, J. Power Sources, 1978, 3, 117–136, DOI:10.1016/0378-7753(78)80011-1.
- I. Balberg, C. H. Anderson, S. Alexander and N. Wagner, Phys. Rev. B: Condens. Matter Mater. Phys., 1984, 30, 3933–3943, DOI:10.1103/PhysRevB.30.3933.
- J. Li, P. C. Ma, W. S. Chow, C. K. To, B. Z. Tang and J.-K. Kim, Adv. Funct. Mater., 2007, 17, 3207–3215, DOI:10.1002/adfm.200700065.
| This journal is © The Royal Society of Chemistry 2024 |

