DOI:
10.1039/D4MA00779D
(Paper)
Mater. Adv., 2024,
5, 8546-8563
Synthesis of pumice and medical waste incinerator fly ash based phosphate geopolymers for methylene blue dye adsorption: co-valorization, parameters and mechanism†
Received
2nd August 2024
, Accepted 26th September 2024
First published on 8th October 2024
Abstract
In this study, four geopolymer composites, GP-0, GP-10, GP-20 and GP-30, were synthesized from pumice, an abundant and inexpensive volcanic rock precursor, substituted with fractions of 0, 10, 20 and 30% by weight of medical waste incinerator fly ash (MWI-FA), respectively. The materials were characterized by standard methods (FTIR, XRF, BET surface area measurement, XRD, SEM-EDX and TGA). The materials were morphologically distinct and the specific surface areas (SSA) decreased with an increase in MWI-FA fraction. The adsorption performances of the geocomposites were evaluated in batch mode for the removal of methylene blue (MB), a toxic dye, from water. The study determined that the dye was optimally removed at circumneutral pH, 303 K temperature, 0.6 g/40 mL adsorbent dosage and 30 min contact time. The equilibrium data were best described using the Sips isotherm model. The geopolymers had ∼30 times higher adsorption capacities than pristine pumice. The maximum adsorption capacities of the geopolymers, ∼31 mg g−1, were indistinguishable despite an increase in MWI-FA indicating that MWI-FA provided new energetically favorable adsorption sites compensating diminished SSA. The adsorption kinetics was best described using the pseudo-second order kinetic model wherein the rate constant (K2) increased with the MWI-FA fraction suggesting porosity structures with reduced tortuosity. Thermodynamically, the adsorption process was exothermic (ΔH < 0), physical (ΔH and Ea < 40 kJ mol−1) spontaneous (ΔG < 0) and enthalpy-driven. Adsorption diminished in a saline environment. The exhausted adsorbent was recoverable and recycled twice using hot water before significant loss of adsorption potential. The composite geopolymers present a plausible strategy for stabilization of up to 30% MWI-FA without compromising the adsorptive properties for dye removal from water.
1. Introduction
Adsorption technology is a scientific technique that has been used to selectively capture toxic and undesirable molecules from various environmental matrices. It has been applied in water treatment, air pollution control, industrial gas purification and in the food industry for purification among other uses.1 Geopolymers are green inorganic polymers of aluminosilicate constituents with characteristic semi-crystalline or amorphous form in a three-dimensional frame.2 They are conventionally formed by alkalination of aluminosilicates of geological or industrial origin but have also in the recent past seen the use of phosphoric acid activators.3,4 Common alkali activators in geopolymerization include NaOH, KOH, Na2SiO3 and K2SiO3. While geopolymers have various applications, recent studies have demonstrated that geopolymers are low-cost and efficient adsorbents for the removal of various contaminants such as heavy metals and dyes from water owing to the abundance of precursor materials available for their synthesis.5 In addition, geopolymers have been applied in the encapsulation and immobilization of toxic and radioactive waste as a waste management approach.6,7 Common aluminosilicate materials used in the synthesis of geopolymers are clays such as metakaolin,8 fly ash,9 volcanic ash,10,11 slag,12 pumice,13 red mud,14 solid waste incinerator fly ash15 and laterite.4 Although sodium silicate has been widely used in alkaline activation, it has been reported that its industrial production is energy-intensive with concomitant high CO2 emissions.16 Acid activators are alternative low-energy activators with a relatively low-carbon footprint. The type of aluminosilicate source, concentration and type of activator solution, curing temperature and time, and solid to liquid ratio among other factors affect the properties of the geopolymer formed.11,17–21 Alkali activated geopolymers have been found to exhibit higher surface areas and are consequently better sorbents for dye removal than their phosphoric acid activated counterparts under similar conditions.11,22 Silico-aluminophosphates (SAPs) have been used in adsorption because of their appreciable adsorption capacities, and with leaching merits comparable to or which exceed those of alkali-aluminosilicates (AAS). In particular, SAPs have been found useful in the adsorption of methylene blue (MB) from water.17 Strategies to ameliorate the textural and adsorptive properties of acid-activated geopolymers should be explored. Several adjuvants have been reported in the synthesis of geopolymers to improve both textural and adsorptive characteristics. Alginate was used as an additive in the removal of Pb2+ ions from aqueous solutions using a SAP geopolymer–alginate composite.23 The resulting SAP geopolymer–alginate composite beads were found to have an adsorption capacity of 0.183 mol g−1. However, the effect of alginate on the textural and adsorptive properties was not quantified. The incorporation of rice husk ash (RHA) in a laterite based geopolymer was found to improve the microporosity of the composite geopolymer.4 In the study, RHA was found to increase the percentage of amorphous phases with no formation of new mineral phases. As a result, the incorporation of RHA in the geopolymer was found to significantly increase its adsorption capacity for malachite green (MG) dye. A 5% RHA incorporation in the composite led to the highest maximum adsorption capacity of 112.7 mg g−1. However, the adsorption rate did not follow any logical sequence suggesting a tradeoff between textural properties and functional group density. It has been reported that increased surface area of geopolymers resulting from adjuvants does not necessarily lead to increased adsorption capacity.10 In the study, the structural and adsorptive effect of metakaolin (MK) additive on a volcanic ash (VA) based geopolymer was investigated. The specific surface areas of the composite geopolymers increased with MK content. However, the sorption capacities of the geopolymers were found to be independent of its composition. Nevertheless, the study demonstrated that the adjuvant improved the adsorption kinetics of the geopolymer. A high adsorbent adsorption rate is an important adsorbent selection quality since it determines the residence time of the geopolymer.10 Recent studies have shown that solidification of 5% waste tyre ash (TA) in a geopolymer matrix increased the specific surface area (SSA) of the pristine geopolymer from 13.62 to 21.48 m2 g−1 with a maximum adsorption capacity of 46.69 and 107.69 mg g−1 for sulfamethoxazole and sulfadimethoxine antibiotics, respectively. Above 5% TA, the adsorption was diminished.22 Similarly, stabilization of 7.5% waste charcoal powder (CP) in pozzolan-based geopolymers resulted in a geopolymer composite with an ultrahigh adsorption capacity of 2803 mg g−1 for crystal violet (CV) dye.24 Other composites with different percent CP had lower adsorption capacities. Geopolymerization is therefore a suitable approach for stabilization of toxic wastes with concomitant improvement of textural properties suited for application in adsorption of water pollutants depending on the type and fraction of the waste. The synergetic or antagonistic effect of MWI-FA on the textural, structural and adsorptive properties of pumice based geopolymers has not been documented and cannot be determined a priori. Furthermore, SAP geopolymers have a strong stabilizing effect on Pb2+ and are much better than alkali aluminosilicates in this regard.25 Medical waste incinerator fly ash (MWI-FA) is a toxic waste with unresolved disposal challenges and is currently disposed of in landfills. This traditional disposal method may lead to secondary pollution through its toxic leachate, mainly heavy metals.26 In addition, MWI-FA contains varied quantities of alumina and silica, but this is dependent on the composition of the waste incinerated. Therefore, its use as a geopolymer additive could offer the dual benefit of wastewater reclamation and safe toxic waste disposal. The effect of MWI-FA fraction by mass on the textural, compositional, structural and adsorptive performance of the pumice-based acid-activated geopolymers for methylene blue (MB) dye removal is unknown. Methylene blue is selected for its widespread use, persistence in the environment, high solubility and known toxicity,27 which makes its removal from wastewater critical. The optimum amount of MWI-FA that could be immobilized in phosphate geopolymers without compromising the adsorptive performance and leachability needs to be determined for optimization of this dual function.
This study reports, for the first time, the solidification of different fractions of MWI-FA in pumice-based phosphate geopolymers for the removal of MB from aqueous solution. The effects of MWI-FA on the textural, structural and adsorptive properties of the geopolymer and the impacts of the environmental conditions (initial concentration, contact time, temperature, pH, salinity and adsorbent dosage) were investigated and are herein reported.
2. Materials and methods
2.1 Materials and reagents
Medical waste incinerator fly ash (MWI-FA) was obtained from the Aga Khan Hospital in Nairobi, Kenya, while pumice was purchased from Naivasha, Kenya. About 250 g of each was crushed and sieved using a 100 μm pore size sieve, and stored in a vacuum desiccator. Analytical grade (85% pure) phosphoric acid (H3PO4), hydrochloric acid (HCl) (31% purity), sodium hydroxide (NaOH) (97% purity) and sodium chloride (NaCl) (98.5% purity) were purchased from Kobian scientific limited, Kenya. Methylene blue dye (99% pure) was purchased from Labnal medical solutions, Kenya.
2.2 Methodology
2.2.1 Geopolymer synthesis.
Pumice and medical waste incinerator fly ash (MWI-FA), the aluminosilicate precursors used for the synthesis of the geopolymer were separately dried at 105 °C and crushed with a ball mill to obtain a powder which was then sieved to obtain a uniform particle size of <100 μm. A solution of 8 M phosphoric acid activator was prepared by dilution with distilled water. The activator solution was stirred at 800 rpm and at a temperature of 40 °C for 30 min to obtain homogeneous mixtures. The solution was left to cool to room temperature for 120 min. Four geopolymer samples, GP-0, GP-10, GP-20 and GP-30 were prepared by replacing 0%, 10%, 20% and 30% w/w of the pumice with medical waste incinerator fly ash, (MWI-FA), respectively. The precursors were mixed with the activator solution at a liquid to solid ratio of 0.75 and shaken for 5 min at 150 rpm to form pastes. The geopolymer pastes were transferred into cylindrical molds, air dried for 24 hours and then cured in an oven at 80 °C for 24 h (FC-1000, AS ONE, Blast Constant-Temperature Drying Oven Robust Type, Hanoi, Vietnam). After 3 days, the geopolymers were immersed in acetone to quench the polycondensation reaction. The geopolymers were then dried at 80 °C for 12 h then ground using a mortar pestle set and sieved through a 100 μm sieve. The samples were stored in a desiccator awaiting use.
2.3 Material characterization
The morphology and microstructure of the geopolymers and the precursors were determined using a scanning electron microscope (SEM) (ZEISS EVO L 15, Zeiss Group, Cologne, Germany) operating at an accelerating voltage of 20 kV, while the percentage elemental composition was determined using energy dispersive X-ray (EDX) detection (Xplore TEM-80 mm2, Oxford, England). The different crystalline phases present in the raw materials and geomaterials obtained were determined via a Bruker D8 X-ray powder diffractometer (XRD) equipped with a Lyn Xeye detector and CuKα radiation. Measurements were carried out for approximately 2 h at a scan rate of 0.03° s−1 using CuKα radiation at 40 kV and 40 mA between 10 and 80° (2θ). The data generated were used for phase identification and quantification through the Rietveld model of the different crystalline phases using Profex 5.2.3. The standard internal method was used for quantification of the amorphous phase. The corundum was used as the standard crystalline phase. Fourier Transform Infrared spectroscopy (FTIR) (Cary 630 FTIR, USA) was used to determine the functional groups. The pH point of zero charge (pHpzc) of the materials was determined using the pH drift method.28,29 To 20 mL of 0.1 M NaCl solutions of pH between 2 and 12, 0.1 g of adsorbent samples were introduced and stirred, then kept at room temperature for 8 h after which the final pH values of the solutions were recorded with a pH meter (VOLTCRAFT PH-100ATC, Voltcraft, Hirschau, Bavaria, Germany). The X-ray fluorescence spectrometry (XRF) method (Bruker-SRS 3400) was used to determine the bulk oxide composition of the precursors while the Brunauer–Emmett–Teller (BET) surface area of each sample was determined by nitrogen sorption on a Micromeritics (Norcross, GA ASAP2010 instrument). Thermogravimetric (TGA) analysis was conducted on HITACHI STA 7300 DTA/TGA equipment with platinum sample crucibles. The samples were heated in nitrogen at a purge rate of 200 mL min−1, at 10 °C min−1.
2.4 Batch adsorption experiments
A 0.1 g sample of each geopolymer was added to 40 mL MB dye solutions with varying initial concentrations (10–60 mg L−1). The mixture was agitated at room temperature (298 ± 1 K) using an orbital shaker until equilibration (120 min). The mixtures were then spun in a centrifuge at 3000 rpm for 30 min. The residual dye concentration in aqueous phase was determined using a UV-vis spectrophotometer (1900i, Shimadzu) at λmax = 664 nm to determine the amount adsorbed. Eqn (1) was used to calculate the amount of dye adsorbed onto the geopolymer at equilibrium while eqn (2) was used to calculate the percentage removal (R) of the dye, where qe is the amount (mg g−1) of dye adsorbed onto the adsorbent at equilibrium, Ci is the initial dye concentration (mg L−1), Ce is the equilibrium dye concentration (mg L−1) in aqueous phase, V is the volume of dye solution (L) and m is the mass (g) of the adsorbent.| |  | (1) |
| |  | (2) |
To determine the effect of contact time, 0.1 g of the geopolymer was added to 40 mL of 40 mg L−1 MB dye solution and shaken in an orbital shaker at room temperature (298 ± 1 K). The aliquots were withdrawn at time intervals of 10, 20, 30, 40, 50 and 60 min and spun in a centrifuge at 3000 rpm for 30 min and the residual dye concentration was determined. The amount (mg g−1) of dye adsorbed at any given time, (qt), was determined using eqn (3).| |  | (3) |
To determine the effect of pH on the adsorption, 0.1 g of the geopolymer was added to 40 mL of 40 mg L−1 MB solution and agitated at room temperature (298 ± 1 K) for 30 min to equilibrium. The initial pH of the solution was adjusted between 2–10 using 0.1 M HCl and 0.1 M NaOH solutions. The pH was determined using a pH meter (Voltcraft, PH-100ATC, AJ.51371model, Taiwan). The mixtures were spun until equilibration and the residual MB concentration determined. To determine the effect of temperature, 0.1 g of each geopolymer was added to 40 mL of 40 mg L−1 MB solution. The temperature was varied within a range of 283 to 323 K with a 10 K step while agitating for 30 min and the residual MB concentration was determined. To determine the effect of adsorbent dosage, 0.1–0.6 g of the geopolymer were added to 40 mL of 40 mg L−1 MB solution and agitated at room temperature (298 ± 1 K) for 30 min and residual MB concentration was determined. To determine the effect of salinity, MB solutions were prepared in saline water (0.005 M NaCl solution). Here, 0.1 g of each geopolymer was added to 40 mL of 10–60 mg L−1 MB solutions prepared in the saline water and the mixture agitated to equilibrium and residual MB concentration determined.
2.5 Desorption of methylene blue
Spent geopolymers GP-0, GP-10, GP-20 and GP-30 were recycled by treating the geopolymers with distilled water at 80 °C for 3 h using a solid to liquid ratio of 10. The mixtures were spun in a centrifuge at 3000 rpm for 30 min and filtered to recover the regenerated geopolymers. The recycled solid geopolymers were oven dried at 80 °C for 24 h. The four samples were renamed GPR-0, GPR-10, GPR-20 and GPR-30 respectively. Again, 0.1 g of each recovered geopolymer was added to 40 mL of 40 mg L−1 solution of MB dye and agitated at room temperature (298 ± 1 K) for 30 min and the residual dye measured. This recovery cycle was repeated four times.
3. Results and discussion
3.1 Characterization studies
3.1.1 Elemental composition analysis.
The chemical composition of MWI-FA and pumice based on XRF analyses is summarized in Table 1. The loss on ignition (LOI) of 34.73 wt% in MWI-FA confirms the partial carbonation of organic species present after thermal treatment.
Table 1 Chemical composition analysis
| Oxide (wt%) |
Na2O |
K2O |
Al2O3 |
SiO2 |
CaO |
MgO |
Fe2O3 |
SO3 |
P2O5 |
TiO2 |
MnO |
ZrO2 |
LOI |
| LOI – loss on ignition. ND – not detected. |
| MWI-FA |
1.0 |
0.1 |
2.4 |
5.5 |
52.0 |
2.0 |
1.0 |
0.4 |
0.1 |
0.2 |
ND |
ND |
34.7 |
| Pumice |
1.1 |
5.4 |
8.8 |
76.9 |
0.4 |
ND |
7.1 |
0.1 |
0.0 |
0.1 |
0.1 |
0.1 |
ND |
The main oxides present in pumice that are essential for geopolymer formation are 76.9% SiO2 and 8.8% Al2O3 while the essential elements in the MWI-FA are 5.5% SiO2 and 2.4% Al2O3. The precursors were therefore judged appropriate for geopolymer formation. It is worth noting that oxides of toxic heavy metals were not detected, indicating less toxic metal oxides required immobilization in the geopolymer composites. However, the presence of MgO (2.0%) and CaO (52.0%) in such significant quantities in MWI-FA present a high chance of introducing Mg2+ and Ca2+ responsible for water hardness. Stabilization of these cations during composite geopolymer formation is therefore critical. Some heavy metal cations like Pb2+ have been reported to be strongly stabilized during silico-aluminophosphate formation.25
3.1.2 Functional group identification.
Fig. 1 shows the FTIR spectra of both precursors and the geopolymers. Adsorption bands characteristic of OH and H–O–H were recorded in the range 3439–3584 cm−1 and 1637–1793 cm−1 respectively. In pumice, a key band was observed at 1043 cm−1 corresponding to the asymmetric stretching of Si–O–T (T-tetrahedral Al or Si) bonds30 necessary for geopolymer formation. Another important band was observed at 460 cm−1 corresponding to a Si–O–Fe bond vibration.31 In MWI-FA, a significant band was observed at 1014 cm−1 corresponding to asymmetric stretching of Si–O–T (T-tetrahedral Al or Si) bonds with other important peaks at 469 cm−1 (Si–O–Fe vibrations).
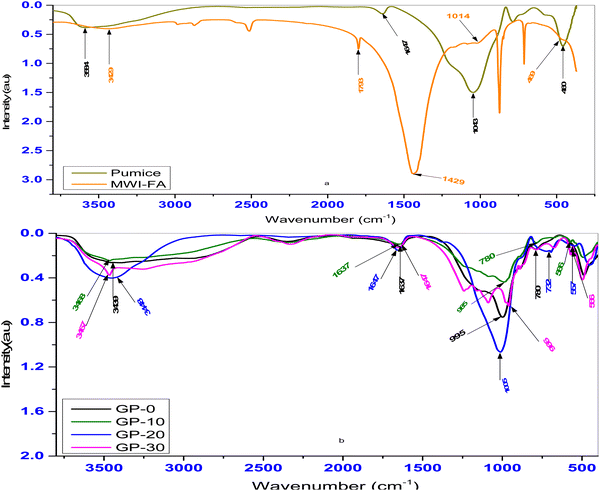 |
| | Fig. 1 FTIR spectra of (a) the precursors (pumice and MWI-FA) and (b) the geopolymers GP-0, GP-10, GP-20 and GP-30. | |
During geopolymerization, there is breaking and formation of bonds responsible for the variations in the position of the main bands.32 Comparing the FTIR spectrum of the precursors and that of the resulting geopolymers, a shift of the Si–O–T band to lower wavenumbers (966–1005 cm−1) is observed. The lower wavenumbers correspond to Si–O–P–O–T,30 and confirm the participation of the Si–O–T bond in the formation of the geopolymers. Some shoulder peaks were also observed in the range 732–790 cm−1 for all the geopolymers. This corresponds to the Si–O–P asymmetric stretching vibrations.33 In addition, bands corresponding to Al–O–P34 were recorded in the range 557–566 cm−1 for the composite geopolymers and not the pristine pumice geopolymer. This confirms the participation of MWI-FA in the creation of these bonds. These results are consistent with XRD data which identified the crystalline aluminium phosphate monohydrate in the geopolymers (Table 3).
3.1.3 Morphological and compositional analyses.
The morphological and structural analysis of the geopolymer of pristine pumice GP-0 and that of a representative composite GP-20 obtained from SEM images are shown in Fig. 2.
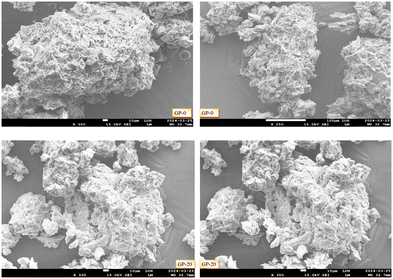 |
| | Fig. 2 SEM images of GP-0 and GP-20. | |
The surfaces of GP-0 and GP-20 as seen in the SEM images were morphologically different. The spongy and gel-like morphology was more elaborate in GP-20 than in GP-0 suggesting the role of MWI-FA in the variation of the surface morphology of the composite geopolymers. The elemental composition analysis was conducted using energy dispersive X-ray spectroscopy (EDS) microanalysis. The major elements detected in the geopolymers were O, Al, Si, Ca, Fe, Au and K. In addition, P of the activator solution was also detected. Detailed results of the elemental composition analysis are presented in Table 2.
Table 2 Elemental composition analysis of GP-0 and GP-20
| % |
O |
Na |
Al |
Si |
Ca |
Fe |
Au |
Mg |
P |
K |
| N/D not detected. |
| GP-0 |
64.67 |
N/D |
3.47 |
22.05 |
N/D |
2.51 |
3.16 |
N/D |
1.34 |
2.80 |
| GP-20 |
44.72 |
N/D |
2.72 |
21.50 |
6.90 |
2.17 |
10.56 |
N/D |
10.21 |
1.22 |
3.1.4 Crystallinity and mineralogical studies.
Fig. 3 shows the XRD diffractograms of precursors used in the synthesis of the geopolymers and Table 3 depicts the result of the quantification of crystalline and amorphous phases in the raw materials and geopolymers. The results of peak indexing and quantification show that the pumice consists of microline (3.24%), muscovite (1.54%), albite (2.11%), feldspar (2.22%), quartz (0.30%) and 90.59% amorphous phase. MWI-FA contains calcite (72.6%), halite (0.99%), enstatite (2.53%), mayenite (6.89%), quartz (0.40%) and 22.81% amorphous phase. These results corroborate the diffractograms overview, which displays a large hump between 10 and 40° (2θ) on the pumice diffractogram, confirming the preponderance of the amorphous phase.
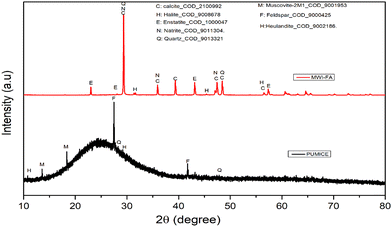 |
| | Fig. 3 XRD diffractogram of MWI-FA and pumice. | |
Table 3 Results of Rietveld analysis of raw materials and phosphate geopolymer adsorbents using Profex 5.2.3
|
|
PUMICE |
MWI-FA |
GP-0 |
GP-10 |
GP-20 |
GP-30 |
| Calcite_COD_2100992 |
— |
72.58 |
— |
0.13 |
0.11 |
0.18 |
| Halite_COD_9008678 |
— |
0.99 |
— |
0.16 |
0.39 |
0.25 |
| Enstatite_COD_1000047 |
— |
2.53 |
— |
0.97 |
0.80 |
1.77 |
| Mayenite_COD_9011737 |
— |
0.69 |
— |
1.40 |
2.89 |
3.55 |
| Quartz_COD_9013321 |
0.30 |
0.40 |
0.20 |
0.27 |
0.48 |
0.74 |
| Microline 9000701 |
3.24 |
— |
2.25 |
3.45 |
2.99 |
2.84 |
| Muscovite-2M1_COD_9001953 |
1.54 |
— |
0.12 |
1.13 |
1.25 |
1.30 |
| Feldspar_COD_9000425 |
2.22 |
— |
0.78 |
0.37 |
0.50 |
0.13 |
| Albite_COD_9003701 |
2.11 |
— |
0.97 |
1.76 |
2.14 |
1.80 |
| Tobermorite_COD_9005499 |
— |
— |
0.34 |
2.41 |
3.64 |
4.44 |
| Aluminiumphosphate COD_2012413 |
— |
— |
0.51 |
1.62 |
2.49 |
3.70 |
| Heulandite_COD_9012215 |
— |
— |
1.18 |
5.45 |
7.43 |
9.87 |
| Amorphous |
90.59 |
22.81 |
93.00 |
80.88 |
74.90 |
69.43 |
Fig. 4 displays the XRD patterns of geopolymers without MWI-FA (GP-0) and with MWI-FA (GP-10, GP-20 and GP-30) MWI-FA. By comparing the diffractogram of the pumice with that of the GP0, a quasi-disappearance of the peaks initially present on the precursor pattern is observed. This justifies their good dissolution in an acid medium. However, new peaks appear at 7.45 and 24.13°, characterizing the formation of tobermorite. This formation is the result of the precipitation of calcium and silicate ions generated during the dissolution of the amorphous and crystalline phases by the acid. It is also observed that the intensity and quantity of this new phase increase with the incorporation of MWI-FA. This is evident because the dissolution of MWI-FA produces calcium and silicate ions in the geopolymer matrix. This same formation has been reported in the literature during the synthesis of a geopolymer based on a mixture of municipal solid waste incinerator fly ash and volcanic slag.21,30 The formation of heulandite is marked by the appearance of peaks at 9.96, 22.80 and 50.80°. This formation also reveals the precipitation of silicate and aluminate ions. The formation of these two new phases, particularly tobermorite,21 is beneficial for the fixation of cationic ions. Also noted is the formation of an aluminophosphate phase commonly observed during the activation of geopolymerization precursors in an acid medium.33Table 3 shows that the quantity of amorphous phase increases by approximately 2% after activation of the pumice, confirming the partial dissolution of the minerals contained in the pumice. However, when MWI-FA is incorporated, the quantity of amorphous phase decreases proportionally with the rate of incorporation. This situation is obvious because the incorporation of MWI-FA into the pumice consists of substituting a more amorphous material with another that is less amorphous. The appearance of peaks of the minerals contained in MWI-FA on the diffractograms of geopolymers with MWI-FA added reveals the weak dissolution of the latter in an acid medium.
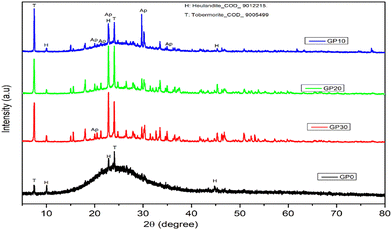 |
| | Fig. 4 XRD diffractogram of geopolymers. | |
3.1.5 pH point of zero charge (pHpzc).
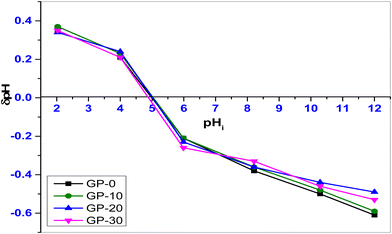
The pHpzc is the average pH value of the adsorbent in the NaCl electrolyte. It is the pH at which the surface of a material has net zero charge.
The point of zero charge of the geopolymers was determined using the drift method. Fig. 5 shows the point of zero charge for the geopolymers GP-0, GP-10, GP-20 and GP-30. The geopolymers had a pHpzc of 5.00, 5.03, 5.00 and 4.86, respectively. At pH 5, the surface of GP-20, for instance, was electrically neutral. It is worth noting that the pHpzc of the composite geopolymers was invariable with an increase in the percentage composition of MWI-FA. In the design of an adsorbent, knowledge of the surface chemistry is important for understanding its adsorption mechanism.
 |
| | Fig. 5 pH point of zero charge of GP-0, GP-10, GP-20 and GP-30. | |
3.1.6 Thermogravimetric analysis.
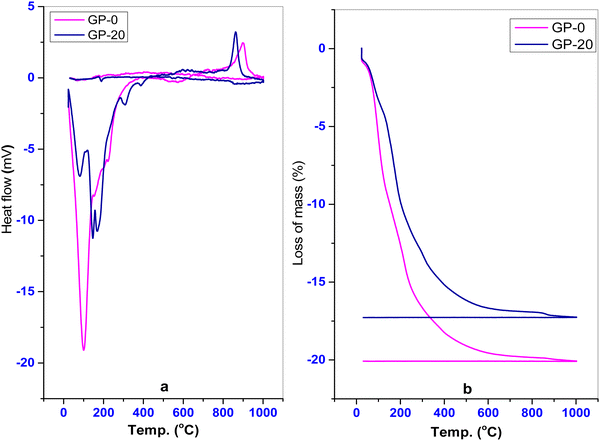
TGA/DTA analysis is applied to synthesized geopolymers and their precursors to study their thermal behaviors and physicochemical changes through the exothermic and endothermic effects in addition to the loss of mass as a result of the loss of structural and external molecules. Fig. 6a and b show the thermal behavior of the pristine geopolymer GP-0 and a representative composite geopolymer, GP-20.
 |
| | Fig. 6 (a) Differential thermal analysis, DTA and (b) thermogravimetric analysis, TGA of GP-0 and GP-20. | |
Fig. 6a shows nearly the same curves. The incongruence of the curves for GP-0 and GP-20 is a result of structural differences emanating from the incorporation of MWI-FA. GP-0 shows a total mass loss of 20.09% occurring in two main zones in the region between 22 °C and 640 °C. A similar behavior is observed for GP-20 which shows a total mass loss of 17.22% with the loss occurring in three main zones in the region between 22 °C and 433 °C. This difference suggests that some chemical or structural changes occur in the geopolymer as a result of the incorporation of MWI-FA. The mass loss zones correspond to endothermic reactions and the zone between 20 °C and 146 °C corresponds to dehydration of hygroscopic and structural waters.4 The reduction of mass loss for the pumice based geopolymer GP-20 sample is mainly due to a smaller effect of the dehydration. This suggests that GP-0 contains a high amount of structural water compared to GP-20. This is possibly a result of the restructuring of more amorphous phases following the incorporation of MWI-FA in the polymerization. A small endothermic peak was also detected at 312 °C for GP-20, revealing the amorphization of the aluminophosphate crystallized phases. Furthermore, the mass loss at 389 °C can be attributed to the conversion of Si–O–P–O–T gel into phosphocristobalite and phosphotridymite.11 The exothermic reaction between 800 and 1000 °C is related to some recrystallization to form, for example, a defective aluminum–silicon spinel, also called a gamma-alumina type structure.35 Beyond 1000 °C (Fig. 6(b)), the sample weights remain constant indicating that no process could lead to further loss of structural or external molecules beyond this temperature.
3.1.7 Specific surface area analysis.
Surface area is a quintessential physical property that significantly affects the performance of an adsorbing material. The specific surface area (SSA) of the materials is summarized in Table 4. Geopolymerization with 10% MWI-FA increased the SSA approximately by 4 orders. However, the surface area of the geopolymers significantly reduced with an increase in MWI-FA composition beyond 10%. This could be detrimental for textural property dependent adsorption processes.
Table 4 BET surface areas of adsorbents
| Material |
MWI-FA |
Pumice |
GP-10 |
GP-20 |
GP-30 |
| BET surface area (m2 g−1) |
4.84 |
5.27 |
22.79 |
9.03 |
6.44 |
3.2 Adsorption studies
3.2.1 Effect of contact time.
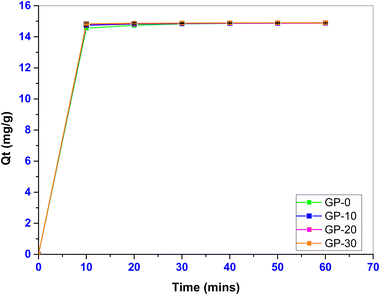
Fig. 7 shows the variation of the adsorption capacities of the geopolymers with time.
 |
| | Fig. 7 Effect of contact time on the adsorption capacity. | |
The adsorption time was varied between 10 and 60 min. The adsorption capacity of the geopolymers increased significantly (p ≤ 0.05) with an increase in MWI-FA content. Fast sorption kinetics were noted within the first 30 minutes followed by a pseudo-equilibration after 30 minutes due to the reduction of free active adsorption sites forcing the dye molecules to traverse farther into the adsorbent pores. The geopolymers presented a removal efficiency in the range of 91.00 to 93.15% over the studied time period. A faster attainment of the equilibrium time implies lower operational costs of an adsorbent making it ideal for industrial scale application.36
3.2.2 The adsorption kinetics.
The time-dependent data were fitted to pseudo-first order, (PFO), pseudo-second order, (PSO) and the intra-particle diffusion (IPD) kinetic models to probe the adsorption rate, order of the adsorption reaction and the nature of the rate-controlling step of the adsorption.37 The performance of the models was determined by the coefficient of determination (R2) and the residual between the model predicted (qcalc) and the experimental (qexp) equilibrium adsorption capacities.
The Lagergren pseudo-first-order (PFO) kinetic model38 is given by eqn (4), where qe is the amount of adsorbate (mg g−1) adsorbed at equilibrium, qt is the amount of adsorbate (mg g−1) adsorbed at time t and k1 (min−1) is the PFO equilibrium rate constant.
| | qt = qe(1 − ![[small script l]](https://www.rsc.org/images/entities/char_e146.gif) −k1t) −k1t) | (4) |
The initial adsorption rate,
Srate, and adsorption half-life,
t1/2, were calculated using
eqn (5) and (6), respectively.
| |  | (6) |
The pseudo-second order (PSO) kinetic model
39 is given in
eqn (7), where
k2 is the PSO rate constant (g mg
−1 min
−1). The initial sorption rate (
Srate) and the adsorption half-life (
t1/2) for PSO were obtained from
eqn (8) and (9). respectively.
| |  | (7) |
| |  | (9) |
To identify the diffusion mechanism in the adsorption, an intra-particle mass transfer diffusion model was used. The intra-particle diffusion (IPD) model
40 is given by
eqn (10) where
Kd (mg g
−1 min
−1/2) is the intra-particle diffusion rate,
C (mg g
−1) is the rate constant, and provides information on the thickness of the boundary layer, and
qt (mg g
−1) is the amount of adsorbate adsorbed at time
t.
The IPD model is useful in predicting the rate-limiting step in the adsorption of MB. Furthermore, if the plot of
qt against
t0.5 is linear, then diffusion occurs through the pores of the adsorbent. If the plot passes through the origin, then intra-particle diffusion is the only rate limiting step. It is worth noting that if
C is positive, there is a boundary layer effect whereas a negative
C value implies that the boundary layer has no effect on the rate of the adsorption. Large
C values imply that the surface of the adsorbent contributes much to the adsorption process.
41,42
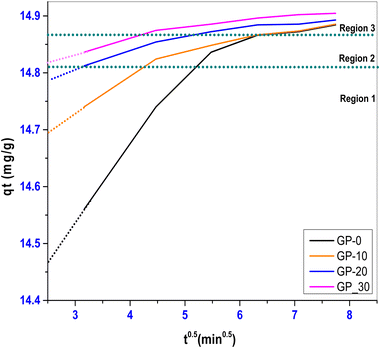
The PFO and PSO plots are shown in Fig. S1 and S2 (ESI†). Fig. 8 shows Webber and Morris intra-particle diffusion plots.
 |
| | Fig. 8 Webber and Morris intra-particle diffusion plots for GP-0, GP-10, GP-20 and GP-30. | |
The adsorption of MB showed multilinear plots. The nonlinearity indicates that multiple processes limited the adsorption rate.43 The rate limiting steps were grouped into three multilinear regions in the adsorption process. Region 1 exhibited a rapid increase in the adsorption capacity due to the availability of more adsorption sites on the adsorbent surface. In region 2, the MB adsorption rate was lower due to the saturation of the active sites whereas in region 3, the adsorption pseudo-equilibrium was attained.44 Furthermore, the plots did not pass through the origin as shown by the extrapolated regions, a clear indication that intra-particle diffusion was not the only rate-limiting step. Because of the larger positive value of the rate constant, it is concluded that the surface of the adsorbent played a major role in the adsorption process.
The kinetic model parameters are summarized in Table 5. The best fitting kinetic model was determined by the coefficient of determination (R2) values and by comparing the model predicted equilibrium adsorption capacities with the respective experimental values. Both the PFO and the IPD had lower R2 values relative to the PSO (R2 > 0.99).
Table 5 Parameters for PFO, PSO and IPD kinetic models
| Model |
Parameter |
GP-0 |
GP-10 |
GP-20 |
GP-30 |
| PFO |
k
1 (min−1) |
0.40 |
0.48 |
0.54 |
0.56 |
|
S
rate (mg g−1 min−1) |
5.87 |
7.16 |
8.06 |
8.30 |
|
t
1/2 (min) |
1.75 |
1.44 |
1.28 |
1.24 |
|
q
exp
|
14.84 |
14.85 |
14.87 |
14.89 |
|
q
calc
|
14.84 |
14.86 |
14.88 |
14.89 |
|
R
2
|
0.80 |
0.80 |
0.75 |
0.76 |
|
|
| PSO |
K
2 (g mg−1 min−1) |
0.24 |
0.58 |
1.05 |
1.23 |
|
S
rate (mg g−1 min−1) |
54.52 |
129.67 |
234.11 |
274.14 |
|
t
1/2 (min) |
0.27 |
0.12 |
0.06 |
0.05 |
|
q
exp
|
14.84 |
14.85 |
14.87 |
14.89 |
|
q
calc
|
14.82 |
14.85 |
14.87 |
14.89 |
|
R
2
|
0.99 |
0.99 |
0.99 |
0.99 |
|
|
| IPD |
K
d (mg g−1 min−1/2) |
0.07 |
0.03 |
0.02 |
0.0143 |
|
C (mg g−1) |
14.40 |
14.67 |
14.77 |
14.80 |
|
q
exp
|
14.84 |
14.85 |
14.87 |
14.89 |
|
q
calc
|
14.78 |
14.83 |
14.86 |
14.88 |
|
R
2
|
0.82 |
0.86 |
0.88 |
0.88 |
The adsorption kinetics was therefore best described using the PSO kinetic model which hypothesizes that the rate determining step is a chemisorption mechanism.45 The half-life (t1/2) is the time taken for half the quantity of MB dye to be adsorbed onto the adsorbent, and is an indicator of the reaction rate. The geopolymers depicted distinct half-lives of 0.27, 0.12, 0.06 and 0.05 minutes for GP-0, GP-10, GP-20 and GP-30 respectively, affirming that the MWI-FA additive significantly improved the adsorption kinetics. The adsorption rate constant, K2, also increased with increasing MWI-FA content, a clear indication of the effect of the adjuvant on some morphological and structural properties of the geopolymers. Since the materials are morphologically distinguishable, it is conceivable that the increase in MWI-FA potentially produced porosity structures that reduce tortuosity or create new pathways for the adsorbate to quickly access the adsorption sites. Adsorption rate is an important criterion for the design and selection of an adsorbent since it determines the residence time of the adsorbent.10 The solidification of up to 30% of MWI-FA in the geopolymer matrix with minimal effect on the adsorption capacity of the geopolymer was therefore possible, with a significant improvement in the adsorption rate. This effect was further corroborated by the initial sorption rate, Srate, with GP-30 showing the highest initial sorption rate of 274.14 mg g−1 min−1.
3.2.3 Effect of adsorbent dosage.
The effect of adsorbent dosage on a 40 mg L−1 MB solution was determined by varying the adsorbent mass between 0.1 g and 0.6 g. Fig. 9 shows the effect of adsorbent dosage both on the percentage removal and the removal capacity (mg g−1) of MB.
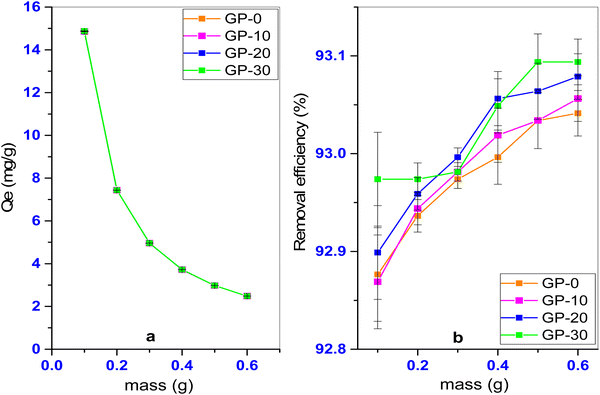 |
| | Fig. 9 Effect of adsorbent dosage on (a) adsorption capacity and (b) removal efficiency (%). | |
It was observed that the percentage removal of MB increased with increasing adsorbent dosage whereas the adsorption capacity reduced with increasing adsorbent mass. The increase in percentage removal is attributed to the increased number of available active sites on the adsorbent, whereas the decrease in the adsorption capacity can be linked to agglomeration of adsorption sites limiting accessibility. A similar observation was made in a study of the removal of the cationic malachite green (MG) dye using laterite-rice husk ash based geopolymers.4
3.2.4 Effect of pH and adsorption mechanism.
The effect of pH on the adsorption of MB onto the geopolymers was studied in the pH range 2–10. Generally, increased pH resulted in increased adsorption capacity of the geopolymers (Fig. 10). A good adsorbent should be efficient over a wide range of pH. The geopolymers did not show a wide disparity in the adsorption capacity over the pH range studied. For GP-20, for instance, the adsorption capacity varied in the range 14.80–15.16 mg g−1 when the pH was increased from 2 to 10, presenting a removal efficiency in the range 92.5–94.7%. Unfortunately, highly alkaline conditions potentially present environmental challenges associated with the disposal of the treated effluent, calling for pre-discharge treatments such as acid neutralization. Since the maximum adsorption capacities are practically indistinguishable (∼15.1 mg g−1) at these high pH conditions, it is suffice to say that comparable adsorption performance can be attained at the natural effluent pH (7–8) (circumneutral) eliminating the need for pH-adjustment and concomitant pre-discharge treatment.
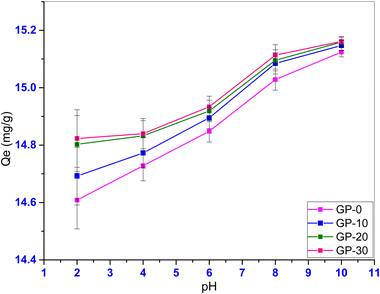 |
| | Fig. 10 Effect of pH on adsorption capacity. | |
At pH conditions below the pHpzc, the surface of the geopolymer attains a net positive charge due to the protonation of the Al–OH and Si–OH sites on the geopolymer as a result of excess protons. These protonated sites create a repulsive effect on the cationic methylene blue dye leading to a comparatively lower adsorption of the dye onto the geopolymer. Similarly, at pH conditions above the pHpzc, deprotonation of the Al–OH and Si–OH sites occur on the geopolymer due to excess hydroxyl ions. The deprotonated sites attract the cationic MB dye leading to an increased adsorption. A similar observation was reported in the removal of MB dye using a phosphate activated volcanic ash based geopolymer,11 and in the removal of methylene blue using an alkaline activated metakaolin based geopolymer.8 As aforementioned, and unlike in previous studies, the dissimilarity in the adsorption capacity with pH was minimal, suitable for practical application. The minimal variation in the adsorption capacity with pH can be a result of the interactions between the residual Cl− and Na+ ions. These ions increase the ionic strength of the solution hence lowering the overall effect of pH. At a pH value above the pHpzc (pH ∼ 5.0), the surface of the geopolymer attains a net negative charge. Adsorption of Na+ ions may occur at these negatively charged sites effectively competing with cationic MB molecules for these sites. Again, at a pH value below pHpzc, the surface of the geopolymer becomes positively charged and may adsorb Cl−. In addition, at lower pH values, there is increased competition between H+ and the cationic MB for the active sites on the geopolymer resulting in decreased adsorption of the dye. The results suggest the role of electrostatic interactions in the mechanism of adsorption of methylene blue dye on to the pumice based geopolymer. It is worth noting that solution pH does not only affect adsorption through surface charge and ionic competitions, but also influences the degree of speciation and ionization of cationic dyes during the adsorption process.46 Other than electrostatic interactions, the hydrogen bonding mechanism of MB adsorption (Fig. 11) is proposed. This results from the intermolecular interaction between the hydrogen of the hydroxyl groups in Al–OH and Si–OH on the adsorbent surface, and the lone pairs of electrons of the electronegative N and S atoms of MB.
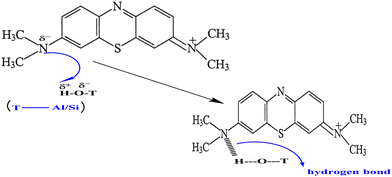 |
| | Fig. 11 Possible hydrogen bonding between MB and the geopolymers. | |
3.2.5 Effect of initial concentration.
Fig. 12 shows the evolution of the geopolymer adsorption capacity with change at the initial concentration. The initial concentration was varied between 10–60 mg L−1.
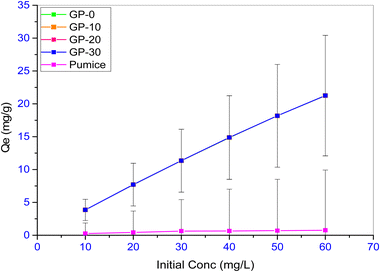 |
| | Fig. 12 Effect of initial concentration on adsorption capacity. | |
All the geopolymers had significantly higher equilibrium adsorption capacities compared to the precursor, pumice. This points to the beneficial nature of geopolymerization in the adsorption of methylene blue. The adsorption capacity of the geopolymers was found to increase linearly and significantly (p ≤ 0.05) with an increase in initial concentration. For instance, the adsorption capacity of GP-20 increased from 3.862 mg g−1 (96.6% removal) to 21.245 mg g−1 (88.5% removal) when the initial dye concentration was increased from 10 to 60 mg L−1. The different geopolymers responded similarly to variation in the initial dye concentration. At low concentrations, most adsorbent sites remain unoccupied due to low interactions between the adsorbent and the adsorbate. Conversely, when the initial MB concentration is increased, the adsorbent–adsorbate interactions increase leading to increased adsorption. Other studies have reported similar observations. The adsorption capacity of MB dye onto a phosphate activated metakaolin-based geopolymer was reported to increase from 0.5 to 2.75 mg g−1 when the initial concentration was increased from 10 to 50 mg L−1.17 Similarly, the adsorption capacity of an alkali activated volcanic ash-metakaolin based geopolymer was reported to increase from 4.8 to 24.1 mg g−1 when the initial concentration of methylene blue dye solution was increased from 10 to 50 mg L−1.10 Furthermore, the initial concentration has been reported to affect adsorption kinetics. Initial dye concentrations above 60 mg L−1 have been reported to be slower due to the need to first overcome the boundary layer effect before diffusing into the pores of the adsorbent.47
3.2.6 Adsorption isotherms.
Adsorption isotherms are useful in describing the adsorbate–adsorbent interactions, and are beneficial in predicting and optimizing the use of adsorbents. Three classical adsorption isotherms were used to describe the adsorption data namely, the Freundlich, Langmuir and Sips isotherms.
Eqn (11) represents the nonlinear Freundlich isotherm,48 which implies a multilayer adsorption onto a heterogeneous surface. The dependent variable qe is the mass of adsorbate adsorbed at equilibrium per unit mass of the adsorbent (mg g−1) and the independent variable Ce is the equilibrium concentration (mg L−1).
The Freundlich equation has two constants.
KF is an empirical constant, the partitioning coefficient (L g
−1), representing the relative adsorption capacity of the adsorbent while
n is the Freundlich exponent. The value 1/
n is the Freundlich adsorption intensity parameter and gives characteristic information about the adsorption process. If 1/
n is less than unity, chemisorption is implied, whereas if 1/
n is more than 1, then cooperative adsorption is implied.
43 Furthermore, 1/
n is an indicator of surface heterogeneity. Values close to 0 indicate a heterogeneous surface while values close to 1 indicate a homogeneous surface. Because of the exponential nature of the equation, it is expected that the
qe value will increase with an increase in adsorbate concentration.
Eqn (12) is a modification of the Freundlich equation and can be used to determine the maximum adsorption capacity, where Ci is the initial solute concentration (mg L−1) and Qm is the Freundlich maximum adsorption capacity (mg g−1).49
The Langmuir monolayer isotherm
50 is given by
eqn (13), where
qe is the mass of the adsorbate adsorbed at equilibrium (mg g
−1),
Ce is the concentration of the adsorbate in aqueous phase at equilibrium (mg L
−1),
Q0 is the monolayer maximum adsorption capacity (mg g
−1) and
KL is the Langmuir constant (L g
−1) related to the free adsorption energy.
KL indicates the level of interaction between the adsorbent and the adsorbate.
| |  | (13) |
The Langmuir equation postulates a single layer adsorption of MB dye onto the adsorbent with no lateral interactions. It assumes a homogeneous adsorbent surface with identical adsorption sites. Lower
KL values indicate weak adsorbent–adsorbate interactions typical of physisorption.
Eqn (14) indicates the nature and feasibility of the Langmuir isotherm using
RL defined as a separation factor.
| |  | (14) |
According to Ofomaja and Ho,
51 0 ≤
RL ≤ 1 indicates that the adsorption process is favourable.
RL = 1 shows a linear process while
RL = 0 indicates an irreversible process.
The Sips isotherm52 is given by eqn (15), where Qe is the mass of adsorbate per unit mass of the adsorbent (mg g−1), Qm is the maximum adsorption capacity of the adsorbent (mg g−1), K is a constant relating to the adsorbate affinity for the adsorbent, Ce is the equilibrium concentration, (mg L−1) and m is the heterogeneity index (0 ≤ m ≤ 1).
| |  | (15) |
The Sips isotherm accounts for both monolayer adsorption and multilayer adsorption. The greater the
m value the more heterogeneous the system is said to be. In contrast, values close to 1 imply a homogeneous adsorbent surface corresponding to the Langmuir equation.
53
Table 6 shows the parameters for the three isotherms namely Freundlich, Langmuir and Sips isotherms. The isotherm plots are presented as Fig. S3–S5 (ESI†). The Freundlich intensity parameter 1/n indicates decreasing surface heterogeneity with increasing MWI-FA content. KF values of the geopolymers were notably much higher than that of the precursor underscoring the benefit of geopolymerization in increasing the affinity for MB dye during the process of adsorption. The increasing KF values indicate that the affinity for MB was dependent on the composition of the geopolymers. The high KF and low 1/n values recorded point to high adsorption throughout the concentration range.54 The small 1/n values (1/n ≤ 0.4854) also indicate strong adsorbent–adsorbate interaction indicative of chemisorption.55 Chemisorption involves the formation of strong chemical bonds between adsorbate and adsorbent involving sharing or transfer of electrons. For this reason, chemisorbed substances are not easy to desorb.56 However, in non-ideal conditions, both physisorption and chemisorption can occur simultaneously or alternatively,1 with adsorption of cationic dyes proceeding mainly through electrostatic interactions.57
Table 6 Adsorption isotherm parameters
| Model |
|
GP-0 |
GP-10 |
GP-20 |
GP-30 |
Pumice |
| Freundlich |
K
F
|
8.56 |
8.65 |
8.67 |
8.66 |
0.10 |
| 1/n |
0.49 |
0.48 |
0.48 |
0.48 |
0.51 |
|
n
|
2.06 |
2.08 |
2.09 |
2.09 |
1.96 |
|
Q
max (mg g−1) |
62.47 |
62.03 |
61.70 |
61.90 |
0.80 |
|
R
2
|
0.98 |
0.98 |
0.98 |
0.98 |
0.92 |
|
|
| Langmuir |
K
L (L g−1) |
0.44 |
0.46 |
0.46 |
0.46 |
0.04 |
|
R
L
|
0.04 |
0.04 |
0.04 |
0.03 |
0.32 |
|
Q
max (mg g−1) |
27.57 |
27.38 |
27.31 |
27.27 |
1.14 |
|
K
a
|
12.20 |
12.48 |
12.54 |
12.65 |
0.04 |
|
R
2
|
0.99 |
0.99 |
0.99 |
0.99 |
0.96 |
|
|
| Sips |
K
|
0.21 |
0.21 |
0.20 |
0.20 |
0.22 |
|
m
|
0.74 |
0.73 |
0.72 |
0.72 |
3.35 |
|
Q
max (mg g−1) |
31.29 |
31.12 |
31.12 |
31.18 |
0.98 |
|
R
2
|
0.99 |
0.99 |
0.99 |
0.99 |
0.96 |
The Langmuir isotherm postulates a monolayer adsorption onto a homogeneous surface with no lateral interactions between the adsorbed molecules. The adsorbent active sites are therefore considered to be identical.58,59 The RL values less than unity indicate a favourable adsorption process dependent on composition. Furthermore, the low KL values observed indicate weak interactions of the adsorbate with the surface of the adsorbent and points to a physisorption process. Comparing the affinity of the geopolymers and that of the precursor, it was noted that the surface affinity of the geopolymers for MB dye was up to 13 orders of magnitude higher than that of the precursors suggesting a much stronger adsorbent–adsorbate interaction resulting from geopolymerization. The apparent equilibrium constant, Ka, derived from the Langmuir isotherm (Table 6), is the product of Qmax and KL and is a measure of the relative affinity of the adsorbent towards the MB molecule.60,61 The Ka values indicate that the affinity of the geopolymers for MB is much higher (∼300 times) than that of pumice. Furthermore, the surface affinity of the geopolymers was noted to marginally increase with MWI-FA content by mass.
The equilibrium data was described by the models in the order Sips > Langmuir > Freundlich isotherms as determined by the coefficient of determination, R2 values and the residual between the experimental and the model-predicted values. The Sips model is suitable for predicting adsorption onto a heterogeneous surface, overcoming the limitation of the Freundlich isotherm in predicting adsorptions involving high adsorbate concentrations.62 Therefore, the Sips isotherm model is able to represent adsorption over a wide concentration range, where the adsorbed adsorbate can occupy more than one binding site. The larger the m values, the more heterogeneous the system is said to be. In contrast, values close to unity suggest a homogeneous adsorption surface. The m values ranged between 0.72 and 0.74 and exhibited a tendency, albeit small, of decreasing with increasing MWI-FA content. Low K values denote low adsorbate affinity for the adsorbent indicative of physisorption. The Sips model-predicted maximum adsorption capacities (Qmax, mg g−1) were in the range of 31.1–31.3 mg g−1 while that of pumice was 0.98 mg g−1. The recorded Qmax value of GP-10 was over 30 orders of magnitude higher than that of the pristine pumice, pointing to the beneficial nature of geopolymerization for the adsorption of MB. The increased adsorption capacity of GP-10 relative to pumice is attributed to high SSA (∼22 m2 g−1) for GP-10 relative to ∼5 m2 g−1 for pumice. However, the SSAs decreased with the addition of MWI-FA beyond 10%. However, this decline did not lead to any significant change in the adsorption capacities of the geopolymers. The adsorption capacities of the geopolymers were indistinguishable showing that MWI-FA had significant effect on the adsorption capacities of the composite geopolymers providing additional energetically favorable adsorption sites compensating for the diminished SSA. The addition of MWI-FA also seemed not to block or shield the active adsorption sites and the sites are accessible for MB adsorption. This finding is in contrast to studies which have reported a direct correlation between surface area and adsorption capacities of modified geopolymers. Pozzolan based geopolymers modified with different fractions of charcoal exhibited increased SSA with increasing charcoal fraction accompanied by an increase in adsorption capacities for crystal violet dye.11 In the adsorption of Cu2+ ions from water by a metakaolin derived geopolymer, a high removal efficiency (∼99%) was reported after the first regeneration of the geopolymer, despite a decline in the surface area from 32.16 m2 g−1 to 16.28 m2 g−1.63 In another study, the adsorption capacity of volcanic ash-metakaolin based geopolymers for methylene blue dye were indistinguishable despite a significant change in the surface area of the geopolymers.10 The incorporation of increasing fractions of metakaolin in volcanic ash-based geopolymers increased the surface area from 3.5 m2 g−1 to 6.7 m2 g−1. However, the adsorption capacities remained considerably invariant at ∼14.0 mg g−1. In the current study, the adsorption capacities of the geopolymers remained unchanged despite the decline in the surface area. It is probable that MWI-FA does not shield the active binding sites in the geopolymers, provides energetically favorable additional sites, and that the smaller pores occupied by MWI-FA do not significantly impact the adsorption process. A tradeoff between the reduced surface area and an improved surface chemistry as a result of evolution of new functional groups and favorable porosity structure is implied.
These results show that the geopolymer composites can be a sink of up to 30% of MWI-FA without affecting the adsorption capacity.
3.2.7 Effect of salinity.
Industrial effluents are normally laden with high salt concentrations necessitating the study of the effect of ionic strength on the adsorption of contaminants. Fig. 13 shows the effect of increased salinity on the adsorption of MB by the geopolymers. In this study, 0.005 M NaCl was used to increase the ionic strength of the adsorbate. It was found that the adsorption capacity of the geopolymers significantly reduced by up to 78.82%. Therefore, adsorption of MB onto the geopolymers is not favorable under saline conditions. This is due to the competition between the cationic dye molecules and the Na+ for the available active sites on the adsorbent.
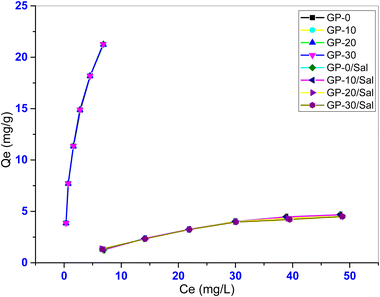 |
| | Fig. 13 Effect of salinity on the adsorption capacity. | |
Other studies have reported similar patterns. The adsorption of malachite green (MG) onto chemically modified breadnut peel was found to be sensitive to changes in KNO3 concentration, reducing the removal of MG by up to 65%.64 Furthermore, smaller cations (K+ or Na+) easily access the active adsorbent sites outcompeting the larger dye molecules. It is also conceivable that the salt ions surround the MB molecules screening the MB molecules from effective interaction with the negative geopolymer framework through electrostatic interactions. Table 7 shows the isotherm model predicted parameters for the geopolymers under the saline conditions.
Table 7 Adsorption isotherm parameters under saline conditions
| Model |
|
GP-0 |
GP-10 |
GP-20 |
GP-30 |
| Freundlich |
K
F
|
0.49 |
0.49 |
0.56 |
0.55 |
| 1/n |
0.60 |
0.60 |
0.56 |
0.55 |
|
N
|
0.17 |
1.68 |
1.80 |
1.81 |
|
Q
max (mg g−1) |
5.67 |
5.64 |
5.41 |
5.32 |
|
R
2
|
0.96 |
0.96 |
0.96 |
0.95 |
|
|
| Langmuir |
K
L (L g−1) |
0.03 |
0.03 |
0.03 |
0.04 |
|
R
L
|
0.37 |
0.36 |
0.32 |
0.32 |
|
Q
max (mg g−1) |
8.31 |
8.21 |
7.44 |
7.27 |
|
K
a
|
0.24 |
0.24 |
0.26 |
0.26 |
|
R
2
|
0.99 |
0.99 |
0.99 |
0.99 |
|
|
| Sips |
K
|
0.09 |
0.09 |
0.07 |
0.08 |
|
M
|
1.88 |
1.83 |
1.38 |
1.59 |
|
Q
max (mg g−1) |
6.92 |
6.89 |
6.76 |
6.45 |
|
R
2
|
0.99 |
0.99 |
0.99 |
0.99 |
The Sips isotherm model best described the adsorption data with the highest coefficient of determination (R2 > 0.99). The model predicted maximum adsorption capacity (Qmax) declined under saline conditions from ∼31.6 mg g−1 to ∼6.5 mg g−1 indicating that the adsorption capacity of the geopolymers was less favourable under such conditions. Again, the adsorption capacities of the geopolymers were undistinguishable underscoring the insignificant effect of its composition under saline conditions. Furthermore, the K values were much lower than those of the corresponding composite geopolymers under non saline conditions. This suggests that under saline conditions, the adsorbent–adsorbate affinity declined.
3.2.8 Effect of temperature.
The effect of solution temperature on the adsorption process is an important factor because it indicates the thermal nature of the adsorption process. In this study, the temperature was varied in the range 303–333 K. Fig. 14 shows the effect of temperature variation on the adsorption capacity of MB onto the geopolymers.
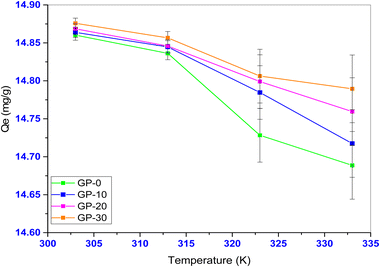 |
| | Fig. 14 Evolution of the adsorption capacity of the geopolymers with temperature. | |
It was observed that the equilibrium adsorption capacity of the geopolymers significantly reduced (p < 0.05) with increase in temperature. This indicates that the studied adsorption was an exothermic process. This observation is attributable to the weakening of the adsorptive forces of the active adsorbent sites and the MB dye particles, and also between the adsorbed dye molecules.65 Similar observations have also been made in the adsorption of MB dye from industrial effluent using polyvinyl alcohol where the adsorption of MB was found to decline with an increase in temperature.66
3.2.9 Thermodynamic studies.
Three thermodynamic functions, that is, enthalpy (ΔH), Gibb's free energy (ΔG) and entropy (ΔS) were calculated using eqn (16)–(19), where Kc is the dimensionless equilibrium constant, Ce is the residual dye concentration (mg L−1), Cads is the dye concentration on the adsorbent at equilibrium (mg g−1), R is the gas constant (R = 8.314 J mol−1 K−1), T is the temperature (K) and Kd is the distribution coefficient (L g−1).| | ΔG = −RT![[thin space (1/6-em)]](https://www.rsc.org/images/entities/char_2009.gif) ln ln![[thin space (1/6-em)]](https://www.rsc.org/images/entities/char_2009.gif) Kc Kc | (16) |
| |  | (17) |
| |  | (19) |
Van’t Hoff plot (S6, ESI†) parameters were used to determine the enthalpy (ΔH) and entropy (ΔS) of reaction for the geopolymers. The calculated thermodynamic parameters are summarized in Table 8. The positive values of ΔS denote increased disorder during the uptake of MB onto the geopolymers. The increasing values of ΔS indicate marginally increasing disorder with increasing MWI-FA content. This disorder may be a result of increased adsorbate–adsorbate interactions and a multilayer adsorption. Negative values of ΔH point to an exothermic adsorption process. ΔH values with magnitudes below 40 kJ mol−1 have been associated with physisorption mechanisms whereas those above 40 kJ mol−1 are associated with chemisorption.67 Therefore, the adsorption of MB dye onto the geopolymers was a physisorption process, corroborating the prediction of the Sips isotherm. Negative values of ΔG are indicative of a thermodynamically spontaneous and favorable process. Since ΔH is negative and ΔS is positive, an increase in T, the absolute temperature, will make the ΔS more positive and consequently ΔG more negative, making the adsorption process more spontaneous. Since the absolute values of ΔH are greater than the absolute values of ΔS, the adsorption of MB onto the geopolymers was enthalpy driven.
Table 8 Thermodynamic parameters (ΔG, ΔH and ΔS)
| Adsorbent |
Temp. (K) |
ΔG (kJ mol−1) |
ΔH (kJ mol−1) |
ΔS (kJ mol−1) |
| GP-0 |
303 |
−16.08 |
−0.56 |
0.05 |
| 313 |
−16.60 |
| 323 |
−17.10 |
| 333 |
−17.62 |
|
|
| GP-10 |
303 |
−16.08 |
−0.45 |
0.05 |
| 313 |
−16.60 |
| 323 |
−17.12 |
| 333 |
−17.63 |
|
|
| GP-20 |
303 |
−16.08 |
−0.34 |
0.05 |
| 313 |
−16.61 |
| 323 |
−17.12 |
| 333 |
−17.64 |
|
|
| GP-30 |
303 |
−16.08 |
−0.28 |
0.05 |
| 313 |
−16.61 |
| 323 |
−17.12 |
| 333 |
−17.65 |
The sticking probability (S*) and the activation energy (Ea) were determined from the experimental data using eqn (20) (modified Arrhenius equation) and (21), where T is the temperature (K) and θ is the surface coverage. By plotting ln(1 − θ) against 1/T (K−1) a straight line was obtained and the values Ea and S* were obtained from the slope and the intercept respectively.
| |  | (20) |
| |  | (21) |
Fig. 15 shows the Arrhenius plot and the parameters used in the determination of the activation energy (
Ea) and the sticking probability (
S*). The activation energies determined from the experimental data for GP-0, GP-10, GP-20 and GP-30 were found to be 4.27, 3.45, 2.64 and 2.23 kJ mol
−1 respectively. This implies that an increase in MWI-FA content lowered the activation energy requirement of the geopolymers. Furthermore, the
Ea values were all lower than 40 kJ mol
−1 further confirming physisorption of MB onto the geopolymers.
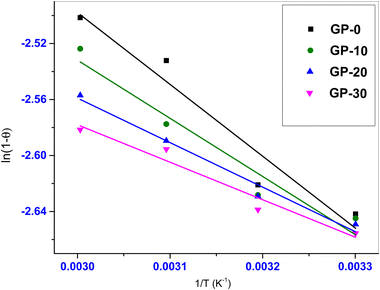 |
| | Fig. 15 Arrhenius type equation plots. | |
The S* values (0 ≤ S* ≤ 1) are indicative of the interactions between the adsorbent and the adsorbate. Values close to zero indicate weak adsorbent–adsorbate interactions whereas those close to unity indicate strong adsorbent–adsorbate interactions. The S* values determined from the experimental data were 0.38, 0.28, 0.20 and 0.17 for GP-0, GP-10, GP-20 and GP-30 respectively. This implies that the interactions between the adsorbent and the adsorbate were generally weak and decreased with an increase in MWI-FA fractions, further confirming that the adsorption of MB dye onto the geopolymers was a physisorption process.
3.2.10 Comparison with other adsorbents.
Table 9 shows the comparative study of the adsorption of MB using the pumice-based geopolymers with other adsorbents reported in some studies.
Table 9 Comparison of the adsorption capacities of the pumice-based geopolymers and other adsorbents for MB
| Adsorbent |
Contact time (min) |
Solution pH |
Initial concentration (mg L−1) |
Q
max (mg g−1) |
Ref. |
| NR (not reported), VA (volcanic Ash), MK (metakaolin). |
| Pumice powder I |
40 |
NR |
30 |
0.442 |
13
|
| Pumice powder II |
40 |
NR |
30 |
1.488 |
13
|
| Pumice (modified with HCl) |
120 |
10 |
50 |
15.87 |
68
|
| VA based geopolymer (alkali activated) |
30 |
NR |
40 |
952 |
11
|
| VA based geopolymer (acid activated) |
30 |
NR |
40 |
22.9 |
11
|
| VA-MK based geopolymers |
30 |
NR |
40 |
14.1 |
10
|
| FA based geopolymer |
120 |
5 |
40 |
37 |
3
|
| FA based geopolymer |
1440 |
NR |
3.2 |
18.3 |
69
|
| MK based geopolymer |
NR |
12.06 |
40 |
43.48 |
8
|
| Biomass FA based geopolymer |
1800 |
NR |
NR |
15.4 |
18
|
| Coal FA based geopolymer |
2880 |
NR |
NR |
50.7 |
70
|
| MK/Al2O3 geopolymer |
30 |
NR |
NR |
4.26 |
17
|
| Kaolin geopolymer |
1800 |
NR |
NR |
4.75 |
71
|
| Pumice powder |
30 |
6 |
40 |
0.98 |
This study |
| GP-0 |
30 |
6 |
40 |
31.3 |
This study |
| GP-10 |
30 |
6 |
40 |
31.1 |
This study |
| GP-20 |
30 |
6 |
40 |
31.1 |
This study |
| GP-30 |
30 |
6 |
40 |
31.2 |
This study |
3.3 Desorption and recyclability
The desired adsorbent properties include recyclability, environment friendliness, affordability, chemical stability and high surface area (REACH). To determine the recyclability of the geopolymer composites, the spent geopolymers were regenerated using distilled water at 80 °C for 3 h at a liquid to solid ratio of 10. The use of warm distilled water showed good potential for desorption of MB dye from the spent geopolymers with up to 76.9% recovery, as shown in Fig. 16.
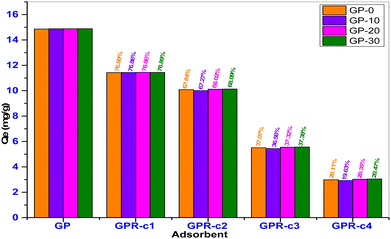 |
| | Fig. 16 Four-cycle recyclability potential of the geopolymers. | |
In the subsequent desorption cycles, the equilibrium adsorption capacity of the recycled geopolymers declined steadily. For example, the adsorption capacity of GPR-10 reduced from 11.43 mg g−1 from the first cycle to 2.92 mg g−1 in the fourth cycle corresponding to a decline from 76.86% to 19.63%. This can be explained by the inability of distilled water to recover or activate the increasing chemically spent active sites. It is therefore recommended that a two times recovery cycle is ideal for recycling the spent geopolymer composites using distilled water.
4. Conclusion
The present work investigated the abatement of aqueous methylene blue (MB) dye by four phosphate geopolymer composites based on pumice and medical waste fly ash (MWI-FA). Physicochemical characteristics revealed that the incorporation of 10–30% of MWI-FA in the pumice-based geopolymer exacerbated the specific surface area (SSA). However, the maximum adsorption capacities were indistinguishable at ∼31 mg g−1, suggesting the development of energetically favorable binding sites with the addition of MWI-FA compensating for the low SSA. The experimental kinetics were best described using the PSO model. The adsorption energies (ΔH, Ea, and ΔG) corresponded to a physisorption mechanism. Desorption of the exhausted geopolymer composites using hot water was feasible, although the performance sharply decreased after the second cycle. Alternative adsorbent recovery approaches should be explored. The geopolymers provide a sink for stabilization of up to 30% of MWI-FA without compromising the adsorbent performance generating a dual function strategy for waste management and water purification materials.
Data availability
The data supporting the conclusions in this article have been included in the manuscript.
Conflicts of interest
There are no conflicts to declare.
Acknowledgements
This work was partly funded by Kaimosi Friends University Research Fund, Grant number KAFU/601/APPL/043/Vol.1(7).
References
- A. Dąbrowski, Adsorption—from theory to practice, Adv. Colloid Interface Sci., 2001, 93(1–3), 135–224 Search PubMed.
- M. Sambucci, A. Sibai and M. Valente, Recent advances in geopolymer technology. A potential eco-friendly solution in the construction materials industry: a review, J. Composites Sci., 2021, 5(4), 109 CrossRef.
- M. Alouani, S. Alehyen, M. Achouri and M. Taibi, Removal of cationic dye-methylene blue-from aqueous solution by adsorption on fly ash-based geopolymer, J. Mater. Environ. Sci., 2018, 9(1), 32–46 Search PubMed.
- S. Tome, V. Shikuku, H. D. Tamaguelon, S. Akiri, M. A. Etoh, C. Rüscher and J. Etame, Efficient sequestration of malachite green in aqueous solution by laterite-rice husk ash-based alkali-activated materials: Parameters and mechanism, Environ. Sci. Pollut. Res., 2023, 30, 67263–67277 CrossRef PubMed.
-
V. O. Shikuku and T. Sylvain, Application of geopolymer composites in wastewater treatment: Trends, opportunities, and challenges, in Polymer nanocomposites for advanced engineering and military applications, ed. N. Ramdani, IGI Global, Hershey, PA, USA, 2019, pp. 131–149 Search PubMed.
- J. Davidovits, Geopolymers: Ceramic-like inorganic polymers, J. Appl. Ceram. Technol., 2017, 8(3), 335–350 Search PubMed.
- A. Kumar and S. Kumar, Development of paving blocks from synergistic use of red mud and fly ash using geopolymerization, Constr. Build. Mater., 2013, 38, 865–871 CrossRef.
- M. El Alouani, S. Alehyen and M. El Achouri, Taibi Mh. Preparation, characterization, and application of metakaolin-based geopolymer for removal of methylene blue from aqueous solution, J. Chem., 2019, 2019, 4212901 Search PubMed.
- A. Hajimohammadi, T. Ngo and J. Vongsvivut, Interfacial chemistry of a fly ash geopolymer and aggregates, J. Cleaner Prod., 2019, 231, 980–989 CrossRef CAS.
- V. O. Shikuku, S. Tome, D. T. Hermann, G. A. Tompsett and M. T. Timko, Rapid adsorption of cationic methylene blue dye onto volcanic ash-metakaolin based geopolymers, Silicon, 2022, 14(15), 9349–9359 CrossRef CAS.
- S. Tome, D. T. Hermann, V. O. Shikuku and S. Otieno, Synthesis, characterization and application of acid and alkaline activated volcanic ash-based geopolymers for adsorptive remotion of cationic and anionic dyes from water, Ceram. Int., 2021, 47(15), 20965–20973 CrossRef CAS.
- M. S. H. Khan, A. Castel, A. Akbarnezhad, S. J. Foster and M. Smith, Utilisation of steel furnace slag coarse aggregate in a low calcium fly ash geopolymer concrete, Cem. Concr. Res., 2016, 89, 220–229 CrossRef CAS.
- F. Akbal, Adsorption of basic dyes from aqueous solution onto pumice powder, J. Colloid Interface Sci., 2005, 286(2), 455–458 CrossRef CAS PubMed.
- L. O. Afolabi, Z. M. Ariff, P. S. M. Megat-Yusoff, H. H. Al-Kayiem, A. I. Arogundade and O. T. Afolabi-Owolabi, Red-mud geopolymer composite encapsulated phase change material for thermal comfort in built-sector, Sol. Energy, 2019, 181, 464–474 CrossRef CAS.
- E. K. Owino, V. O. Shikuku, W. N. Nyairo, C. O. Kowenje and B. Otieno, Valorization of solid waste incinerator fly ash by geopolymer production for removal of anionic bromocresol green dye from water: Kinetics, isotherms and thermodynamics studies, Sustainable Chem. Environ., 2023, 3, 100026 CrossRef.
- K. T. Tong, R. Vinai and M. N. Soutsos, Use of vietnamese rice husk ash for the production of sodium silicate as the activator for alkali-activated binders, J. Cleaner Prod., 2018, 201, 272–286 CrossRef CAS.
- M. I. Khan, T. K. Min, K. Azizli, S. Sufian, H. Ullah and Z. Man, Effective removal of methylene blue from water using phosphoric acid based geopolymers: Synthesis, characterizations and adsorption studies, RSC Adv., 2015, 5(75), 61410–61420 RSC.
- R. M. Novais, G. Ascensao, D. M. Tobaldi, M. P. Seabra and J. A. Labrincha, Biomass fly ash geopolymer monoliths for effective methylene blue removal from wastewaters, J. Cleaner Prod., 2018, 171, 783–794 CrossRef CAS.
- A. A. Siyal, M. R. Shamsuddin, M. I. Khan, N. E. Rabat, M. Zulfiqar, Z. Man, J. Siame and K. A. Azizli, A review on geopolymers as emerging materials for the adsorption of heavy metals and dyes, J. Environ. Manage., 2018, 224, 327–339 CrossRef CAS.
- A. A. Siyal, M. R. Shamsuddin, N. E. Rabat, M. Zulfiqar, Z. Man and A. Low, Fly ash based geopolymer for the adsorption of anionic surfactant from aqueous solution, J. Cleaner Prod., 2019, 229, 232–243 CrossRef CAS.
- S. Tome, M.-A. Etoh, J. Etame and K. Sanjay, Characterization and leachability behaviour of geopolymer cement synthesised from municipal solid waste incinerator fly ash and volcanic ash blends, Recycling, 2018, 3(4), 50 CrossRef.
- H. D. Tamaguelon, V. O. Shikuku, S. Tome, F. G. Titini, P. Ondiek, T. Strothmann, Z. Getenga, C. Janiak, M. A. Etoh and D. D. J. Dina, Unary adsorption of sulfonamide antibiotics onto pozzolan-tyre ash based geopolymers: Isotherms, kinetics and mechanisms, Chem. Eng. Res. Des., 2024, 206, 440–452 CrossRef CAS.
- J. R. Njimou, M. Pengou, H. K. Tchakoute, M. Sieugaing Tamwa, C. Tizaoui, U. Fannang, P. N. Lemougna, C. P. Nanseu-Njiki and E. Ngameni, Removal of lead ions from aqueous solution using phosphate-based geopolymer cement composite, J. Chem. Technol. Biotechnol., 2021, 96(5), 1358–1369 CrossRef CAS.
- J. M. Mboka, H. D. Tamaguelon, V. Shikuku, S. Tome, V. F. Deugueu, H. Othman, C. Janiak, M. M. Dika, M. A. Etoh and D. J. D. Dina, Novel superadsorbent from pozzolan-charcoal based geopolymer composite for the efficient removal of aqueous crystal violet, Water, Air, Soil Pollut., 2024, 235(7), 430 CrossRef CAS.
- S. Pu, Z. Zhu, W. Song, H. Wang, W. Huo and J. Zhang, A novel acidic phosphoric-based geopolymer binder for lead solidification/stabilization, J. Hazard. Mater., 2021, 415, 125659 CrossRef CAS.
- Y.-M. Li, C.-F. Wang, L.-J. Wang, T.-Y. Huang and G.-Z. Zhou, Removal of heavy metals in medical waste incineration fly ash by Na2EDTA combined with zero-valent iron and recycle of na2edta: Acolumnar experiment study, J. Air Waste Manage. Assoc., 2020, 70(9), 904–914 CrossRef CAS.
- I. Khan, K. Saeed, I. Zekker, B. Zhang, A. H. Hendi, A. Ahmad, S. Ahmad, N. Zada, H. Ahmad, L. A. Shah, T. Shah and I. Khan, Review on methylene blue: Its properties, uses, toxicity and photodegradation, Water, 2022, 14(2), 242 CrossRef CAS.
- H. T. Dzoujo, V. O. Shikuku, S. Tome, S. Akiri, N. M. Kengne, S. Abdpour, C. Janiak, M. A. Etoh and D. Dina, Synthesis of pozzolan and sugarcane bagasse derived geopolymer-biochar composites for methylene blue sequestration from aqueous medium, J. Environ. Manage., 2022, 318, 115533 CrossRef PubMed.
- D. T. Hermann, S. Tome, V. O. Shikuku, J. B. Tchuigwa, A. Spieß, C. Janiak, M. A. Etoh and D. D. Joh Dina, Enhanced performance of hydrogen peroxide modified pozzolan-based geopolymer for abatement of methylene blue from aqueous medium, Silicon, 2022, 14(10), 5191–5206 CrossRef.
- S. Tome, M.-A. Etoh, J. Etame and S. Kumar, Improved reactivity of volcanic ash using municipal solid incinerator fly ash for alkali-activated cement synthesis, Waste Biomass Valorization, 2020, 11(6), 3035–3044 CrossRef.
- H. K. Tchakouté, S. Kong, J. N. Y. Djobo, L. N. Tchadjié and D. Njopwouo, A comparative study of two methods to produce geopolymer composites from volcanic scoria and the role of structural water contained
in the volcanic scoria on its reactivity, Ceram. Int., 2015, 12568–12577 CrossRef.
- A. A. Siyal, K. A. Azizli, Z. Man and H. Ullah, Effects of parameters on the setting time of fly ash based geopolymers using taguchi method, Procedia Eng., 2016, 148, 302–307 CrossRef.
- H. K. Tchakouté, C. H. Rüscher, E. Kamseu, F. Andreola and C. Leonelli, Influence of the molar concentration of phosphoric acid solution on the properties of metakaolin-phosphate-based geopolymer cements, Appl. Clay Sci., 2017, 147, 184–194 CrossRef.
- C. N. Bewa, H. K. Tchakouté, C. H. Rüscher, E. Kamseu and C. Leonelli, Influence of the curing temperature on the properties of poly(phospho-ferro-siloxo) networks from laterite, SN Appl. Sci., 2019, 1(8), 916 CrossRef CAS.
- H. Wang, C. Li, Z. Peng and S. Zhang, Characterization and thermal behavior of kaolin, J. Therm. Anal. Calorim., 2011, 105(1), 157–160 CrossRef CAS.
- R. Istratie, M. Stoia, C. Păcurariu and C. Locovei, Single and simultaneous adsorption of methyl orange and phenol onto magnetic iron oxide/carbon nanocomposites, Arabian J. Chem., 2019, 12(8), 3704–3722 CrossRef CAS.
- M. A. Al-Ghouti, M. Khan, M. S. Nasser, K. Al Saad and O. O. N. Ee Heng, Application of geopolymers synthesized from incinerated municipal solid waste ashes for the removal of cationic dye from water, PLoS One, 2020, 15(11), e0239095 CrossRef CAS PubMed.
- Y. S. Ho and G. McKay, Sorption of dye from aqueous solution by peat, Chem. Eng. J., 1998, 70(2), 115–124 CrossRef CAS.
- Y.-S. Ho, Review of second-order models for adsorption systems, J. Hazard. Mater., 2006, 136(3), 681–689 CrossRef CAS PubMed.
- J. Weber Walter and J. C. Morris, Kinetics of adsorption on carbon from solution, J. Sanit. Eng. Div., 1963, 89(2), 31–59 CrossRef.
- V. O. Shikuku, R. Zanella, C. O. Kowenje, F. F. Donato, N. M. G. Bandeira and O. D. Prestes, Single and binary adsorption of sulfonamide antibiotics onto iron-modified clay: Linear and nonlinear isotherms, kinetics, thermodynamics, and mechanistic studies, Appl. Water Sci., 2018, 8(6), 175 CrossRef.
- S. Liu, Y. Ding, P. Li, K. Diao, X. Tan, F. Lei, Y. Zhan, Q. Li, B. Huang and Z. Huang, Adsorption of the anionic dye congo red from aqueous solution onto natural zeolites modified with n,n-dimethyl dehydroabietylamine oxide, Chem. Eng. J., 2014, 248, 135–144 CrossRef CAS.
-
T. R. Sahoo and B. Prelot, Adsorption processes for the removal of contaminants from wastewater: The perspective role of nanomaterials and nanotechnology, in Nanomaterials for the detection and removal of wastewater pollutants ed. B. Bonelli, F. S. Freyria, I. Rossetti and R. Sethi, Elsevier, 2020, ch. 7, pp. 161–222 Search PubMed.
- C. Xiong, S. Wang, L. Zhang, Y. Li, Y. Zhou and J. Peng, Preparation of 2-aminothiazole-functionalized poly(glycidyl methacrylate) microspheres and their excellent gold ion adsorption properties, RSC Adv., 2018, 10(2), 159 Search PubMed.
- H. Saad, F. A. N. El-Dien, N. E. A. El-Gamel and A. S. Abo Dena, Azo-functionalized superparamagnetic fe3o4 nanoparticles: An efficient adsorbent for the removal of bromocresol green from contaminated water, RSC Adv., 2022, 12(39), 25487–25499 RSC.
- S. Babel and T. A. Kurniawan, Cr(VI) removal from synthetic wastewater using coconut shell charcoal and commercial activated carbon modified with oxidizing agents and/or chitosan, Chemosphere, 2004, 54(7), 951–967 CrossRef CAS PubMed.
- U. Yunusa, B. Usman and M. B. Ibrahim, Cationic dyes removal from wastewater by adsorptive method: A systematic in-depth review, Algerian J. Chem. Eng., 2021, 1(2), 6–40 Search PubMed.
- H. M. Freundlich, Over the adsorption in solution, Z. Phys. Chem., 1906, 57(385471), 1100–1107 Search PubMed.
- G. Halsey, Physical adsorption on non-uniform surfaces, J. Chem. Phys., 1948, 16(10), 931–937 CrossRef.
- I. Langmuir, The constitution and fundamental properties of solids and liquids. Part i. Solids, J. Am. Chem. Soc., 1916, 38(11), 2221–2295 CrossRef.
- A. E. Ofomaja and Y.-S. Ho, Effect of temperatures and ph on methyl violet biosorption by mansonia wood sawdust, Bioresour. Technol., 2008, 99(13), 5411–5417 CrossRef.
- R. Sips, On the structure of a catalyst surface, J. Chem. Phys., 1948, 16(5), 490–495 CrossRef.
-
D. D. J. Duong, Adsorption analysis: Equilibria and kinetics, 1998 Search PubMed.
-
R. Treybal, Mass transfer operations, McGraw Hill, New York, 2nd edn, 1980, vol. 466, pp. 493–497 Search PubMed.
- M.-H. To, P. Hadi, C.-W. Hui, C. S. K. Lin and G. McKay, Mechanistic study of atenolol, acebutolol and carbamazepine adsorption on waste biomass derived activated carbon, J. Mol. Liq., 2017, 241, 386–398 CrossRef.
- S. Allen and B. Koumanova, Decolourisation of water/wastewater using adsorption, J. Univ. Chem. Technol. Metallurgy, 2005, 40(3), 175–192 Search PubMed.
- F. Mashkoor, A. Nasar, I. Inamuddin and A. M. Asiri, Exploring the reusability of synthetically contaminated wastewater containing crystal violet dye using tectona grandis sawdust as a very low-cost adsorbent, Sci. Rep., 2018, 8(1), 8314 CrossRef PubMed.
- K. Zulkifly, H. C. Yong, M. M. A. B. Abdullah, L. Y. Ming, A. V. Sandu and S. F. A. Abdullah, Characterization of fly ash and metakaolin blend geopolymers under ambient temperature condition, IOP Conf. Ser.: Mater. Sci. Eng., 2019, 551, 012086 CAS.
- M. Peydayesh, M. Isanejad and T. Mohammadi, Reza Seyed Jafari SMJCP. Assessment of urtica as a low-cost adsorbent for methylene blue removal: Kinetic, equilibrium, and thermodynamic studies, Chem. Pap., 2015, 69(7), 930–937 CAS.
- T. Mishra and S. K. Tiwari, Studies on sorption properties of zeolite derived from indian fly ash, J. Hazard. Mater., 2006, 137(1), 299–303 CrossRef CAS PubMed.
- I. Luttah, D. Onunga, V. Shikuku, B. Otieno and C. Kowenje, Removal of endosulfan from water by municipal waste incinerator fly ash based geopolymers: Adsorption kinetics, isotherms, and thermodynamics, Front. Environ. Chem., 2023, 4, 1164372 CrossRef.
- C. Travis and E. L. Etnier, A survey of sorption relationships for reactive solutes in soil, J. Environ. Qual., 1981, 10(1), 8–17 CrossRef CAS.
- Z. Yu, W. Song and P. Ding, Mesoporous geopolymer for improved adsorption and immobilization of copper ions, Desalination Water Treat., 2020, 201, 278–288 CrossRef CAS.
- H. I. Chieng and L. B. Lim, Priyantha NJEt. Enhancing adsorption capacity of toxic malachite green dye through chemically modified breadnut peel: Equilibrium, thermodynamics, kinetics and regeneration studies, Environ. Technol., 2015, 36(1), 86–97 CrossRef CAS PubMed.
- A. E. Ofomaja and Y.-S. Ho, Equilibrium sorption of anionic dye from aqueous solution by palm kernel fibre as sorbent, Dyes Pigm., 2007, 74(1), 60–66 CrossRef CAS.
- S. Umoren, U. Etim and A. J. Israel, Adsorption of methylene blue from industrial effluent using poly(vinyl alcohol), J. Mater. Environ. Sci., 2013, 4(1), 75–86 CAS.
- V. O. Shikuku and S. Jemutai-Kimosop, Efficient removal of sulfamethoxazole onto sugarcane bagasse-derived biochar: Two and three-parameter isotherms, kinetics and thermodynamics, S. Afr. J. Chem., 2020, 73(1), 111 CAS.
- Z. Derakhshan, M. A. Baghapour, M. Ranjbar and M. Faramarzian, Adsorption of methylene blue dye from aqueous solutions by modified pumice stone: Kinetics and equilibrium studies, Health Scope, 2013, 2(3), 136–144 CrossRef.
- L. Li, S. Wang and Z. Zhu, Geopolymeric adsorbents from fly ash for dye removal from aqueous solution, J. Colloid Interface Sci., 2006, 300(1), 52–59 CrossRef CAS PubMed.
- Y. Liu, C. Yan, Z. Zhang, Y. Gong, H. Wang and X. Qiu, A facile method for preparation of floatable and permeable fly
ash-based geopolymer block, Mater. Lett., 2016, 185, 370–373 CrossRef CAS.
- R. I. Yousef, B. El-Eswed, M. Alshaaer, F. Khalili and H. Khoury, The influence of using jordanian natural zeolite on the adsorption, physical, and mechanical properties of geopolymers products, J. Hazard. Mater., 2009, 165(1–3), 379–387 CrossRef CAS.
|
| This journal is © The Royal Society of Chemistry 2024 |
Click here to see how this site uses Cookies. View our privacy policy here.  Open Access Article
 a,
Bowa
Kwach
a,
Victor
Shikuku
a,
Bowa
Kwach
a,
Victor
Shikuku
 *b,
Tome
Sylvain
 cd,
Hermann
Dzoujo Tamaguelon
 c and
Claus
Rüscher
d


![[small script l]](https://www.rsc.org/images/entities/char_e146.gif) −k1t)
−k1t)


![[thin space (1/6-em)]](https://www.rsc.org/images/entities/char_2009.gif) ln
ln![[thin space (1/6-em)]](https://www.rsc.org/images/entities/char_2009.gif) Kc
Kc


