 Open Access Article
Probing the thermoelectric and optical performance of half-Heusler PtZrX (X = Si, Ge) semiconductors: a first principles investigation
Bharti
Gurunani
 and
Dinesh C.
Gupta
 *
*
Condensed Matter Theory Group, School of Studies in Physics, Jiwaji University, Gwalior – 474011, India. E-mail: bgurunani001@gmail.com; sosfizix@gmail.com
First published on 6th November 2024
Abstract
In this study, we employed first-principles calculations based on density functional theory (DFT) implemented within the WIEN2k code to investigate the comprehensive material properties of PtZrX alloys (X = Si, Ge). This investigation encompassed structural, mechanical, electronic, thermal, optical, and thermoelectric characteristics. The lattice parameters, bulk modulus, and cohesive energy of these alloys were determined under the conditions of absolute zero temperature (0 K) and ambient pressure (0 GPa). The obtained results demonstrate that PtZrSi and PtZrGe exhibit both anisotropic and elastically stable characteristics. Furthermore, both alloys display indirect bandgap semiconducting behavior with bandgaps of 1.43 eV and 1.32 eV for PtZrSi and PtZrGe, respectively. We utilize density functional perturbation theory (DFPT) to predict the dynamical behavior of these ordered systems. The calculated standard enthalpy of formation further corroborates their thermodynamic stability. Analysis of Young's and shear modulus revealed that PtZrSi possesses superior stiffness compared to PtZrGe. The dielectric function was employed to explore the optical properties, suggesting potential applications in optoelectronics, as corroborated by the analysis of the optical spectra. Moreover, this research suggests the potential of these alloys as efficient thermal insulators for solar heating applications. Finally, the BoltzTrap code was utilized to compute the temperature-dependent thermoelectric properties, providing valuable insights into their potential applications in thermoelectric devices.
1. Introduction
The realm of semiconductor technology has predominantly employed elemental semiconductors like Si and Ge, or binary compounds like GaAs and InP.1 However, a less explored avenue lies in semiconductors with more intricate crystal structures, characterized by three distinct lattice sites. These “ternary” materials exhibit the potential to surpass their binary counterparts in terms of performance.One particularly intriguing class of ternary materials falls under the chemical formula ABC and crystallizes in the C1b structure. This structure incorporates elements from various regions of the periodic table: a main group element (C), an early transition metal (B), and a late transition metal (A).2 These materials are also known as half-Heusler compounds and can be described using several structural models: a rock salt structure with additional atoms (A) occupying specific interstitial sites, or a filled tetrahedral structure derived from the zinc blende lattice.
Theoretical predictions, based on electron counting principles, suggest that these materials can exhibit semiconducting behavior when possessing a specific number of valence electrons. The flexibility in choosing elements for A, B, and C allows for a vast array of tunable properties, encompassing both physical characteristics (e.g., lattice parameters, elastic moduli) and electronic properties.3 This versatility is further amplified when considering heterostructures, which combine two distinct ternary materials (ABC and A′B′C′). Such combinations can exhibit remarkable similarity in certain properties (e.g., lattice constant, valence band position) while displaying significant differences in others. This level of control over material properties is rarely achievable with binary materials.
This inherent flexibility paves the way for materials by design, a concept where scientists can theoretically predict and synthesize materials with specific functionalities. An example of this approach lies in the theoretical prediction of CoTaSn,4 a ternary semiconductor exhibiting both optical transparency and p-type conductivity upon doping. The concept of materials by design finds further application in the optimization of thermoelectric materials, a class of materials capable of converting heat into electricity. While recent studies have focused on improving thermal conductivity in half-Heusler alloys, others have explored strategies for optimizing binary thermoelectrics through doping.5–7 Within Heusler alloys, the selection of the main group element has a critical influence on their material properties, enabling their customization for targeted applications. This strategic manipulation results in a captivating array of electronic behaviors, including semiconducting, metallic, spin-semi metallic, half-metallic, spin-gapless, and even topological or superconducting characteristics.8,9 Notably, half-Heusler (HH) alloys with narrow bandgaps exhibit a particularly compelling combination of properties. These materials frequently demonstrate high melting points, elevated Curie temperatures (the temperature at which ferromagnetic behavior ceases), substantial thermopower (the ability to convert heat into electricity), and integral or zero magnetic moments.10–12
While high-throughput computational methods have facilitated initial screening of basic properties within the vast landscape of ternary compounds,13 a comprehensive understanding of material properties crucial for semiconductor technology remains largely unavailable for most C1b ternary compounds. This includes detailed information on effective masses and deformation potentials of charge carriers. This study aims to address this gap by providing a thorough theoretical characterization of two representative C1b compounds, PtZrSi and PtZrGe. The primary motivation for investigating these materials stems from their potential applications in thermoelectrics. Notably, recent theoretical studies have explored the thermoelectric properties of NiZrSn.14,15 Experimentally, half-Heusler materials with similar compositions, such as NiTiSn, Ni (Zr, Hf) Sn, and CoTiSb, have demonstrated encouraging performance.16,17 Based on empirical observations, ternary compounds of the form ABC where element C originates from group IV exhibit a propensity for n-type semiconduction when doped. Conversely, materials with element C from group V are more readily employed for p-type doping.
Recent advancements in thermoelectrics have driven a surge of interest in half-Heusler (HH) compounds due to their exceptional thermoelectric (TE) properties. These ternary alloys offer a unique combination of high thermopower at elevated temperatures and the versatility to achieve both n-type and p-type conductivity through strategic manipulation of their chemical composition.18,19 Notably, p-type FeNbSb-based HH alloys have achieved a remarkable figure of merit (ZT) of 1.5 at 1200 K.20,21 Similarly, n-type XNiSn (X = Ti, Zr, Hf) and p-type XCoSb (X = Ti, Zr, Hf) demonstrate promising ZT values exceeding 1.0 at high temperatures.22–24 The PtXSn compounds reveal an indirect bandgap semiconducting nature with a gap of 1.23 eV and 0.94 eV for PtZrSn and PtHfSn, respectively.25 The success of HH compounds in thermoelectrics can be attributed to their adherence to the Slater–Pauling rule, resulting in a semiconducting electronic structure ideal for TE applications.26,27 These materials possess a multitude of advantages, including high power factor, affordability, robust mechanical properties, environmental friendliness, and exceptional stability.28–31 As a consequence, HH alloys are considered frontrunners in the development of next-generation thermoelectric devices.
This study focuses on PtZrX (X = Si, Ge) compounds, motivated by their inherent thermal and mechanical stability alongside their environmentally benign composition. While previous research has established their promising nature, a comprehensive theoretical and experimental analysis of their properties remains elusive.32 Therefore, we employ a combined approach utilizing first-principles calculations and Boltzmann transport theory to systematically investigate the structural, mechanical, electronic, and thermoelectric properties of PtZrX (X = Si, Ge).
We have chosen to focus on PtZrX for several reasons: the combination of platinum, zirconium, and X (a light element) offers a unique set of properties that may not be found in other half-Heusler alloys. The specific properties of PtZrX, such as high thermoelectric figure of merit, low lattice thermal conductivity, or interesting electronic structure, make it a promising candidate for potential applications, e.g., energy conversion, thermoelectric devices, or topological materials. Our work aims to provide a systematic investigation of the structural, electronic, and thermodynamic properties of PtZrX, contributing to a deeper understanding of half-Heusler alloys and their potential applications. The novelty of our work lies in specific novel aspects, such as a new theoretical approach, a unique computational method, or the discovery of new properties. By addressing these key points, we believe that our research offers a valuable contribution to the field of half-Heusler alloys.
2. Computational methodology
The WIEN2k code has been utilized to conduct simulations and characterize the material under investigation.33 This software is rooted in the full potential linearized augmented plane wave (FP-LAPW) approach within density functional theory (DFT), offering a robust analytical framework without imposing significant time and financial constraints. WIEN2k facilitates the optimization of crystal structures and the computation of various crucial properties, including lattice parameters, band structure, density of states, thermodynamic stability, dielectric constant, absorption coefficient, refractive index, and thermodynamic stability parameters. To investigate the phonon dispersions and assess dynamical stability, we employed density functional perturbation theory (DFPT) as implemented in the Quantum Espresso simulation package.34 In this study, we adopted the local density approximation (LDA),35 Perdew–Burke–Ernzerhof generalized gradient approximation (PBE-GGA),36 and exchange–correlation potential functionals to precisely determine the ground state energy and band gap. Additionally, we integrated the Tran–Blaha modified Becke–Johnson (TB-mBJ) semi-local exchange and correlation potential to enhance modeling accuracy.37 Stringent convergence criteria were meticulously established to ensure that the total energy per unit cell remains below 10−4 Ry and the charge differential for each self-consistent iteration remains under 10−4 e a.u.−3. Elastic properties were comprehensively investigated utilizing the IRElast package integrated within WIEN2k.38 We used 20 × 20 × 20 k-mesh in the first Brillouin zone for the calculation of structural, elastic, thermodynamic and electronic parameters. Since optical spectra strongly depend upon Brillouin zone sampling, a sufficiently dense k-mesh of 50 × 50 × 50 k-points has been used to calculate optical parameters. The temperature dependence of thermopower was calculated based on the Boltzmann transport theory within the constant scattering-time approximation (CSTA)39 by using the BoltzTraP code. Our computations were performed using a dense k-mesh comprising 150![[thin space (1/6-em)]](https://www.rsc.org/images/entities/char_2009.gif) 000 k-points, a well-established method for analyzing thermoelectric properties. Given the importance of understanding material behavior under varying pressure and temperature, we employed the quasi-harmonic Gibbs2 code40 to evaluate the material's thermal stability.
000 k-points, a well-established method for analyzing thermoelectric properties. Given the importance of understanding material behavior under varying pressure and temperature, we employed the quasi-harmonic Gibbs2 code40 to evaluate the material's thermal stability.
3. Results and discussion
In this section, we present a comprehensive analysis of extensive computational results pertaining to the various properties exhibited by half-Heusler alloys. Our primary focus is on PtZrX (where X = Si, Ge), where we meticulously examine and elucidate the intricate details of their structural, electronic, magnetic, mechanical, thermodynamic, transport, and optical characteristics.3.1. Structure stability
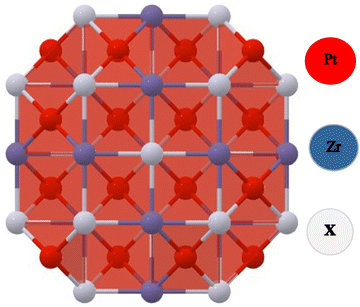
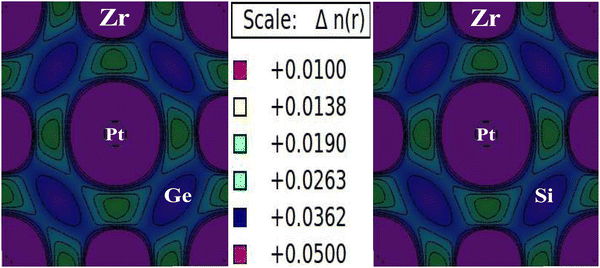
The FCC structure of Half-Heusler alloys comprising PtZrX (X = Si, Ge) exhibits space group (F![[4 with combining macron]](https://www.rsc.org/images/entities/char_0034_0304.gif) 3m) symmetry and space group number (216). Pt atoms occupy 4(c) sites at coordinates (1/4, 1/4, 1/4), while Zr atoms occupy 4(a) positions at the origin (0, 0, 0) and X atoms occupy 4(d) sites at (1/2, 1/2, 1/2) as represented in Fig. 1.
3m) symmetry and space group number (216). Pt atoms occupy 4(c) sites at coordinates (1/4, 1/4, 1/4), while Zr atoms occupy 4(a) positions at the origin (0, 0, 0) and X atoms occupy 4(d) sites at (1/2, 1/2, 1/2) as represented in Fig. 1.
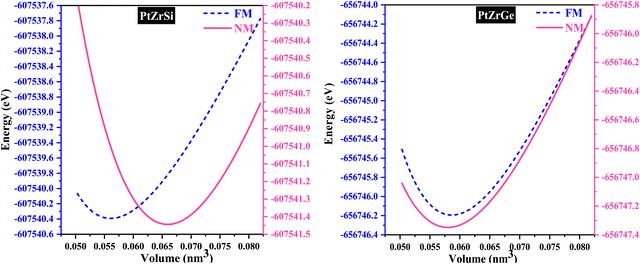
In the examination of the material, the initial stage consists of minimizing its structure to determine its parameters in the most stable state. Subsequently, an evaluation of the energy change concerning volume has been carried out using the GGA approximation, followed by fitting to the Birch–Murnaghan equation of state (EOS).31
| Alloys | Phase | A | V | B | E 0 | E Coh | E For | |
|---|---|---|---|---|---|---|---|---|
| PtZrSi | FM | 0.60 | 0.056 | 141.69 | 4.37 | −607![[thin space (1/6-em)]](https://www.rsc.org/images/entities/char_2009.gif) 540.38 540.38 |
−2.46 | −1.10 |
| NM | 0.61 | 0.058 | 127.60 | 4.60 | −607![[thin space (1/6-em)]](https://www.rsc.org/images/entities/char_2009.gif) 541.44 541.44 |
|||
| PtZrGe | FM | 0.63 | 0.058 | 137.47 | 4.66 | −656![[thin space (1/6-em)]](https://www.rsc.org/images/entities/char_2009.gif) 746.19 746.19 |
−2.13 | −0.49 |
| NM | 0.62 | 0.061 | 123.47 | 4.74 | −656![[thin space (1/6-em)]](https://www.rsc.org/images/entities/char_2009.gif) 747.34 747.34 |
|||
| CoZrSi18 | FM | 0.61 | 0.059 | 146.51 | 4.27 | −143![[thin space (1/6-em)]](https://www.rsc.org/images/entities/char_2009.gif) 692.02 692.02 |
— | — |
| NM | 0.58 | 0.062 | 146.23 | 4.23 | −143![[thin space (1/6-em)]](https://www.rsc.org/images/entities/char_2009.gif) 691.75 691.75 |
The relaxation of the structure is meticulously conducted using dynamics, encompassing both ions and electrons, while adhering to stringent convergence criteria for kinetic energy, total energy, and force. Following this, the stability of PtZrX alloys was scrutinized through meticulous calculations of formation energy (EFor) and cohesive energy (ECoh), crucial in evaluating their potential for experimental realization.
| EFor = EPtZrXtotal − (EPtbulk + EZrbulk + EXbulk) |
| ECoh = EPtZrXtotal − (EPtatom + EZratom + EXatom) |
![[4 with combining macron]](https://www.rsc.org/images/entities/char_0034_0304.gif) 3m symmetry significantly influences the energetic, chemical, and thermal stability of the PtZrX structure. Therefore, our findings are in concordance with prior research findings.
3m symmetry significantly influences the energetic, chemical, and thermal stability of the PtZrX structure. Therefore, our findings are in concordance with prior research findings.
3.2. Phonon stability
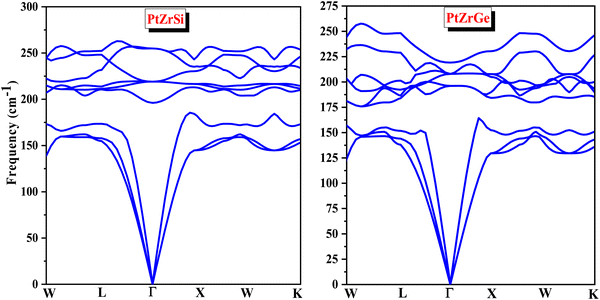
Phonons are fundamental to understanding the dynamics of structural stability, thermal properties, and other critical aspects of materials science. In quantum physics, a phonon represents the quantized vibrational motion within a lattice of atoms or molecules, occurring at specific frequencies. The concept of phonon stability is crucial in assessing whether a crystal lattice is dynamically stable—meaning the vibrational modes, or phonons, within the crystal are well-defined and stable.For a crystal lattice to be considered dynamically stable, its phonon frequencies must be real (non-complex) and positive. This condition indicates that atoms oscillate consistently around their equilibrium positions without leading to any spontaneous displacement that could destabilize the lattice. Phonon stability is typically evaluated by analyzing the phonon dispersion and frequencies throughout the Brillouin zone. A lattice is deemed dynamically stable if all phonon frequencies are positive and real across the entire Brillouin zone. Conversely, the presence of imaginary (negative) frequencies signifies potential instability, which necessitates further investigation. In this context, the absence of imaginary frequencies, as observed in Fig. 3, unequivocally confirms the phonon stability of the materials under study, thereby affirming the dynamical stability of the crystal lattice. The real, positive phonon frequencies identified in PtZrSi and PtZrGe substantiate their phonon stability, highlighting the robustness of their structural dynamics.
3.3. Electronic structure
Density functional theory (DFT) is based on the principle of describing an interacting fermion system through its electron density rather than its many-body wave function. However, a key challenge arises from the lack of an exact functional for exchange and correlation beyond the free-electron gas model. Nevertheless, diverse approximations have been formulated, facilitating the precise computation of certain physical quantities. Consequently, the reliance on approximations remains indispensable. To determine the electronic band profile and band gap, the authors performed self-consistent field (SCF) calculations using the potential functionals outlined in the computational details.40 Well-established limitations of local density approximation (LDA) and generalized gradient approximation (GGA) functionals include the underestimation of electronic band gaps in semiconductors.41–43 To address this challenge and enhance the accuracy of our calculations, we employ the Tran–Blaha modified Becke–Johnson (TB-mBJ) approach. The local density approximation (LDA) and the generalized gradient approximation (GGA) are foundational techniques in density functional theory (DFT) used for modeling the exchange–correlation energy of electrons. LDA, which relies exclusively on local electron density, is particularly effective for systems with uniform electron distributions. In contrast, GGA improves upon LDA by incorporating the gradient of the electron density, thereby enhancing accuracy for systems with spatially varying densities. However, the added complexity of GGA can sometimes lead to overestimated structural properties, making LDA more reliable for certain applications. Both LDA and GGA, nonetheless, tend to underestimate band gaps in semiconductors and insulators. The modified Becke–Johnson (mBJ) potential offers a significant advancement by providing improved electron localization and a more accurate exchange–correlation potential, thereby delivering band gap predictions that align more closely with experimental data and making it a preferred choice for electronic structure calculations. Fig. 4 presents the resultant band structure curves for three different potentials of PtZrSi and PtZrGe. These curves depict the crucial relationship between the wave vector (k) and the energy function within the first Brillouin zone.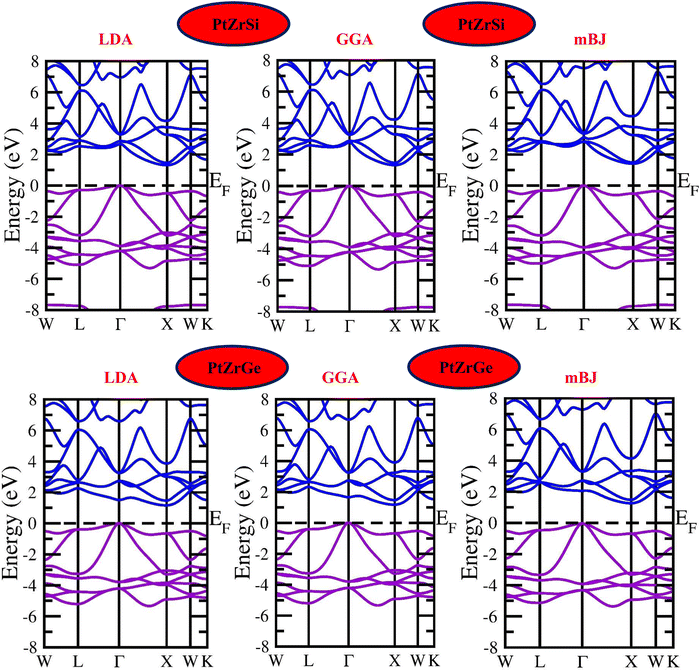 | ||
| Fig. 4 Electronic band structure for PtZrSi and PtZrGe HH alloys by the LDA, GGA and mBJ approximation. | ||
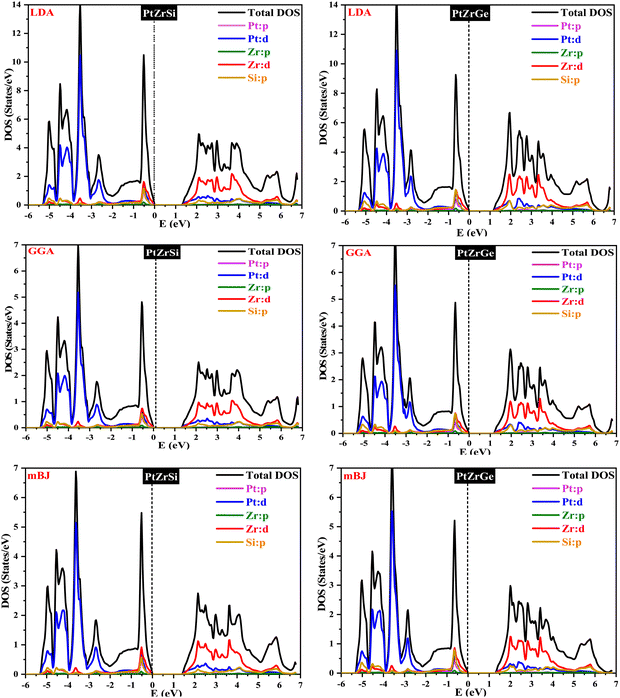
In Fig. 4 and 5, the electronic properties of PtZrSi and PtZrGe are presented through calculated band structures and total and partial densities of states (TDOS and PDOS). These calculations were performed at equilibrium lattice constants, 0 GPa pressure, and 0 K temperature to elucidate the electronic behavior of these materials.44 The band structures encompass a range of −8 eV to 8 eV along the Brillouin zone (BZ) symmetry line. The electronic band profiles of PtZrX (X = Si, Ge) were scrutinized using LDA, PBE-GGA, and TB-mBJ functionals, as delineated in Fig. 4. The provided band structure figure shows the energy levels as a function of momentum along various high-symmetry paths in the Brillouin zone (W → L → Γ → X → W → K). For PtZrSi, the determined indirect band gap values are 1.27 eV, 1.34 eV, and 1.44 eV, while for PtZrGe, these values are 1.16 eV, 1.21 eV, and 1.32 eV, respectively, in the LDA, GGA, and mBJ approximation. Analysis of the calculated band structures reveals that the conduction band minimum (CBM) resides at the X point of the Brillouin zone (BZ), while the valence band maximum (VBM) is located at the Γ point (zone centre). These characteristics bear significant implications for potential thermoelectric applications.
Fig. 5 shows how the distribution of electronic states is influenced by the different atomic orbitals in platinum (Pt), zirconium (Zr), silicon (Si), and germanium (Ge). Interestingly, our analysis found that the edges of the valence and conduction bands are mainly determined by the d-orbitals of the zirconium atoms. Specifically, these d-state bands exhibit a heightened population density around the Fermi level, indicating a substantial presence of electronic states conducive to conductivity. Moreover, we observe a noteworthy contribution from hybridized Pt-d and Si/Ge-p orbitals, which further modulate the electronic structure around the band edges. This hybridization leads to additional electronic states within the energy range of interest, influencing the overall electronic behavior of the material. Overall, the combined effect of Zr d-orbitals and the contributions from Pt and Si/Ge orbitals results in a characteristic band structure indicative of p-type semiconducting behavior. These materials display a broad range of bandgaps, making them promising candidates for optoelectronic devices.
In semiconductors, while the band gap is a crucial parameter, the effective mass of charge carriers and their concentration are equally significant in determining the material's transport properties. We calculated the effective masses of electrons (me) for both half-Heusler alloys. The effective masses of these carriers are determined by the curvature of the energy bands at the valence band maximum (VBM) and the conduction band minimum (CBM). These effective masses were estimated by fitting the E–k dispersion curves obtained from mBJ band structure calculations, using the formula
| m* = ℏ2/(∂2E(k)/∂k2)−1. |
| Alloys | Band gap | Effective mass | ||
|---|---|---|---|---|
| LDA | GGA | mBJ | ||
| PtZrSi | 1.27 | 1.34 | 1.44 | 0.33 |
| PtZrGe | 1.16 | 1.21 | 1.32 | 0.38 |
| PtZrSn25 | — | — | 1.23 | 0.39 |
3.4. Elastic stability
A material's response to external forces, encompassing both strength and resilience, is frequently assessed through the evaluation of its elastic constants. While there exists a total of 81 elastic constants,44 cubic systems typically require only three: C11, C12, and C44. Each of these constants corresponds to specific properties: C11 represents longitudinal compression, C12 signifies transverse expansion, and C44 denotes the shear modulus. The positive values of these constants are essential, as they confirm the stability of the compounds. Furthermore, adherence to the Born–Huang stability criteria45C44 > 0; C11 + 2C12 > 0; C11 − C12 > 0 adds another layer of validation. Utilizing these constants, various elastic parameters such as bulk modulus, Young's modulus, and shear modulus have been meticulously calculated and detailed in Table 3. Initially, the estimation of bulk and shear modulus was conducted via the Voigt–Reuss–Hill method.46 Subsequently, the Young's modulus, a key indicator of material stiffness, was determined using the relation . Additionally, parameters including Poisson's ratio
  , Pugh's ratio (B/G), anisotropic factor A (
 ), and Cauchy's pressure CP = C11 − C12 were meticulously ascertained, contributing to a comprehensive understanding of the material's behavior. These all-elastic parameters are reported in Table 3.
| Alloys | C 11 | C 12 | C 44 | Y | B | G | A | B/G | σ | C p |
|---|---|---|---|---|---|---|---|---|---|---|
| PtZrSi | 182.45 | 101.68 | 86.26 | 163.82 | 128.60 | 63.61 | 2.14 | 2.02 | 0.28 | 15.42 |
| PtZrGe | 178.94 | 92.58 | 81.37 | 161.33 | 121.37 | 63.10 | 1.88 | 1.92 | 0.27 | 11.21 |
| CoZrSi18 | 233.86 | 100.96 | 65.31 | 171.42 | 145.28 | 65.76 | 0.98 | 2.21 | 0.31 | 35.67 |
Poisson's ratio is a crucial indicator of the directional characteristics of covalent bonds within materials.47 Typically, this ratio stands at approximately 0.1 for covalent substances and increases to 0.25 for ionic materials. The examination of data from Table 2 strongly suggests a prevalence of ionic bonding within the alloys being studied. Furthermore, the calculated Zener anisotropic factors, surpassing 1 for these alloys, underscore their inherently anisotropic nature.48 In evaluating the ductility or brittleness of the materials, Pugh's ratio was utilized, revealing values exceeding 1.75 for both these HH alloys, indicative of their ductile behavior. This finding is further supported by the positive Cauchy's pressure values observed for these materials.49 Notably, Frantsevich et al. proposed that materials retaining ductile characteristics typically exhibit Poisson's ratio values exceeding 0.26, thereby reinforcing the ductile nature of the alloys under investigation.50 Given their anisotropic properties, these materials exhibit varying elastic wave velocities across different directions. Consequently, longitudinal (νl) and transverse waves (νt1 and νt2) were meticulously computed along the (100), (110), and (111) directions, as elaborated in Table 4 using Bugg's relation.51 Another significant parameter derived from the analysis is the Debye temperature θD, which serves to correlate elastic and thermal properties. Its computation relied on the mean sound velocity νm as an integral component of the analytical process, which is calculated as  . In the given context, νl and νt denote the longitudinal and transverse sound velocities, respectively, and these parameters are determined using Navier's equation52 as follows:
  . The resultant longitudinal, transverse, and mean velocities are meticulously recorded in Table 4. The calculation of the Debye temperature θD follows the formula
  . In this context, h signifies Planck's constant, k denotes Boltzmann's constant, NA is Avogadro's number, n stands for the number of atoms per molecule or per formula unit, M indicates the molar mass, ρ signifies the density of the unit cell, and νm represents the average sound velocity. The resulting θD values for the alloys under study are meticulously detailed in Table 5. Their notably elevated magnitudes indicate substantial melting points, hardness, and thermal expansion coefficients for these HH alloys.53,54 The synergistic consideration of these mechanical parameters establishes a robust foundation for predicting material performance and reliability in real-world operating environments.
| Planes | Sound velocities | PtZrSi | PtZrGe | CoZrSi18 |
|---|---|---|---|---|
| [100] | ν l = √C11/ρ | 4500.20 | 4246.36 | 6259.68 |
| ν t1 = √C44/ρ | 3094.32 | 2863.49 | 3308.13 | |
| ν t2 = √C44/ρ | 3094.32 | 2863.49 | 3308.13 | |
| ν D | 3673.71 | 2822.52 | 3673.71 | |
| [110] | ν l = √C11 + C12 + C44/2ρ | 5030.27 | 4677.60 | 6244.66 |
| ν t1 = √C11 − C12/ρ | 2117.24 | 2085.95 | 3336.40 | |
| ν t2 = √C44/ρ | 3094.31 | 2863.49 | 3308.13 | |
| ν D | 3687.58 | 2757.09 | 3687.58 | |
| [111] | ν l = √C11 + 2C12 + 4C44/3ρ | 5200.12 | 4812.77 | 6239.64 |
| ν t1 = √C11 − C12 + C44/3ρ | 2485.97 | 2373.60 | 3327.04 | |
| ν t2 = √C11 − C12 + C44/3ρ | 2485.97 | 2373.60 | 3327.04 | |
| ν D | 3692.38 | 2740.01 | 3692.38 |
| Elastic parameters | PtZrSi | PtZrGe | CoZrSi18 |
|---|---|---|---|
| Transverse velocity | 2657.19 | 2521.61 | 3319.41 |
| Longitudinal velocity | 4867.14 | 4550.61 | 6247.62 |
| Average velocity | 3465.85 | 3276.81 | 3684.88 |
| Debye temperature | 345.68 | 305.23 | 486.30 |
| Melting temperature | 1631.46 ± 300 | 1610.71 ± 300 | 1935.39 ± 300 |
3.5. Thermal stability
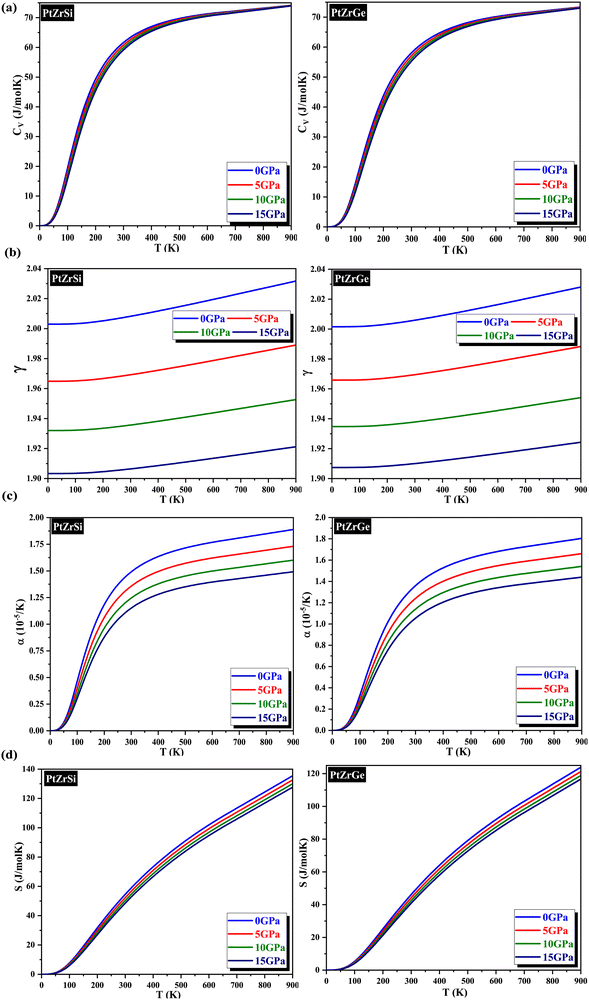
In this study, we employed the quasi-harmonic Debye model to conduct a comprehensive analysis of the temperature and pressure dependence of thermodynamic properties for these alloys. This computational approach incorporates the effects of temperature on atomic vibrations. The analysis encompassed a temperature range of 0–900 K and a pressure range of 0–15 GPa.Our initial focus was on computing the specific heat (CV), and the resulting variations with temperature at various pressures are visually represented in Fig. 7(a). Examination of the graph illustrates a progressive increase in CV with temperature elevation. Notably, at lower temperatures, these variations adhere to the T3 law, while at higher temperatures, they conform to the Dulong–Petit law. The observed behavior is a consequence of enhanced atomic mobility due to elevated temperatures. Intriguingly, the effect of pressure on CV is negligible. In fact, a statistically insignificant decrease in CV is observed with increasing pressure, potentially attributable to the concomitant attenuation of atomic vibrations. At room temperature, CV values for these HH alloys are comprehensively presented in Table 6.
| Alloys | C V | γ | α | S |
|---|---|---|---|---|
| PtZrSi | 61.59 | 2.01 | 1.49 | 52.18 |
| PtZrGe | 58.29 | 2.00 | 1.36 | 46.59 |
| CoZrSi18 | 58.35 | 2.002 | 1.41 | — |
Subsequently, our investigation extended to the computation of the Grüneisen parameter (γ), a metric that assesses the correlation between the thermal and elastic characteristics of solids. This parameter serves as a means to elucidate the presence of anharmonicity within the crystal lattice, a phenomenon governed by the same interatomic forces influencing both thermal and elastic properties. The variations of γ are graphically represented in Fig. 7(b). Our analysis of these data revealed a subtle increment with increasing temperature, whereas an elevation in pressure induced a reduction in γ, primarily due to the diminished degree of anharmonicity. This observation underscores the profound influence exerted by pressure on the Grüneisen parameter. Detailed values of γ for the examined alloys are meticulously presented in Table 6, which demonstrates notably superior thermoelectric performance. This enhancement is attributed to its heightened degree of anharmonicity in comparison to the other materials within the group.
Moreover, we undertook calculations to ascertain another critical parameter: the thermal expansion coefficient (α) formulated as α = γCV/BTV. The corresponding plots illustrating this parameter as a function of temperature at various pressures are depicted in Fig. 7(c). Additionally, the behavior of α with pressure is elucidated within the same Fig. 7(c). Here, a reduction in α is discerned with increasing pressure, signalling a decrease in interatomic spacing due to heightened pressure, indicative of stronger bonding between the constituents. These observations highlight the substantial impact of pressure on thermal expansion, underscoring the necessity of considering pressure effects in the design of thermoelectric devices. The specific values of α at room temperature are delineated in Table 6.
Fig. 7(d) offers a comprehensive portrayal of entropy (S) as a function of temperature (T) across a range of 0–900 K and pressure (P) from 0 to 15 GPa. The visualization specifically emphasizes PtZrSi and PtZrGe skutterudites. Notably, these graphs unveil a captivating trend: entropy exhibits a minimum value at absolute zero temperature (0 K). Furthermore, at constant pressure (0 GPa), entropy (S) demonstrates an exponential increase with increasing temperature (T), indicative of intensifying lattice disorder within the material. Conversely, as pressure rises, the internal lattice disruption and disorder progressively diminish, suggesting a concomitant enhancement of order. This behavior can be attributed to the opposing influences of temperature, which promotes thermal vibrations, and pressure, which serves to suppress these vibrations. Crucially, the absence of any discontinuity in the entropy–temperature curves signifies the lack of phase transitions within the investigated pressure–temperature regime. The specific entropy values for PtZrSi and PtZrGe at ambient pressure (0 GPa) and room temperature (300 K) are presented in Table 6.
3.6. Thermoelectric properties
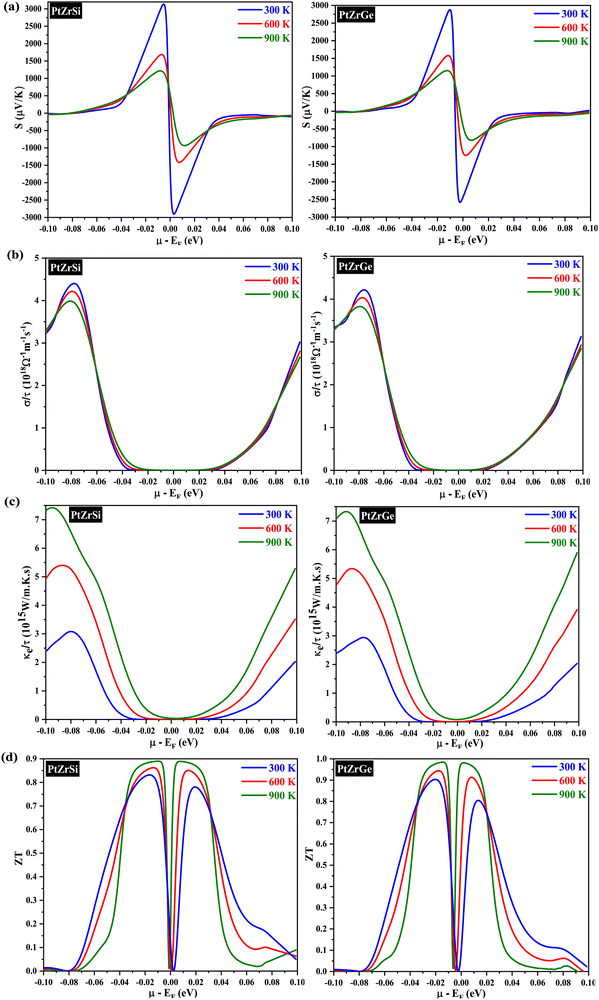
The semiclassical Boltzmann transport theory, as outlined in ref. 51, provided the foundation for calculating the thermoelectric coefficients. Computations were performed using the BoltzTraP software, a well-established tool in thermoelectric research. To assess thermoelectric properties, we employed the semi-classical Boltzmann transport theory as implemented in the BoltzTraP code. The necessary input files, including charge converged electronic structure and ground state energy, were generated using the mBJ exchange potential. This theory examines electron transport behavior within a material under the influence of electrical and thermal gradients. It incorporates scattering and interaction mechanisms between charge carriers (electrons or holes) and the crystal lattice, impurities, and other carriers. This theoretical framework offers a critical understanding for designing and engineering high-performance thermoelectric materials. BoltzTraP software is a popular computational tool that implements the semiclassical Boltzmann transport theory. It empowers researchers to design and optimize thermoelectric materials for various applications. The solution to this complex equation is achieved by applying certain simplifications. One commonly used approximation is the constant scattering time approximation, with a value of τ = 0.5 × 10⁻¹⁴ s.52 An extensive investigation of key transport parameters was conducted to meticulously evaluate the thermoelectric performance of PtZrSi and PtZrGe. These parameters included the Seebeck coefficient (S), electrical conductivity (σ), electronic thermal conductivity (κe), and figure of merit (ZT). The evaluation involved a comprehensive analysis of how these parameters varied with chemical potential (μ) at three distinct temperatures (300 K, 600 K, and 900 K). The sign of μ determines the material's electrical conductivity type: positive μ signifies p-type behavior, while negative μ indicates n-type behavior. We use a denser k-mesh (50 × 50 × 50) to ensure convergence of the thermoelectric investigations. , we discern that the Seebeck coefficient is notably influenced by the effective mass and carrier concentration. Our computational results corroborate this, demonstrating a discernible decrease in the Seebeck coefficient with increasing temperature. This phenomenon is attributed to the heightened presence of thermally excited charge carriers. This nuanced observation underscores the intricate interplay between temperature variations and thermoelectric properties, emphasizing the importance of a comprehensive understanding of these factors in the analysis of thermoelectric materials.
In Fig. 8(b), we illustrate the relationship between electrical conductivity (σ) and chemical potential for both PtZrSi and PtZrGe alloys. Notably, at room temperature, PtZrGe exhibits a substantially higher electrical conductivity (4.49 × 10¹⁸ Ω−1 m−1 s−1) compared to PtZrSi (4.34 × 10¹⁸ Ω−1 m−1 s−1). However, as the temperature rises, both materials experience an exponential decrease in electrical conductivity due to thermal collisions. The electrical conductivity (σ) of a material, as described by the equation σ = neμ (where n represents carrier concentration and μ denotes carrier mobility), is a complex interplay between the intrinsic properties of the material and external factors like temperature. While a general trend suggests an increase in electrical conductivity with rising temperature, in this instance, a counterintuitive decrease in σ is observed. This deviation from the expected behavior can be attributed to the temperature dependence of carrier mobility (μ). Carrier mobility exhibits an inverse proportionality to temperature, often expressed as μ ∝ T−3/2, due to the intensifying influence of lattice scattering. Lattice scattering, a phenomenon where charge carriers collide with the thermally excited atoms of the crystal lattice, plays a critical role in hindering carrier movement. This phenomenon underscores the intricate interplay between material properties and external stimuli, particularly the temperature dependence of carrier mobility through enhanced lattice scattering effects. A comprehensive analysis of electrical conductivity must therefore consider not only the carrier concentration but also the temperature-dependent mobility limitations imposed by lattice scattering.
The constant relaxation time approximation (CRTA) inherently hinges on the accurate determination of carrier relaxation time (τ). Recognizing this critical dependence, a meticulous investigation was conducted to ascertain τ for both compounds. This rigorous approach ensured the elimination of potential sources of uncertainty within the analysis framework. To remove this dependence, we have chosen a constant τ = 0.5 × 10⁻¹⁴ s while calculating the transport behaviour of these materials. The resultant relaxation time (τ), as illustrated in Fig. 8(c), exhibits a temperature-dependent behavior characterized by a monotonic decrease. This well-documented phenomenon can be ascribed to the intensifying frequency of carrier-collision events within the material lattice at elevated temperatures. Moreover, the electronic thermal conductivity (κe) depicted in Fig. 8(c) exhibits a notable decrease in the room temperature range followed by a gradual reduction as temperature increases. Specifically, at higher temperature (900 K), the thermal conductivity values are measured at 7.51 × 10¹⁵ W m−1 K−1 s−1 for PtZrSi and 7.23 × 10¹⁵ W m−1 K−1 s−1 for PtZrGe. All the calculated thermoelectric parameter is reported in Table 7.
| Alloys | S | Σ | κ | ZT |
|---|---|---|---|---|
| PtZrSi | 1100 | 3.91 | 7.51 | 0.89 |
| PtZrGe | 1089 | 3.76 | 7.23 | 0.98 |
Fig. 8(d) shows the dimensionless figure of merit (ZT) as a function of chemical potential, a key parameter for evaluating thermoelectric efficiency. The data indicate a significant enhancement in ZT with increasing temperature, particularly in the higher temperature range. This effect is most pronounced in PtZrSi and PtZrGe, which exhibit a substantial boost in thermoelectric performance at elevated temperatures. As temperature rises, the ZT values for both alloys progressively increase, underscoring their potential for more efficient energy conversion. At 900 K, PtZrSi and PtZrGe achieve ZT with chemical potential values of 0.89 and 0.98, respectively, highlighting their promise as highly efficient thermoelectric materials. This performance suggests their suitability for high-temperature applications, including waste heat recovery and thermoelectric power generation, where enhanced ZT values are critical for optimizing energy harvesting and conversion technologies.
![[thin space (1/6-em)]](https://www.rsc.org/images/entities/char_2009.gif) 000 points. This rigorous approach enabled precise characterization of the thermoelectric behavior of these materials, yielding critical insights into their potential for efficient energy conversion across a wide spectrum of operating temperatures.
000 points. This rigorous approach enabled precise characterization of the thermoelectric behavior of these materials, yielding critical insights into their potential for efficient energy conversion across a wide spectrum of operating temperatures.
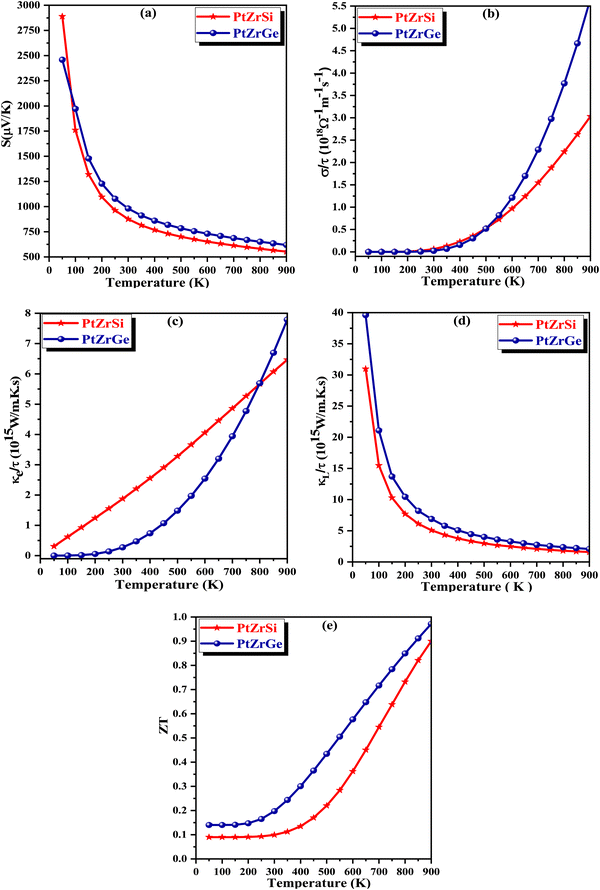
The Seebeck coefficient is a critical parameter for measuring temperature differentials across material boundaries by establishing a corresponding electrical potential. As shown in Fig. 8(a), the Seebeck coefficient (S) for PtZrSi decreases significantly from 2889.85 to 552.75 μV K−1 as the temperature increases from 50 to 900 K. Similarly, PtZrGe exhibits a decline in the Seebeck coefficient from 2458.23 to 619.08 μV K−1 over the same temperature range. This inverse relationship between the Seebeck coefficient and electrical conductivity is attributed to their strong correlation with the band gap and free carrier concentration. Semiconductors with smaller band gaps are particularly important for practical applications that require efficient thermoelectric devices. Furthermore, the Seebeck coefficient is inversely proportional to the free charge carrier concentration. This trend is evident in Fig. 9(a), where an increase in free charge carriers with rising temperature leads to a corresponding decrease in the Seebeck coefficient. Both half-Heusler (HH) alloys under study exhibit p-type behavior, consistently maintaining positive Seebeck coefficient values across the entire temperature range. This observation aligns with the electronic band structures depicted in Fig. 4, where the Fermi level is positioned near the upper edge of the valence band.
The equation σ = neμ defines electrical conductivity, where σ represents electrical conductivity, n denotes the number of charge carriers, e is the elementary charge, and μ is the electron mobility. This relationship underscores the significance of the PtZrX (X = Si, Ge) alloys for potential applications in the thermoelectric industry. As electrical conductivity is directly proportional to the charge carrier concentration, an increase in the number of carriers leads to a corresponding rise in electrical conductivity. In thermoelectric devices, high electrical conductivity is a desirable trait, as it helps minimize Joule heating, thereby enhancing the efficiency of the device. Fig. 9(b) illustrates the predicted electrical conductivity for PtZrX alloys across a temperature range of 50–900 K. The results indicate a steady increase in electrical conductivity with rising temperature, reaching peak values of 3.03 × 10¹⁸ Ω−1 m−1 s−1 for PtZrSi and 5.65 × 10¹⁸ Ω−1 m−1 s−1 for PtZrGe at 900 K. This significant increase in electrical conductivity can be attributed to the intrinsic properties of the alloys, particularly their low electronic resistivity (ρ = 1/σ), which plays a crucial role in enhancing the thermoelectric performance. The strong temperature dependence of electrical conductivity in these materials highlights their potential for high-efficiency thermoelectric applications, where the balance between electrical conductivity and thermal properties is critical for optimizing device performance.
Thermal conduction in materials occurs through two primary mechanisms: electron conduction and phonon conduction. These contributions are represented by the equation κ = κe + κL, where κe denotes the electronic thermal conductivity and κL represents the lattice (phonon) thermal conductivity. However, due to the limitations inherent in the classical theory-based BoltzTraP code, our present calculations were confined to the electronic component of thermal conductivity, neglecting lattice thermal conductivity. The lattice thermal conductivity is calculated by Slack's model. Fig. 9(c) illustrates the calculated electronic thermal conductivity for the PtZrSi and PtZrGe alloys over a temperature range of 300 to 900 K. The results show a linear increase in electronic thermal conductivity with temperature. For PtZrSi, the values rise from 1.81 to 6.46 × 10¹⁵ W m−1 K−1 s−1, while for PtZrGe, the conductivity escalates from 0.27 to 7.78 × 10¹⁵ W m−1 K−1 s−1, across the same temperature range. This increase in electronic thermal conductivity with temperature can be attributed to the enhanced mobility of charge carriers at higher temperatures, which is a critical factor in thermoelectric materials. However, it is important to note that the overall thermal conductivity of these materials would also include the lattice contribution, which plays a significant role in determining the efficiency of thermoelectric devices. The absence of the lattice component in our current calculations may result in an underestimation of the total thermal conductivity. The focus on electronic thermal conductivity is particularly relevant for optimizing thermoelectric performance, as it directly influences the material's ability to convert heat into electrical energy. Nonetheless, future work should incorporate lattice thermal conductivity to provide a more comprehensive understanding of the thermal transport properties of these materials, ensuring more accurate predictions of their thermoelectric efficiency.
In this section, we analyze the thermoelectric properties of our materials by estimating the lattice thermal conductivity (κL). Understanding thermal conductivity is essential for evaluating a material's ability to conduct heat, as it is closely linked to atomic vibrations and electrical conductivity, both of which significantly impact thermoelectric performance. Lattice thermal conductivity (κL) can be controlled and optimized through various approaches. In our study, we apply Slack's model, which is particularly effective for achieving low thermal conductivity by focusing on the acoustic phonon modes that are critical for heat transfer in semiconductors. Slack's model is described by the following equation:
The performance of a thermoelectric material is primarily determined by its figure of merit, ZT, which is a critical indicator of efficiency based on its transport properties. ZT is a dimensionless quantity defined as
3.7. Optical properties
A comprehensive understanding of a material's optical properties is crucial for assessing its suitability in various technological applications, particularly within the domain of photovoltaics and other optoelectronic devices. The complex dielectric tensor, ε(ω), serves as a cornerstone in elucidating the intricate interplay between a material's response to incident light and the light's photon energy. This mathematical framework, established by Ehrenreich and Cohen,55 offers a rigorous description of how a material interacts with electromagnetic radiation. The dielectric tensor, as expressed by the equation ε(ω) = ε1(ω) + iε2(ω),56 encompasses two essential components: ε1(ω) characterizes the material's polarization response, while ε2(ω) quantifies its light absorption behavior. The symbol ω denotes the angular frequency of the incident electromagnetic radiation.The determination of the real component of the dielectric function, ε1(ω), is facilitated by employing the Kramers–Kronig equation.
The optical properties of the equilibrium structure have been meticulously analyzed in relation to the energy of incident electromagnetic (EM) radiation, as delineated in Fig. 10(a–d). In Fig. 10(a), the variation of ε1(ω) for PtZrX is depicted with respect to the incident radiation's energy. The determined static dielectric constant, ε1(0), stands at 2.11, indicating a notable responsiveness to EM radiation. Examination of Fig. 10(a) reveals a progressive increase in ε1(ω) with escalating energy until it reaches its apex at 4.52 eV, followed by a subsequent decline before attaining another peak at 6.51 eV. Further observations indicate negative values of ε1(ω) beyond 11 eV, with a slight resurgence towards zero. The observed peaks in the imaginary part of the dielectric function ε2(ω) indicate strong light absorption within the visible and near-ultraviolet (UV) regions of the electromagnetic spectrum. This characteristic suggests that PtZrX is a promising candidate for applications involving light interaction within these specific wavelengths. Additionally, the negative value of the dielectric constant points towards a conductive nature for PtZrX. This conductivity makes it potentially suitable for various optoelectronic devices, including super lenses, optical fibres, filters, and electromagnetic shielding devices.
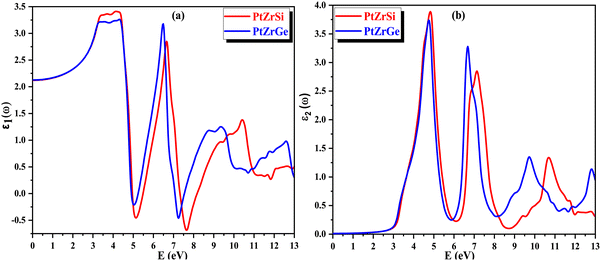 | ||
| Fig. 10 (a) and (b) The variation of (a) real part of dielectric function ε1(ω) and (b) imaginary part of dielectric constant ε2(ω) with energy for PtZrX (X = Si, Ge). | ||
In Fig. 10(b), the imaginary component of the complex dielectric function, ε2(ω), for PtZrX compounds (X = Si, Ge) is presented. The function ε2(ω) is instrumental in analyzing the electronic transitions that occur between the unoccupied conduction band and the occupied valence band, thereby providing insight into how these materials interact with incident electromagnetic radiation. For PtZrSi, the ε2(ω) function exhibits a notable peak at 4.86 eV, indicating a strong electronic transition at this energy level. A second significant peak is observed at 7.23 eV, beyond which there is a marked decline in the ε2(ω) value, suggesting reduced absorption at higher photon energies. Similarly, in the case of PtZrGe, a sharp peak appears at 4.51 eV, followed by another substantial peak at 6.47 eV, with the ε2(ω) value decreasing thereafter. These peaks in the ε2(ω) function correspond to the energy levels where electronic transitions are most likely to occur, thus reflecting the materials' absorption characteristics. The decline in ε2(ω) beyond the peak energies indicates a decrease in the probability of such transitions at higher photon energies. Furthermore, when examining PtZrX alloys (X = Si, Ge), the imaginary part of the dielectric function reveals significant absorption within the visible spectrum. This suggests that these materials have strong potential for application in areas requiring effective interaction with visible light, such as in optoelectronic devices. The detailed analysis of ε2(ω) provides critical insights into the optical properties of these materials, particularly their electronic transition dynamics and absorption profiles, which are crucial for the development of advanced materials for electronic and photonic applications.
The refractive index, denoted as n(ω), plays a pivotal role in assessing a material's transparency and its ability to refract light. This parameter offers essential insights into semiconductors, elucidating the degree of light deflection or refraction. Fig. 11(a) illustrates the correlation of the refractive index with the energy of incident radiation. For PtZrSi and PtZrGe, the static value of n(ω) is established at 1.47 and 1.48. This value escalates with increasing energy of electromagnetic (EM) radiation, notably within the infrared (IR) range, peaking in the near ultraviolet (UV) region. Although exhibiting relatively lower peaks in the far UV region, the refractive index consistently remains positive, affirming the material's transparency. Furthermore, as the energy of incident radiation escalates further, n(ω) gradually diminishes but retains positive values throughout, indicating the material's transparency across the energy spectrum. This behavior underscores the isotropic nature of the investigated materials, implying consistent optical properties irrespective of directionality.
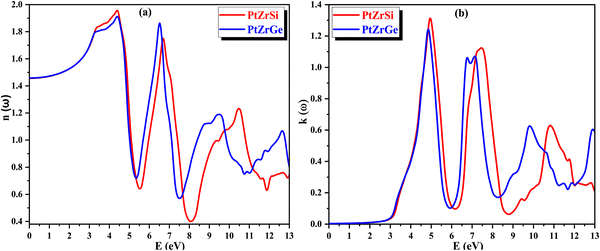 | ||
| Fig. 11 (a) and (b) The variation of (a) refractive index n(ω) and (b) extinction coefficient k(ω) with energy for PtZrX (X = Si, Ge). | ||
In Fig. 11(b), the extinction coefficient k(ω) signifies the decrease in the intensity of electric vector's oscillations of incident radiation with varying energy levels. This parameter is intricately linked to light absorption and mirrors the behavior of ε1(ω), the real part of the dielectric function. Notably, the peak value of k(ω) coincides precisely with the point where ε1(ω) reaches zero. This alignment signifies a crucial transition in the material's optical behavior, suggesting a significant shift in its interaction with incident radiation.
The absorption coefficient α(ω) offers valuable insights into the material's capacity to absorb incident radiation per unit thickness, thus serving as a crucial indicator of its efficiency in solar power conversion and providing an understanding of how deeply specific energy penetrates the compound. The variation of α(ω) with respect to the energy of incident radiation is depicted in Fig. 12(a), shedding light on the compound's response to electromagnetic radiation. Furthermore, through the conduction of photoelectrons, α(ω) yields significant information about the perturbation of chemical bonds within the compound induced by its interaction with electromagnetic radiation.
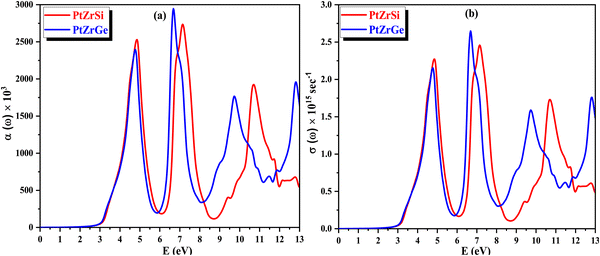 | ||
| Fig. 12 (a) and (b) The variation of (a) absorption coefficient α(ω) and (b) optical conductivity σ(ω) with energy for PtZrX (X = Si, Ge). | ||
In Fig. 12(b), the spectra of optical conductivity, denoted as σ(ω), are presented for various incident radiation energies, showcasing four discernible peaks, with the highest intensity observed at 7.00 eV for PtZrSi and 7.45 for PtZrGe. Importantly, a notable correlation emerges between optical conductivity and absorption, with both exhibiting peaks and troughs in comparable energy regions. This coherence underscores the fidelity of the theoretical framework and underscores the accuracy of the computational predictions. Furthermore, the optical reflectivity parameter R(ω) assumes significance, delineating the ratio of incident energy to reflected energy. This parameter provides crucial insights into the compound's optical response and its interaction dynamics with electromagnetic radiation.
In Fig. 13(a), the change in reflectivity R(ω) relative to the incident energy is depicted. The static reflectivity value, represented as R(0), is found to be 34.98% for PtZrSi and 26.58% for PtZrGe. Notably, peaks in reflectivity are observed in the ultraviolet (UV) spectrum, with the highest reflectivity observed in the far UV range within the specified incident radiation range of 0–13 eV. This indicates the potential of the studied materials to serve as shields against far UV radiation, while also demonstrating efficacy for photovoltaic applications in the visible and near UV regions.
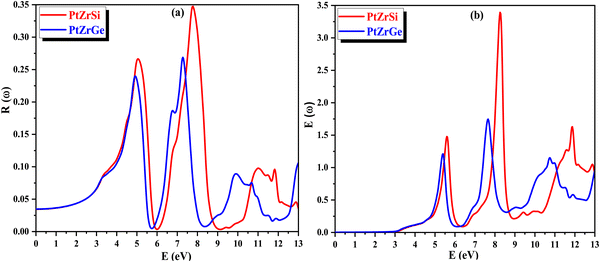 | ||
| Fig. 13 (a) and (b) The variation of (a) reflectivity R(ω) and (b) energy loss E(ω) with energy for PtZrX (X = Si, Ge). | ||
The energy loss function E(ω) characterizes the dissipation of energy experienced by mobile electrons within a material. In Fig. 13(b), its response to varying incident radiation energy is illustrated. Noteworthy are the peaks observed in the energy loss function, which correspond to the plasma resonance of valence electrons and the plasma frequency (ωP). These peaks demonstrate an increase in magnitude with higher energy levels across the spectrum, particularly evident beyond 6 eV. These values emphasize the potential applicability of the investigated material in optical devices.
4. Conclusion
In conclusion, this comprehensive first-principles investigation, employing density functional theory (DFT) within the WIEN2k code, unveils PtZrSi and PtZrGe as promising candidates for multifunctional applications. The investigation encompasses a thorough examination of their mechanical, electronic, optical, and thermoelectric properties. The materials exhibit a unique combination of anisotropic yet elastically stable mechanics, alongside indirect bandgap semiconducting behavior with favourable bandgaps (1.43 eV for PtZrSi and 1.32 eV for PtZrGe). The calculated standard enthalpy of formation further reinforces their thermodynamic stability. PtZrSi demonstrates superior stiffness compared to PtZrGe, while both possess intriguing optoelectronic properties as evidenced by the analysis of the dielectric function and optical spectra. Moreover, this research suggests their potential as efficient thermal insulators for solar heating applications. Finally, the temperature-dependent thermoelectric properties computed using the BoltzTrap code provide valuable insights into their candidacy for thermoelectric device development. Overall, this study offers a comprehensive understanding of the material characteristics of PtZrX alloys, positioning them for exploration in advanced technological applications.Author contributions
Bharti Gurunani: writing – review & editing, writing – original draft, methodology. Dinesh C. Gupta: supervision, software.Data availability
The data that support the findings of this study are available from the corresponding author upon reasonable request.Funding
This research work is not funded by any agency.Conflicts of interest
The authors declare that they have no known competing financial interests or personal relationships that could have appeared to influence the work reported in this paper.References
- G. B. Stringfellow, Thermodynamic considerations for epitaxial growth of III/V alloys, J. Cryst. Grow., 2017, 468, 11–16 CrossRef CAS.
- T. Graf, C. Felser and S. S. Parkin, Simple rules for the understanding of Heusler compounds, Prog. Solid State Chem., 2011, 39(1), 1–50 CrossRef CAS.
- J. Yang, H. Li, T. Wu, W. Zhang, L. Chen and J. Yang, Evaluation of half-Heusler compounds as thermoelectric materials based on the calculated electrical transport properties, Adv. Funct. Mater., 2008, 18(19), 2880–2888 CrossRef CAS.
- A. Zakutayev, X. Zhang, A. Nagaraja, L. Yu, S. Lany, T. O. Mason and A. Zunger, Theoretical prediction and experimental realization of new stable inorganic materials using the inverse design approach, J. Am. Chem. Soc., 2013, 135(27), 10048–10054 CrossRef CAS PubMed.
- J. Carrete, W. Li, N. Mingo, S. Wang and S. Curtarolo, Finding unprecedentedly low-thermal-conductivity half-Heusler semiconductors via high-throughput materials modeling, Phys. Rev. X, 2014, 4(1), 011019 CAS.
- I. Opahle, G. K. Madsen and R. Drautz, High throughput density functional investigations of the stability, electronic structure and thermoelectric properties of binary silicides, Phys. Chem. Chem. Phys., 2012, 14(47), 16197–16202 RSC.
- I. Opahle, G. K. Madsen and R. Drautz, High throughput density functional investigations of the stability, electronic structure and thermoelectric properties of binary silicides, Phys. Chem. Chem. Phys., 2012, 14(47), 16197–16202 RSC.
- A. Page, C. Uher, P. F. Poudeu and A. Van der Ven, Phase separation of full-Heusler nanostructures in half-Heusler thermoelectrics and vibrational properties from first-principles calculations, Phys. Rev. B: Condens. Matter Mater. Phys., 2015, 92(17), 174102 CrossRef.
- G. H. Fecher, E. Rausch, B. Balke, A. Weidenkaff and C. Felser, Half-Heusler materials as model systems for phase-separated thermoelectrics, Phys. Status Solidi A, 2016, 213(3), 716–731 CrossRef CAS.
- Q. Gao, I. Opahle and H. Zhang, High-throughput screening for spin-gapless semiconductors in quaternary Heusler compounds, Phys. Rev. Mater., 2019, 3(2), 024410 CrossRef CAS.
- G. Chang, S. Y. Xu, H. Zheng, B. Singh, C. H. Hsu, G. Bian and M. Z. Hasan, Room-temperature magnetic topological Weyl fermion and nodal line semimetal states in half-metallic Heusler Co2TiX (X= Si, Ge, or Sn), Sci. Rep., 2016, 6(1), 38839 CrossRef CAS PubMed.
- H. Xiao, T. Hu, W. Liu, Y. L. Zhu, P. G. Li, G. Mu and Z. Q. Mao, Superconductivity in the half-Heusler compound TbPdBi, Phys. Rev. B, 2018, 97(22), 224511 CrossRef CAS.
- K. Kaur and R. Kumar, Giant thermoelectric performance of novel TaIrSn Half Heusler compound, Phys. Lett. A, 2017, 381(44), 3760–3765 CrossRef CAS.
- S. A. Khandy, I. Islam, D. C. Gupta and A. Laref, Full Heusler alloys (Co2TaSi and Co2TaGe) as potential spintronic materials with tunable band profiles, J. Solid State Chem., 2019, 270, 173–179 CrossRef CAS.
- I. Galanakis, K. Özdoğan and E. Şaşıoğlu, Spin-filter and spin-gapless semiconductors: The case of Heusler compounds, AIP Adv., 2016, 6(5), 1–14 Search PubMed.
- X. Zhang, L. Yu, A. Zakutayev and A. Zunger, Sorting stable versus unstable hypothetical compounds: the case of multi-functional ABX half-heusler filled tetrahedral structures, Adv. Funct. Mater., 2012, 22(7), 1425–1435 CrossRef CAS.
- A. Page, C. Uher, P. F. Poudeu and A. Van der Ven, Phase separation of full-Heusler nanostructures in half-Heusler thermoelectrics and vibrational properties from first-principles calculations, Phys. Rev. B: Condens. Matter Mater. Phys., 2015, 92(17), 174102 CrossRef.
- B. Gurunani and D. C. Gupta, Exploring the electronic structure, mechanical behaviour, thermal and high-temperature thermoelectric response of CoZrSi and CoZrGe Heusler alloys, Sci. Rep., 2023, 13(1), 22834 CrossRef CAS PubMed.
- K. Kaur and R. Kumar, Ti based half Heusler compounds: A new on the screen with robustic thermoelectric performance, J. Alloys Compd., 2017, 727, 1171–1177 CrossRef CAS.
- C. Fu, T. Zhu, Y. Liu, H. Xie and X. Zhao, Band engineering of high-performance p-type FeNbSb based half-Heusler thermoelectric materials for figure of merit zT> 1, Energy Environ. Sci., 2015, 8(1), 216–220 RSC.
- R. He, D. Kraemer, J. Mao, L. Zeng, Q. Jie, Y. Lan and Z. Ren, Achieving high power factor and output power density in p-type half-Heuslers Nb1-xTixFeSb, Proc. Natl. Acad. Sci. U. S. A., 2016, 113(48), 13576–13581 CrossRef CAS PubMed.
- S. Chen, K. C. Lukas, W. Liu, C. P. Opeil, G. Chen and Z. Ren, Effect of Hf concentration on thermoelectric properties of nanostructured n-type half-heusler materials HfxZr1–xNiSn0. 99Sb0. 01, Adv. Energy Mater., 2013, 3(9), 1210–1214 CrossRef CAS.
- Y. W. Chai, T. Oniki and Y. Kimura, Microstructure and thermoelectric properties of a ZrNi1. 1Sn half-Heusler alloy, Acta Mater., 2015, 85, 290–300 CrossRef CAS.
- X. Yan, W. Liu, S. Chen, H. Wang, Q. Zhang, G. Chen and Z. Ren, Thermoelectric property study of nanostructured p-type half-Heuslers (Hf, Zr, Ti) CoSb0. 8Sn0. 2, Adv. Energy Mater., 2013, 3(9), 1195–1200 CrossRef CAS.
- S. A. Khandy, K. Kaur, S. Dhiman, J. Singh and V. Kumar, Exploring thermoelectric properties and stability of half-Heusler PtXSn (X = Zr, Hf) semiconductors: a first principle investigation, Comput. Mater. Sci., 2021, 188, 110232 CrossRef.
- C. Fu, T. Zhu, Y. Pei, H. Xie, H. Wang, G. J. Snyder, Y. Liu, Y. Liu and X. Zhao, High band degeneracy contributes to high thermoelectric performance in p-type half Heusler compounds, Adv. Energy Mater., 2014, 4, 1400600 CrossRef.
- B. Gurunani, S. Ghosh and D. C. Gupta, Comprehensive investigation of half Heusler alloy: Unveiling structural, electronic, magnetic, mechanical, thermodynamic, and transport properties, Intermetallics, 2024, 170, 108311 CrossRef CAS.
- B. Kong, X. R. Chen, J. X. Yu and C. L. Cai, Structural, elastic properties and pressure-induced phase transition of ‘half-Heusler ‘alloy CoVSb, J. Alloys Compd., 2011, 509(5), 2611–2616 CrossRef CAS.
- H. Zhao, J. Sui, Z. Tang, Y. Lan, Q. Jie, D. Kraemer and Z. Ren, High thermoelectric performance of MgAgSb-based materials, Nano Energy, 2014, 7, 97–103 CrossRef CAS.
- G. Rogl, A. Grytsiv, M. Gürth, A. Tavassoli, C. Ebner, A. Wünschek and P. Rogl, Mechanical properties of half-Heusler alloys, Acta Mater., 2016, 107, 178–195 CrossRef CAS.
- E. Rausch, B. Balke, S. Ouardi and C. Felser, Long-Term Stability of (Ti/Zr/Hf) CoSb1− xSnx Thermoelectric p-Type Half-Heusler Compounds Upon Thermal Cycling, Energy Technol., 2015, 3(12), 1217–1224 CrossRef CAS.
- G. Rogl, P. Sauerschnig, Z. Rykavets, V. V. Romaka, P. Heinrich, B. Hinterleitner and P. Rogl, V, Nb)-doped half Heusler alloys based on {Ti, Zr, Hf} NiSn with high ZT, Acta Mater., 2017, 131, 336–348 CrossRef CAS.
- M. Yin and P. Nash, Standard enthalpies of formation of selected XYZ half-Heusler compounds, J. Chem. Thermodyn., 2015, 91, 1–7 CrossRef CAS.
- P. Giannozzi, S. Baroni, N. Bonini, M. Calandra, R. Car, C. Cavazzoni and R. M. Wentzcovitch, QUANTUM ESPRESSO: a modular and open-source software project for quantum simulations of materials, J. Phys.: Condens. Matter, 2009, 21, 395502 CrossRef PubMed.
- P. Blaha, K. Schwarz, G. K. Madsen, D. Kvasnicka and J. Luitz, wien2k. An augmented plane wave+ local orbitals program for calculating crystal properties, 2001, 60, 1.
- J. P. Perdew and Y. Wang, Accurate and simple analytic representation of the electron-gas correlation energy, Phys. Rev. B: Condens. Matter Mater. Phys., 1992, 45(23), 13244 CrossRef PubMed.
- F. Tran and P. Blaha, Accurate band gaps of semiconductors and insulators with a semilocal exchange-correlation potential, Phys. Rev. Lett., 2009, 102(22), 226401 CrossRef PubMed.
- F. Birch, Finite elastic strain of cubic crystals, Phys. Rev., 1947, 71(11), 809 CrossRef CAS.
- G. K. Madsen and D. J. Singh, BoltzTraP. A code for calculating band-structure dependent quantities, Comput. Phys. Commun., 2006, 175(1), 67–71 CrossRef CAS.
- B. Gurunani and D. C. Gupta, Exploring the multifaceted properties: structural, electronic, magnetic, mechanical, thermodynamic, transport, and optical characteristics of rhodium-based half-Heusler alloys, J. Mater. Sci., 2024, 1–24 Search PubMed.
- A. Otero-de-la-Roza, D. Abbasi-Pérez and V. Luaña, Gibbs2: A new version of the quasiharmonic model code. II. Models for solid-state thermodynamics, features and implementation, Comput. Phys. Commun., 2011, 182(10), 2232–2248 CrossRef CAS.
- P. K. Kamlesh, R. Agrawal, U. Rani and A. S. Verma, Comprehensive ab-initio calculations of AlNiX (X= P, As and Sb) half-Heusler compounds: stabilities and applications as green energy resources, Mater. Chem. Phys., 2022, 275, 125233 CrossRef CAS.
- P. K. Kamlesh, R. Gautam, S. Kumari and A. S. Verma, Investigation of inherent properties of XScZ (X= Li, Na, K; Z= C, Si, Ge) half-Heusler compounds: appropriate for photovoltaic and thermoelectric applications, Phys. B, 2021, 615, 412536 CrossRef CAS.
- H. Zhang, M. P. J. Punkkinen, B. Johansson, S. Hertzman and L. Vitos, Single-crystal elastic constants of ferromagnetic bcc Fe-based random alloys from first-principles theory, Phys. Rev. B: Condens. Matter Mater. Phys., 2010, 81(18), 184105 CrossRef.
- M. Born, On the stability of crystal lattices. I, Math. Proc. Cambridge Philos. Soc., 1940, 36(2), 160–172 CrossRef CAS.
- S. F. Pugh, Te London, Edinburgh, and Dublin, Philos. Mag. J. Sci., 1954, 45(367), 823–843 CrossRef CAS.
- A. P. Sakhya, Electronic structure and elastic properties of ATiO3 (A = Ba, Sr, Ca) perovskites: A first principles study, Indian J. Pure Appl. Phys., 2015, 53(2), 102–109 Search PubMed.
- S. I. Ranganathan and M. Ostoja-Starzewski, Universal elastic anisotropy index, Phys. Rev. Lett., 2008, 101(5), 055504 CrossRef PubMed.
- N. Korozlu, K. Colakoglu, E. Deligoz and G. O. K. H. A. N. Surucu, First-principles study of structural, elastic, lattice dynamical and thermodynamical properties of GdX (X= Bi, Sb), Philos. Mag., 2010, 90(14), 1833–1852 CrossRef CAS.
- I. N. Frantsevich, F. F. Voronov and S. A. Bokuta, Elastic constants and elastic moduli of metals and insulators handbook, 1983, pp. 60–180 Search PubMed.
- K. Brugger, Determination of third-order elastic coefficients in crystals, J. Appl. Phys., 1965, 36(3), 768–773 CrossRef.
- D. C. Gupta, Quaternary Heusler alloys a future perspective for revolutionizing conventional semiconductor technology, J. Alloys Compd., 2021, 871, 159560 CrossRef.
- B. Gurunani and D. C. Gupta, Tailoring the intrinsic magneto-electronic, mechanical, thermo-physical and thermoelectric response of cobalt-based Heusler alloys: an ab initio insight, RSC Adv., 2023, 13(43), 29959–29974 RSC.
- S. Yousuf and D. C. Gupta, Thermoelectric response of ZrNiSn and ZrNiPb Half-Heuslers: Applicability of semi-classical Boltzmann transport theory, Results Phys., 2019, 12, 1382–1386 CrossRef.
- S. Singh, T. M. Bhat and D. C. Gupta, Effect of High Pressure and Temperature on Magneto-Electronic, Thermodynamic, and Transport Properties of Antiferromagnetic HoPdX (X= As, Ge) Alloys, J. Supercond. Novel Magn., 2019, 32, 2051–2065 CrossRef CAS.
- T. M. Bhat and D. C. Gupta, Analysis of electronic, thermal, and thermoelectric properties of the half-Heusler CrTiSi material using density functional theory, J. Phys. Chem. Solids, 2018, 119, 281–287 CrossRef CAS.
| This journal is © The Royal Society of Chemistry 2024 |

