Scaffold hopping based designing of selective ALDH1A1 inhibitors to overcome cyclophosphamide resistance: synthesis and biological evaluation†
Gera
Narendra
a,
Baddipadige
Raju
a,
Himanshu
Verma
a,
Manoj
Kumar
a,
Subheet Kumar
Jain
b,
Gurleen Kaur
Tung
c,
Shubham
Thakur
b,
Rasdeep
Kaur
d,
Satwinderjeet
Kaur
d,
Bharti
Sapra
a and
Om
Silakari
 *a
*a
aDepartment of Pharmaceutical Sciences and Drug Research, Punjabi University, Patiala, Punjab 147002, India. E-mail: mmlpup73@gmail.com; Fax: +91 17522 83075; Tel: +91 95015 42696
bDepartment of Pharmaceutical Sciences, Guru Nanak Dev University, Amritsar, India
cCentre for Basic and Translational Research in Health Sciences, Guru Nanak Dev University, Amritsar, India
dDepartment of Botany and Environmental Sciences, Guru Nanak Dev University, Amritsar, India
First published on 30th November 2023
Abstract
Aldehyde dehydrogenase 1A1 (ALDH1A1) is an isoenzyme that catalyzes the conversion of aldehydes to acids. However, the overexpression of ALDH1A1 in a variety of malignancies is the major cause of resistance to an anti-cancer drug, cyclophosphamide (CP). CP is a prodrug that is initially converted into 4-hydroxycyclophosphamide and its tautomer aldophosphamide, in the liver. These compounds permeate into the cell and are converted as active metabolites, i.e., phosphoramide mustard (PM), through spontaneous beta-elimination. On the other hand, the conversion of CP to PM is diverted at the level of aldophosphamide by converting it into inactive carboxyphosphamide using ALDH1A1, which ultimately leads to high drug inactivation and CP resistance. Hence, in combination with our earlier work on the target of resistance, i.e., ALDH1A1, we hereby report selective ALDH1A1 inhibitors. Herein, we selected a lead molecule from our previous virtual screening and implemented scaffold hopping analysis to identify a novel scaffold that can act as an ALDH1A1 inhibitor. This results in the identification of various novel scaffolds. Among these, on the basis of synthetic feasibility, the benzimidazole scaffold was selected for the design of novel ALDH1A1 inhibitors, followed by machine learning-assisted structure-based virtual screening. Finally, the five best compounds were selected and synthesized. All synthesized compounds were evaluated using in vitro enzymatic assay against ALDH1A1, ALDH2, and ALDH3A1. The results disclosed that three molecules A1, A2, and A3 showed significant selective ALDH1A1 inhibitory potential with an IC50 value of 0.32 μM, 0.55 μM, and 1.63 μM, respectively, and none of the compounds exhibits potency towards the other two ALDH isoforms i.e. ALDH2 and ALDH3A1. Besides, the potent compounds (A1, A2, and A3) have been tested for in vitro cell line assay in combination with mafosfamide (analogue of CP) on two cell lines i.e. A549 and MIA-PaCa-2. All three compounds show significant potency to reverse mafosfamide resistance by inhibiting ALDH1A1 against these cell lines.
1. Introduction
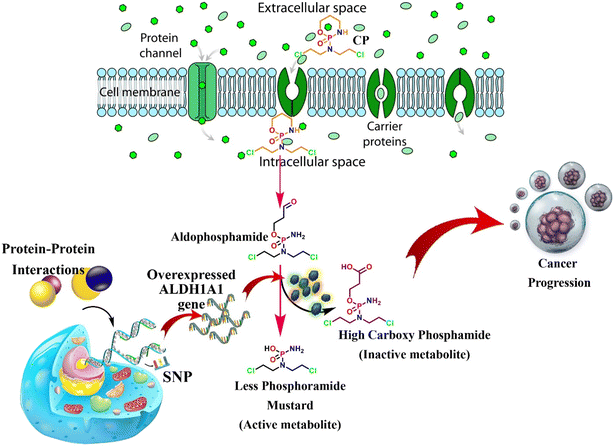
Aldehyde dehydrogenases (ALDHs) are NAD(P)+-dependent isoenzymes that catalyze the conversion of various exogenous and endogenous aldehydes such as retinaldehyde, acetaldehyde, neurotransmitters, carbohydrates, and lipids to their corresponding carboxylic acids.1 In addition, the aberrant biological activity of ALDHs is involved in various disease conditions, like alcohol liver disease, cancers, etc.2 The overexpression of certain ALDHs, especially ALDH1A1, is associated with anti-cancer drug resistance. For instance, cyclophosphamide (CP) is an alkylating agent undergoing inactivation using ALDH1A1 and is consequently linked to resistance.3 CP is majorly used to treat lymphoma, ovarian cancer, breast cancer, small cell lung cancer, leukemia, and multiple myeloma.4 CP is a prodrug that is metabolized to 4-hydroxycyclophosphamide (4-OH CP) and subsequently to its tautomer i.e., aldophosphamide. Then, it is converted to active metabolites i.e., phosphoramide mustard (PM) through spontaneous β-elimination. However, as shown in Fig. 1, the conversion of CP to PM is diverted at the level of aldophosphamide by converting it into inactive carboxyphosphamide using tumoral overexpressed ALDH1A1.5,6 This ultimately leads to chemoresistance and tumor relapse.6 Various mechanisms are responsible for the overexpression of ALDH1A1 in tumor cells, including protein–protein interactions, genetic variations, and transcription factors.7,8 The detailed mechanism of ALDH1A1 overexpression is also depicted in the following (Fig. 1). There is substantial evidence in the piece of literature that knocking down ALDH1A1 has been shown to sensitize chemotherapy. For instance, inhibition of ALDH1A1 activity in murine pluripotent hematopoietic stem cells and myeloid progenitor cells correlates with increased in vitro sensitivity to 4-OH CP.9 In addition, it has been reported that the knockdown of ALDH1A1 is associated with a remarkable reduction in chemoresistance in ovarian cancer cells.10 Thus, ALDH1A1 is a therapeutic target for improving the quality of cancer treatment among patients suffering from ALDH1A1-mediated drug resistance.In the present study, benzimidazole-based ALDH1A1 inhibitors were designed using the lead molecule obtained from our previous studies. Earlier, we performed a machine learning (ML) assisted docking-based virtual screening of three large databases, including ChemBridge, Maybridge, and Natural Product and Natural Product-like Compound Library from the Life Chemicals database.11 As a result, a theophylline-based selective ALDH1A1 inhibitor was obtained. Similar kinds of theophylline scaffolds were already reported as selective ALDH1A1 inhibitors by Yang et al.2 So, theophylline derivatives were used for scaffold hopping experiments to design novel selective ALDH1A1 inhibitors. Then, the designed molecules were further subjected to other in silico studies, such as molecular docking, molecular dynamics (MD), and energy calculations. Finally, the obtained best compounds were synthesized, and in vitro enzymatic and cell line investigations were performed.
2. Materials & methods
2.1. Scaffold hopping and designing
In the present study, a bioisostere and fragment replacement tool (Spark; Cresset) was used to create novel compounds with ALDH1A1 inhibitory action.12 The compound 8-((4-(cyclopropanecarbonyl)piperazin-1-yl)methyl-7-isopentyl-1,3-dimethyl-3,7-dihydro-1H-purine-2,6-dione) (the molecule obtained from our previous VS study)11 was explored as a reference molecule to perform scaffold hopping. Herein, the theophylline portion of the molecule was studied for bioisosteric replacement. The generated scaffolds were anticipated to resemble a theophylline moiety and the same mode of action towards ALDH1A1. The obtained novel scaffolds were analyzed based on their field similarity and shape similarity scores. Then, the designed molecules were further subjected to a strategy that combined virtual screening with biological evaluation. The screening technique was carried out in the same way as in our previous study.2.2. Virtual screening
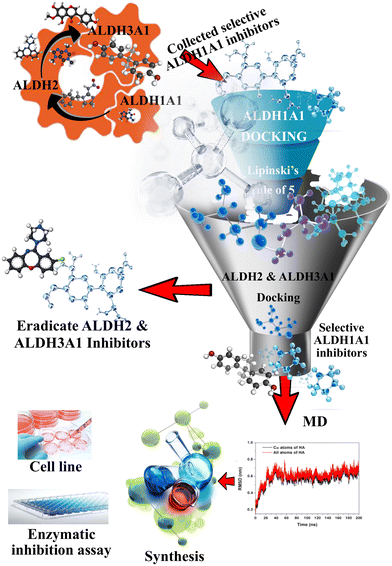
Initially, the previously reported ALDH1A1 ML model was utilized to screen a set of chemical libraries.11 Subsequently, the compounds acquired as ALDH1A1 inhibitors were then subjected to screening against ALDH2 and ALDH3A1 models. The compounds identified as ALDH2 and ALDH3A1 inhibitors were removed, while compounds identified as non-inhibitors were considered selective ALDH1A1 inhibitors. Later, the obtained molecules were further analyzed with molecular docking studies using the Flare module in the Cresset software.13 The PDB ID 4X4L was selected based on our earlier cross-docking studies.11 The mentioned protein was prepared using the Flare module by following the insertion of missing atoms in incomplete residues, modeling the missing loops, removal of co-crystallized water, and protonation of the residues by applying an XED force field. The grid is generated by defining the binding location around the centroid of the co-crystallized ligand. Finally, using BioMolTech's Lead Finder, docking was performed at the active site of the protein.14 The compounds that show greater docking scores compared to the co-crystallized ligand were further considered for ADME screening using SwissADME, a freely available online tool.15 Then, MD studies were carried out to know the stability of the docking poses.2.3. Molecular dynamics
MD simulations have become increasingly important in the context of understanding the interactions between ligands and receptors. Therefore, an extensive 100 ns MD simulation was performed to assess the stability and binding affinities in the active site of the ALDH1A1 protein. Initially, each ligand–receptor complex was embedded in a water box with 10 Å dimensions. The TIP3P water model was used to solvate the ligand biomolecular complexes enclosed in an orthorhombic cage with a 10 Å dimensions. Then, the protein–ligand system was subjected to the AMBER force field in Flare for energy minimization. After the system had been minimized, 50 ns MD simulations were run under an NPT ensemble with a temperature of 300 K and recording intervals of 2 ps. The binding orientations of the ligands within the active site of the protein, as well as the root mean square deviation (RMSD), were analyzed from MD trajectories.2.4. WaterSwap
The absolute binding free energy was determined using WaterSwap analysis. It was carried out in Cresset Flare software13 to compare the binding affinity of the designed compounds towards ALDH1A1. A Monte Carlo (MC) simulation tool was used to analyze how strongly ligands and proteins interact with each other. WaterSwap uses condensed-phase simulations using the AMBER force field to calculate the absolute protein–ligand binding free energies. The starting conformation for WaterSwap was selected as the final conformation obtained after MD simulations. It works by replacing the ligand bound to the protein with bulk water of comparable form and volume. After that, three alternative approaches are used to compute the binding free energy: thermodynamics integration (TI), Bennett, and free energy perturbation (FEF). The arithmetic means of Bennett, TI, and FEP binding free energies have been used to calculate the total binding energy.2.5. Synthesis
Chemicals and solvents used for the synthesis were purchased from LOBA Chemicals, Sigma Aldrich, and S.D Fine Laboratories, and were of analytical grade. The progress of the reactions was monitored using thin-layer chromatography on pre-coated silica gel aluminum plates using pet ether/ethyl acetate in a 7![[thin space (1/6-em)]](https://www.rsc.org/images/entities/char_2009.gif) :
:![[thin space (1/6-em)]](https://www.rsc.org/images/entities/char_2009.gif) 3 ratio as a mobile phase. TLC was performed using these mentioned solvent systems and later visualized in a UV chamber. The purification of the synthesized molecules was performed using column chromatography (mesh size: 60–120). The capillary method was used to determine each compound's melting point. A Bruker Advance Neo 500 MHz NMR spectrometer was used to record the synthesized compounds' 1H and 13C NMR spectra. A XEVO G2-XS QTOF micro mass spectrometer in positive electrospray ionization (ESI+) mode was used to record the mass spectra of the synthesized compounds.
3 ratio as a mobile phase. TLC was performed using these mentioned solvent systems and later visualized in a UV chamber. The purification of the synthesized molecules was performed using column chromatography (mesh size: 60–120). The capillary method was used to determine each compound's melting point. A Bruker Advance Neo 500 MHz NMR spectrometer was used to record the synthesized compounds' 1H and 13C NMR spectra. A XEVO G2-XS QTOF micro mass spectrometer in positive electrospray ionization (ESI+) mode was used to record the mass spectra of the synthesized compounds.
2.6. ALDH isoform enzymatic inhibition assay
In the present study, the materials required for enzymatic assay were purchased from various vendors. The human ALDH1A1, ALDH2, and ALDH3A1 enzymes were purchased from Abcam. Sigma Aldrich provided the standard inhibitors NCT-501 and CB29. Disulfiram, an ALDH2 inhibitor, was sent as a gift sample by Tripada Healthcare Pvt. Ltd. in Ahmedabad, India. The other chemicals, including beta-nicotinamide adenine dinucleotide and DTT, were obtained from Sigma Aldrich.By measuring the production of NADH at 340 nm, the inhibitory action of ALDH isoforms was measured spectrophotometrically. A concentration of 1 g mL−1 of ALDH1A1 was loaded into a 96-well plate. After that, the enzyme plate was incubated for 15 minutes at 25 °C with various doses of the synthesized compounds, standard inhibitors, and a control. A substrate combination containing 10 mM propionaldehyde, 2 mM DTT, 100 mM KCl, 1 mM NAD+, and 50 mM Tris-HCl pH 8.5 was used to start the reaction. After that, the NADH absorbance was measured in kinetic mode for 5 minutes. The ALDH1A1 reaction uses NCT-501 as a standard. Similarly, ALDH2 was employed at 0.5 g mL−1 in the reaction with 2 mM of acetaldehyde as the substrate, while ALDH3A1 was utilized at 0.2 g mL−1 in the reaction with 1 mM of 4-nitrobenzaldehyde as the substrate. In ALDH2 and ALDH3A1 reactions, disulfiram and CB29 were utilized as standards, respectively.18,19
2.7. Mafosfamide sensitivity assay
The mafosfamide (maf) chemosensitivity was determined using the MTT test. The maf was purchased from Niomech-IIT GmbH, Germany, D-17272. Maf was chosen for this investigation because it is a CP analog that does not require activation by cytochrome P450, making it ideal for cell-based studies. A549 and MIA-Paca-2 cell lines were chosen here because they express significant levels of ALDH1A1.20 The cell lines were obtained from the National Centre for Cell Science (NCCS). The MTT assay was carried out according to the previously reported procedures.21 A detailed description of the MTT assay is provided in the ESI.†2.8. Synergistic effect analysis
The impact of the combined treatment was assessed using SynergyFinder 2.0 and the combination index (CI).22 The CI was employed to gauge the combined effect of drugs on the MTT assay, where the CI values were interpreted as follows: CI < 1 denoted a synergistic effect, CI = 1 indicated an additive effect, and CI > 1 signified an antagonistic effect. The equation provided below was utilized to compute the CI for the combination:Conversely, SynergyFinder23 employed the zero interaction potency (ZIP) method to assess the combination effect. A ZIP score below −10 indicated antagonism, above 10 suggested synergy, and values in between implied an additive effect.
3. Results and discussion
3.1. Scaffold hopping and designing
The compound 8-((4-(cyclopropanecarbonyl)piperazin-1-yl)methyl-7-isopentyl-1,3-dimethyl-3,7-dihydro-1H-purine-2,6-dione) (ALDH1A1-D1) (the molecule obtained from our previous VS study) could be replaced by scaffolds that would display similar properties. Herein, the theophylline portion of the molecule has been successfully studied for scaffold hopping. This led to various new scaffolds possessing a similar kind of shape and field matching with theophylline (Table S1†). The generated scaffolds were anticipated to resemble the theophylline moiety and the same mode of action towards ALDH1A1. Among the generated scaffolds, the benzimidazole moiety was selected and a total of 95 1,2-disubstituted benzimidazoles were designed as ALDH1A1 inhibitors. Then, the molecules were further subjected to a strategy that combined multiple machine learning and docking-based virtual screening with biological evaluation.3.2. Virtual screening
As shown in Fig. 2, a library of designed compounds was screened through the MML models. Approximately, half of the compounds (41) were identified as ALDH3A1 inhibitors while none of the molecules was identified as ALDH2 inhibitors. Later, the obtained selective ALDH1A1 molecules were further analyzed using molecular docking studies with the help of the Flare module in the Cresset software. Before starting the final docking, the co-crystallized ligand in the 4X4L structure was redocked to validate the docking protocol. The Flare module in the Cresset software was able to reproduce the experimental results between the co-crystallized and redocked ligands with an RMSD of 0.49 Å. The binding poses of both redocked and co-crystallized ligands are shown in Fig. S1.†The ALDH1A1 inhibitors selectively identified through MML-based screening were docked in the same area of the active site as that of the co-crystalized ligand using BioMolTech's Lead Finder. In addition, the obtained compounds were further analyzed for ADMET screening. A total of five compounds satisfy all the Lipinski parameters including log![[thin space (1/6-em)]](https://www.rsc.org/images/entities/char_2009.gif) P < 5, MW < 500, HBD < 5, and HAD < 10. In addition, other parameters like PAINS, Brenks, and TPSA are also considered. PAINS and Brenks are filters for substances that may contain structural fragments that are potentially poisonous, metabolically unstable, or chemically reactive enough to obstruct biological assays while TPSA between 20 and 120 Å2 would be considered orally bioavailable. The physicochemical analyses of the five compounds revealed no PAINS or Brenk violations, indicating that none of the compounds are hazardous, and the calculated TPSA of <30 Å2 suggests that they have good oral bioavailability. The detailed LD dG score, LF rank score, and LF VS score obtained in Flare and ADME parameters of the top five compounds are displayed in Table 1. On the other hand, compromised docking scores were shown towards ALDH2 and ALDH3A1 (Table S2†). The interaction profiles of the top three compounds A1, A2, and A3 are shown in Fig. 3A–C. As shown in the figure, all the compounds maintained a similar kind of pi–pi stacking interaction with amino acids, including TYR297, PHE171, and PHE466 in the active site of ALDH1A1 while compound A2 has an additional pi–pi interaction with TYR457. These are the key interactions reported in various previous studies and they are responsible for ALDH1A1 inhibition. On the other hand, none of the compounds docked in the active sites of ALDH2 and ALDH3A1. Because there are two main reasons, one is due to their small and constrained active cavity surface areas, the compounds could not dock in ALDH2 and ALDH3A1 cavities. The second one is that the amino acids ASP458 of ALDH2 and ILE458 of ALDH3A1 present at the entry of the active site are showing strong steric clashes that prohibit the entry of the compound into the vicinity of the cavity. It was also reported by Morgan et al., that molecules showing steric clashes with these bulky amino acids cannot enter the active site.24 Similar kinds of observations were recorded in our studies and some additional steric clashes were also shown in the present docking studies. The detailed front and side views for ALDH2 and ALDH3A1 can be seen in Fig. S2 and S3.†
P < 5, MW < 500, HBD < 5, and HAD < 10. In addition, other parameters like PAINS, Brenks, and TPSA are also considered. PAINS and Brenks are filters for substances that may contain structural fragments that are potentially poisonous, metabolically unstable, or chemically reactive enough to obstruct biological assays while TPSA between 20 and 120 Å2 would be considered orally bioavailable. The physicochemical analyses of the five compounds revealed no PAINS or Brenk violations, indicating that none of the compounds are hazardous, and the calculated TPSA of <30 Å2 suggests that they have good oral bioavailability. The detailed LD dG score, LF rank score, and LF VS score obtained in Flare and ADME parameters of the top five compounds are displayed in Table 1. On the other hand, compromised docking scores were shown towards ALDH2 and ALDH3A1 (Table S2†). The interaction profiles of the top three compounds A1, A2, and A3 are shown in Fig. 3A–C. As shown in the figure, all the compounds maintained a similar kind of pi–pi stacking interaction with amino acids, including TYR297, PHE171, and PHE466 in the active site of ALDH1A1 while compound A2 has an additional pi–pi interaction with TYR457. These are the key interactions reported in various previous studies and they are responsible for ALDH1A1 inhibition. On the other hand, none of the compounds docked in the active sites of ALDH2 and ALDH3A1. Because there are two main reasons, one is due to their small and constrained active cavity surface areas, the compounds could not dock in ALDH2 and ALDH3A1 cavities. The second one is that the amino acids ASP458 of ALDH2 and ILE458 of ALDH3A1 present at the entry of the active site are showing strong steric clashes that prohibit the entry of the compound into the vicinity of the cavity. It was also reported by Morgan et al., that molecules showing steric clashes with these bulky amino acids cannot enter the active site.24 Similar kinds of observations were recorded in our studies and some additional steric clashes were also shown in the present docking studies. The detailed front and side views for ALDH2 and ALDH3A1 can be seen in Fig. S2 and S3.†
| Compound name | Compound structure | LF rank scorea | LD dG scoreb | LF VS scorec | MWd (g mol−1) | Log![[thin space (1/6-em)]](https://www.rsc.org/images/entities/char_2009.gif) Pe Pe |
Log![[thin space (1/6-em)]](https://www.rsc.org/images/entities/char_2009.gif) Sf Sf |
HBAg | HBDh | PAINSi | Brenksi | TPSAj (Å2) |
|---|---|---|---|---|---|---|---|---|---|---|---|---|
| kcal mol−1 | ||||||||||||
| a Score is used to rank the poses of docked compounds. b Score is used to rank the binding energy of docked compounds in terms of kcal mol−1. c Score is used to rank the docked compounds in virtual screening. d Molecular weight. e Lipid–water partition coefficient. f Aqueous solubility. g Hydrogen bond acceptor. h Hydrogen bond donor. i Number of alerts of undesirable substructures. j Topological polar surface area. | ||||||||||||
| A1 |

|
−12.34 | −11.25 | 10.35 | 318.80 | 4.73 | −5.45 | 1 | 0 | 0 | 0 | 17.82 |
| A2 |

|
−13.75 | −10.23 | −11.52 | 327.42 | 4.17 | −5.00 | 1 | 0 | 0 | 0 | 21.06 |
| A3 |

|
−11.62 | −11.26 | −12.35 | 314.38 | 4.19 | −4.97 | 2 | 0 | 0 | 0 | 27.06 |
| A4 |

|
−10.51 | −10.28 | −10.86 | 284.35 | 4.19 | −4.80 | 1 | 0 | 0 | 0 | 17.82 |
| A5 |
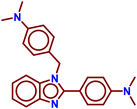
|
−10.21 | −11.65 | −10.75 | 370.49 | 4.02 | −5.19 | 1 | 0 | 0 | 0 | 24.30 |
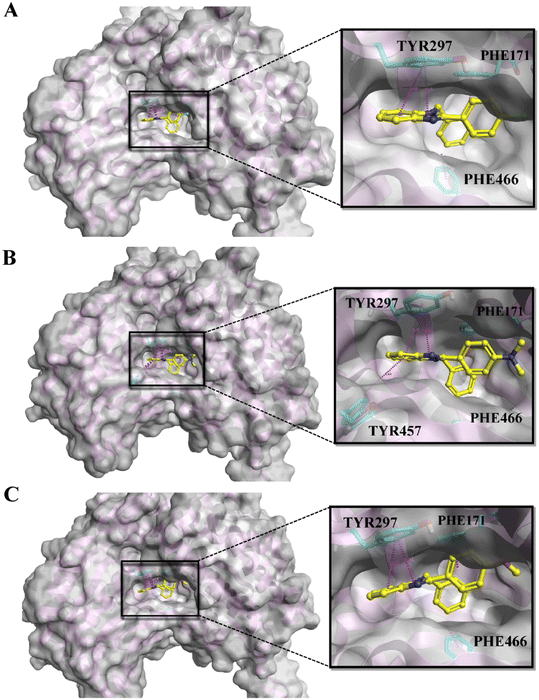 | ||
| Fig. 3 The docking poses of the top three molecules: A) A1, B) A2, and C) A3 in the active site of ALDH1A1. | ||
3.3. Molecular dynamics
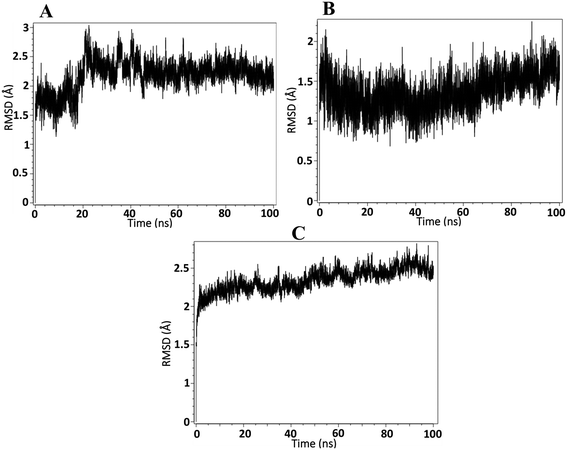
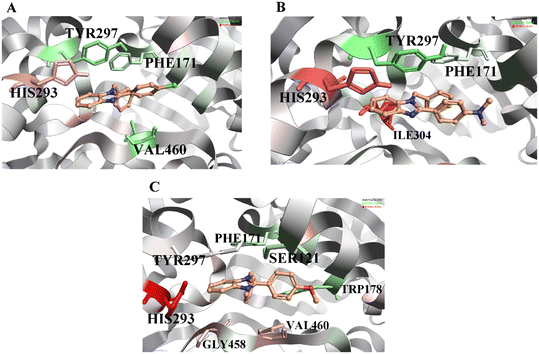
On the basis of docking and ADMET results, the top three compounds were selected and subjected to MD simulations for a period of 100 ns using the TIP3 water molecules. The biomolecular complex was solvated in an orthorhombic box with 10 Å dimensions. Then, the protein–ligand system was subjected to the AMBER force field in Flare. After the system had been minimized, MD simulations were run under an NPT ensemble with a temperature of 300 K and recording intervals of 2 ps for the duration of the simulation. The MD simulation revealed that all the docked complexes were stable throughout the simulation period. The stability-indicated RMSD plots of the top three docking compounds are displayed in Fig. 4A–C. As shown in Fig. 5A–C, all three compounds maintained the initial docking interactions except PHE466. Similarly, few water-mediated interactions via hydrogen bonds with HIS293, GLY456, VAL460, and SER121 are formed newly. In addition, HIS293 formed an additional pi–pi interaction with the benzimidazole moiety of all three compounds while TYR457 made a new pi–pi stacking with the same moiety in compound A2. Along with these, TRP178 formed two new pi–pi interactions with compound A3. All the newly formed interactions are also crucial for ALDH1A1 inhibition.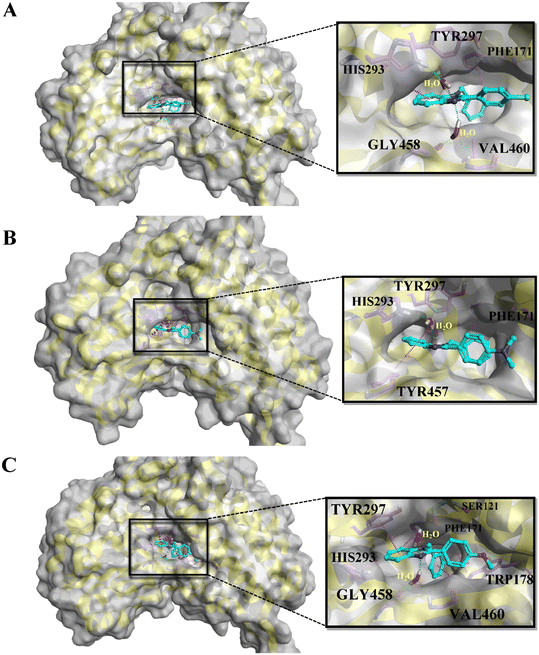 | ||
| Fig. 5 The binding poses of the top three molecules after MD simulation: A) A1, B) A2, and C) A3, in the active site of ALDH1A1. | ||
3.4. WaterSwap analysis
WaterSwap analysis was performed to determine the binding free energy and compute the energies (ΔG, kcal mol−1) for each amino acid within the active site concerning the ligand that favors the inhibition. The complete WaterSwap analysis revealed that the consensus of the compounds' arithmetic mean of binding energy values is minimal (Table 2). As the binding score values are minimal, the binding energy between the ligand and protein is higher. In addition, the WaterSwap analysis provides color coding to amino acids: the green-colored amino acids are favorable for ligand interactions, and the red-colored amino acids favor only the water-mediated interactions. As shown in Fig. 6A, compound A1 exhibits that amino acids TYR297 and PHE171 (green color) are highly favorable for direct ligand interactions. On the other hand, amino acid HIS293 (red color) exhibits a highly favorable water-mediated interaction as observed in MD analysis. Similarly, compound A2 (Fig. 6B) exhibits a similar observation like compound A1. In addition, ILE304 was observed in compound A2 as an additional water-favored amino acid. Finally, compound A3 (Fig. 6C) showed that TYR297 and TRP178 amino acids are favorable for direct ligand interactions and as observed in MD analysis, the amino acids including GLY458 and VAL460 are recorded for water-mediated favorable interactions. In addition, the WaterSwap analysis indicates that HIS293 has water-mediated favorability for compound A3, but the final MD trajectory indicates a direct interaction (Fig. 5C). Moreover, amino acid TYR297 exhibits neither direct favorability nor water-mediated favorability in the WaterSwap analysis. These two reasons affect the binding potentials of compound A3 i.e. greater energy values compared to compounds A1 and A2. This energy difference causes differences in in vitro inhibitor potentials. A detailed explanation for this was given in the in vitro results.| S. No. | Compound name | Bennett | FEPa | TIb | TI quadratic | The consensus of arithmetic mean (kcal mol−1) |
|---|---|---|---|---|---|---|
| a Free energy perturbation. b Thermodynamics integration. | ||||||
| 1. | A1 | −47.52 | −46.35 | −49.59 | −46.95 | −46.85 |
| 2. | A2 | −44.26 | −54.65 | −45.39 | −44.95 | −45.06 |
| 3. | A3 | −35.65 | −34.95 | −35.21 | −36.98 | −35.69 |
| 4. | A4 | −23.65 | −25.60 | −22.68 | −21.65 | −23.39 |
| 5. | A5 | −18.65 | −19.65 | −18.95 | −17.85 | −18.77 |
3.5. Chemistry
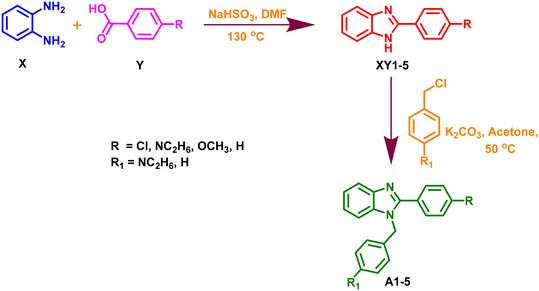
The selected 1,2-disubstituted benzimidazole derivatives as ALDH1A1 inhibitors were synthesized using the standard synthetic protocol25,26 with the following steps:![[thin space (1/6-em)]](https://www.rsc.org/images/entities/char_2009.gif) :
:![[thin space (1/6-em)]](https://www.rsc.org/images/entities/char_2009.gif) 4 ratio. Finally, the reaction mixture was added to cold water and the precipitated products (XY1–5) were filtered and dried.
4 ratio. Finally, the reaction mixture was added to cold water and the precipitated products (XY1–5) were filtered and dried.
![[thin space (1/6-em)]](https://www.rsc.org/images/entities/char_2009.gif) :
:![[thin space (1/6-em)]](https://www.rsc.org/images/entities/char_2009.gif) 4 ratio. After the completion of the reaction, the mixture was filtered and subjected to liquid–liquid extraction using ethyl acetate and water. The layer of ethyl acetate was dried and finally, the obtained crude product was purified by column chromatography to obtain pure derivatives of 1,2-disubstituted benzo[d]imidazole (A1–A5). The spectral data (LCMS) for all the synthesized compounds are displayed in the ESI.†
4 ratio. After the completion of the reaction, the mixture was filtered and subjected to liquid–liquid extraction using ethyl acetate and water. The layer of ethyl acetate was dried and finally, the obtained crude product was purified by column chromatography to obtain pure derivatives of 1,2-disubstituted benzo[d]imidazole (A1–A5). The spectral data (LCMS) for all the synthesized compounds are displayed in the ESI.†
3.6. In vitro enzymatic assay
The inhibitory potentials of the synthesized compounds were tested against ALDH1A1, ALDH2, and ALDH3A1 using a previously reported protocol. Subsequently, the IC50 of each compound was calculated using five different concentrations vs. %inhibition. ATT Bioquest was used to calculate the IC50 (https://www.aatbio.com/tools/ic50-calculator). The obtained IC50 values for all three ALDH isoforms are graphically presented in Fig. 7. Among all the compounds, A1, A2, and A3 exhibit highly selective ALDH1A1 inhibition with IC50 values of 0.32 μM, 0.55 μM, and 1.63 μM respectively, and no inhibition towards ALDH2 and ALDH3A1. In this study, it was observed that compounds A1 and A2, featuring Cl and NC2H5 groups substituted on the R position of the benzene ring, exhibited higher inhibitory effects on ALDH1A1 compared to NCT-501 (0.9 μM). Conversely, compound A3, with an OCH3 group substitution on the R position of the benzene ring, demonstrated a significant reduction in inhibitory potential when compared to A1 and A2. This discrepancy may be attributed to a higher binding energy score in WaterSwap analysis, where the crucial amino acid TYR297 was found to play no role in the binding energies between compound A3 and TYR297. Both WaterSwap and in vitro inhibitory potentials indicate that the OCH3 group substitution on the R position of the benzene ring may cause a weak interaction between TYR297 and the benzimidazole moiety of compound A3 compared to Cl and NC2H5 substitutions on the R position of compounds A1 and A2. Compound A4 possesses multi-isoform inhibitory potential with IC50 values of 8.67 μM against ALDH1A1, 95.63 μM against ALDH2, and 98.28 μM against ALDH3A1, even though it is highly selective for ALDH1A1 than ALDH2 and ALDH3A1. Compound A5 was not effective against any ALDH isoform at the given final concentrations i.e. 10 μM for ALDH1A1 and 100 μM for ALDH2 and ALDH3A1.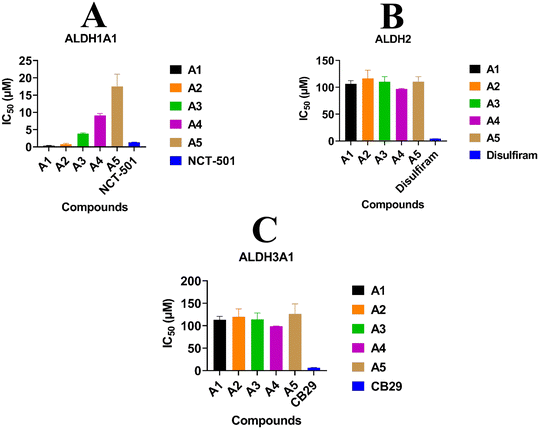 | ||
| Fig. 7 In vitro activity results indicating the IC50 values of all molecules towards A) ALDH1A1, B) ALDH2, and C) ALDH3A1. | ||
3.7. Mafosfamide sensitivity assays
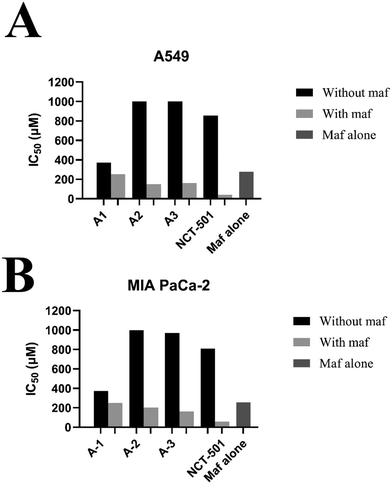
To determine the maf sensitivity with the combination of ALDH1A1 inhibitors, two cell lines, A549 and MIA PaCA-2, were employed in the current study. Compounds A1, A2, and A3 were chosen because they were selective toward ALDH1A1 and showed no inhibitory potential towards ALDH2 and ALDH3A1 in vitro enzymatic activity. In addition, NCT-501-selective ALDH1A1 was also considered as a reference. Initially, the IC50 values for maf in A549 and MIA PaCa-2 cells were found to be 276.09 and 256.17 μm, respectively (Fig. 8). Later, the treatment of A549 and MIA PaCa-2 cells with maf in the presence of compounds A1, A2, A3, and NCT-501 showed a marked increase in maf sensitivity when compared to maf alone. As shown in Fig. 8, compounds A2 and A3 did not possess any anti-cancer activity towards both the cell lines when they were treated alone, while in combination with maf, significant maf sensitivity has been shown. However, compound A1 possessed some amount of anti-cancer activity (370 μM for the A549 cell line and 315 μM for the MIA PaCa-2 cell line). So, in the combination studies, compound A1 was used at a lower concentration than its individual concentration. As shown in Fig. 8, the combination of maf and A1 shows a significant reversal of maf resistance. This experiment confirms that the designed selective ALDH1A1 inhibitors i.e., compounds A1, A2, and A3, can increase maf chemosensitivity.3.8. Synergistic effect analysis
The Chou–Talalay equation was employed to calculate the CI value against A549 and Mia PaCa-2 cells. As presented in Table 3, the CI values for all combinations were found to be <1. This indicates a synergistic effect of the combination therapy on A549 and Mia PaCa-2 cells.| S. No. | Drug1 | Drug2 | CI in A549 cells | CI in Mia PaCa-2 cells |
|---|---|---|---|---|
| *CI < 1 indicates a synergistic effect. *CI > 1 indicates an additive effect. | ||||
| 1. | Maf | Compound A1 | 0.91 | 0.98 |
| 2. | Maf | Compound A2 | 0.69 | 0.81 |
| 3. | Maf | Compound A3 | 0.74 | 0.84 |
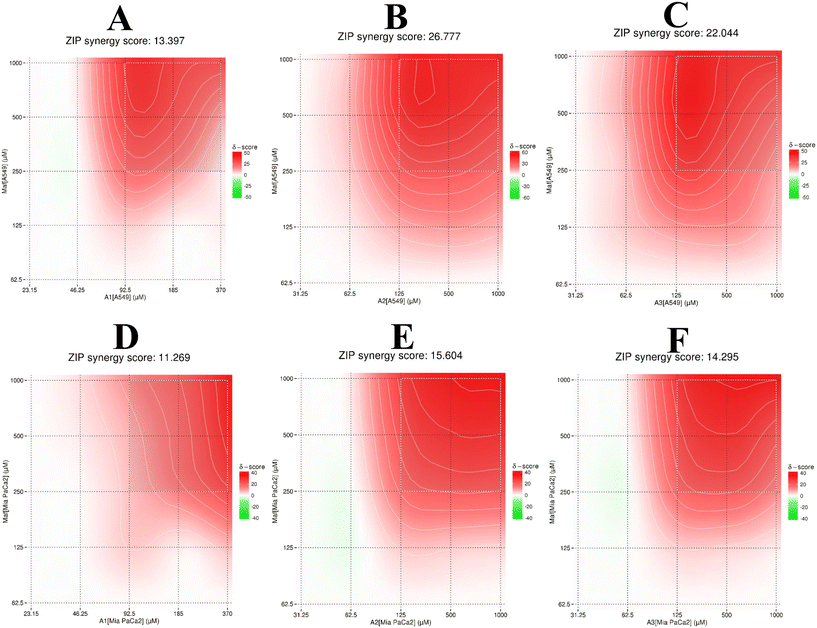
Given that the previous analysis did not yield a single mean synergy score, we utilized SynergyFinder 2.0 software to derive the synergy scores. The average excess response to drug interactions between A1, A2, and A3 with maf in A549 cells was found to be 13.39, 26.77, and 22.04, respectively (>10 indicating a synergistic effect) (Fig. 9A–C). These scores suggest that 13%, 26%, and 22% of responses exceeded expectations in combination compared to maf alone. The same analysis was conducted for Mia PaCa-2 cells (Fig. 9D–F), revealing synergy scores of 11.26, 15.60, and 14.29 (>10 indicating a synergistic effect) for the respective combinations. This implies that 11%, 15%, and 14% of responses were beyond expectations in combination compared to maf alone. Given that the goal of this study was to assess the synergistic effect of combination therapy on both cell types, these results provide valuable insights.
4. Conclusion
ALDH1A1 overexpression and CP resistance have been linked, and they have been reported in various pieces of literature. Additionally, it has been noted that greater in vitro sensitivity to 4-OH CP corresponds with suppression of ALDH1A1 activity in murine pluripotent hematopoietic stem cells and myeloid progenitor cells. Thus, to overcome the problem associated with ALDH1A1-mediated CP resistance, in the current study scaffold hopping was used to design, produce, and analyze several new benzimidazole derivatives as ALDH1A1 inhibitors. Compounds A1, A2, and A3 are selective ALDH1A1 inhibitors that were discovered through systematic medicinal chemistry optimization with IC50 values of 0.32 μM, 0.55 μM, and 1.63 μM respectively against ALDH1A1 with no inhibition against ALDH2 and ALDH3A1. These compounds also effectively improved the maf sensitivity in cell line studies when they were treated in combination. In addition, combination index analyses also confirmed the synergistic effect of the combination of compounds A1, A2, and A3 with maf on both A549 and Mia PaCa-2 cells. Therefore A1, A2, and A3 are likely to be developed into candidates for the treatment of ALDH1A1-mediated CP resistance as selective ALDH1A1 inhibitors.Conflicts of interest
There is no conflict of interest to declare.Acknowledgements
This work was supported by the Indian Council of Medical Research (ICMR), New Delhi; Sanction No. ISRM/12(10)/2019. The authors would like to thank Tripada Healthcare Pvt. Ltd, Ahmedabad, India for providing disulfiram as a gift sample. We also thank Mr. Shubham Thakur, ICMR-SRF, Department of Pharmaceutical Sciences, Guru Nanak Dev University, Amritsar for helping us while performing in vitro enzymatic assay and cell line studies. Mr. Gera Narendra and Mr. Baddipadige Raju are highly grateful to the Indian Council of Medical Research (ICMR) New Delhi for providing a senior research fellowship (SRF) with award no. ISRM/12(10)/2019.References
- V. Vasiliou and D. W. Nebert, Hum. Genomics, 2005, 2, 138–143 CrossRef CAS PubMed.
- S.-M. Yang, A. Yasgar, B. Miller, M. Lal-Nag, K. Brimacombe, X. Hu, H. Sun, A. Wang, X. Xu and K. Nguyen, J. Med. Chem., 2015, 58, 5967–5978 CrossRef CAS PubMed.
- H. Verma, M. Singh Bahia, S. Choudhary, P. Kumar Singh and O. Silakari, Drug Metab. Rev., 2019, 51, 196–223 CrossRef CAS PubMed.
- M. Ahlmann and G. Hempel, Cancer Chemother. Pharmacol., 2016, 78, 661–671 CrossRef CAS PubMed.
- G. Narendra, B. Raju, H. Verma, M. Kumar, S. K. Jain, G. K. Tung, S. Thakur, R. Kaur, S. Kaur and B. Sapra, Int. J. Biol. Macromol., 2023, 242, 124749 CrossRef CAS PubMed.
- B. Raju, S. Choudhary, G. Narendra, H. Verma and O. Silakari, Drug Metab. Rev., 2021, 53, 45–75 CrossRef CAS PubMed.
- G. Narendra, B. Raju, H. Verma and O. Silakari, Med. Oncol., 2021, 38, 1–10 CrossRef PubMed.
- G. Narendra, S. Choudhary, B. Raju, H. Verma and O. Silakari, Clin. Pharmacokinet., 2022, 61, 1495–1517 CrossRef CAS PubMed.
- G. G. Muramoto, J. L. Russell, R. Safi, A. B. Salter, H. A. Himburg, P. Daher, S. K. Meadows, P. Doan, R. W. Storms and N. J. Chao, Stem Cells, 2010, 28, 523–534 CrossRef CAS PubMed.
- M. Nowacka, B. Ginter-Matuszewska, M. Świerczewska, K. Sterzyńska, M. Nowicki and R. Januchowski, Int. J. Mol. Sci., 2022, 23, 3036 CrossRef CAS PubMed.
- G. Narendra, B. Raju, H. Verma, B. Sapra and O. Silakari, J. Mol. Graphics Modell., 2021, 107, 107950 CrossRef CAS PubMed.
- T. Cheeseright, M. Mackey, S. Rose and A. Vinter, J. Chem. Inf. Model., 2006, 46, 665–676 CrossRef CAS PubMed.
- M. Kuhn, S. Firth-Clark, P. Tosco, A. S. Mey, M. Mackey and J. Michel, J. Chem. Inf. Model., 2020, 60, 3120–3130 CrossRef CAS PubMed.
- K. Gangarapu, L. Karthik, M. S. Devi, P. Sathiyarajeswaran, K. Kanakavalli, K. M. Kumar and D. R. Kumar, J. Ayurveda Integr. Med., 2020, 13, 100324 Search PubMed.
- A. Daina, O. Michielin and V. Zoete, Sci. Rep., 2017, 7, 42717 CrossRef PubMed.
- S. I. Alaqeel, J. Saudi Chem. Soc., 2017, 21, 229–237 CrossRef CAS.
- L. C. Carvalho, E. Fernandes and M. M. B. Marques, Chem. – Eur. J., 2011, 17, 12544–12555 CrossRef CAS PubMed.
- C. A. Morgan and T. D. Hurley, J. Med. Chem., 2015, 58, 1964–1975 CrossRef CAS PubMed.
- H. Verma, G. Narendra, B. Raju, M. Kumar, S. K. Jain, G. K. Tung, P. K. Singh and O. Silakari, Arch. Pharm., 2022, 355, 2200108 CrossRef CAS PubMed.
- A. Yasgar, S. A. Titus, Y. Wang, C. Danchik, S.-M. Yang, V. Vasiliou, A. Jadhav, D. J. Maloney, A. Simeonov and N. J. Martinez, PLoS One, 2017, 12, e0170937 CrossRef PubMed.
- B. Parajuli, M. L. Fishel and T. D. Hurley, J. Med. Chem., 2014, 57, 449–461 CrossRef CAS PubMed.
- T.-C. Chou, Pharmacol. Rev., 2006, 58, 621–681 CrossRef CAS PubMed.
- A. Ianevski, A. K. Giri and T. Aittokallio, Nucleic Acids Res., 2020, 48, W488–W493 CrossRef CAS PubMed.
- C. A. Morgan and T. D. Hurley, Chem.-Biol. Interact., 2015, 234, 29–37 CrossRef CAS PubMed.
- S. I. Alaqeel, J. Saudi Chem. Soc., 2017, 21, 229–237 CrossRef CAS.
- L. C. Carvalho, E. Fernandes and M. M. B. Marques, Chem. – Eur. J., 2011, 17, 12544–12555 CrossRef CAS PubMed.
Footnote |
| † Electronic supplementary information (ESI) available. See DOI: https://doi.org/10.1039/d3md00543g |
| This journal is © The Royal Society of Chemistry 2024 |

