Responsive ZIF-90 nanocomposite material: targeted delivery of 10-hydroxycamptothecine to enhance the therapeutic effect of colon cancer (HCT116) cells†
Ji-Chao
Guo
a,
Shi-Hui
Deng
a,
Shu-Min
Zhou
a,
Xuan
Zhou
 a,
Jiajia
Du
a,
Si-Han
Zhou
a,
Jiajia
Du
a,
Si-Han
Zhou
 a,
Qi-Hua
Zhao
 a,
Zhong-Yan
Cai
a,
Xiaoxia
Ren
*b and
Ming-jin
Xie
a,
Zhong-Yan
Cai
a,
Xiaoxia
Ren
*b and
Ming-jin
Xie
 *a
*a
aSchool of Chemical Science and Technology, Yunnan University, Kunming, 650091, Yunnan, China. E-mail: mjxie@ynu.edu.cn
bAnimal Research and Resource Center, School of Life Sciences, Yunnan University, Kunming, 650091, Yunnan, China
First published on 9th May 2024
Abstract
There is significant value in developing multifunctional drug delivery systems with high therapeutic efficiency for diagnosing and treating tumors. In this study, we synthesized the ATP-triggered and pH-sensitive material ZIF-90 using the liquid-phase diffusion method. This was done to load 10-hydroxycamptothecin (HCPT), and the FA-PEG-NH2 conjugate was synthesized through an amidation reaction. We further modified the HCPT@ZIF-90 nanocomposite by employing the Schiff base reaction to create the HCPT@ZIF-90-PEG-FA nanomaterial. Drug loading test results revealed a high HCPT drug loading of up to 22.3% by weight. In the drug release experiment, the cumulative drug release of HCPT@ZIF-90 nanomaterials in pH 5.4 and ATP solutions was the highest after 72 hours. The active targeted delivery of FA and the dual-responsive release of HCPT by ZIF-90 significantly enhanced the therapeutic effect of HCPT@ZIF-90-PEG-FA on human colon cancer cells (HCT116). In the cytotoxicity test, when 100 μg mL−1 of HCPT@ZIF-90-PEG-FA was incubated with cells, the cell survival rate was 16.61 ± 1.19%, significantly lower than that of the other experimental groups. This result indicates that HCPT@ZIF-90-PEG-FA exhibits excellent anti-tumor activity. Cell cycle experiments have shown that HCPT@ZIF-90-PEG-FA may inhibit the proliferation of cancer cells by blocking DNA synthesis and halting cell cycle progression. Cell uptake experiments showed that HCPT@ZIF-90-PEG-FA was mainly present in the cytoplasm of HCT1116 cells, indicating successful cellular entry of the drug to exert its therapeutic effect. In vivo experiments also demonstrated that HCPT@ZIF-90-PEG-FA nanomaterials can effectively eradicate HCT116 tumors. The utilization of the nano-drug carrier ZIF-90, along with the modification with PEG-FA, notably improved the therapeutic efficacy of HCPT. These results suggest that the system, with its active targeted delivery of FA and dual-responsive release of HCPT, could present a novel strategy for treating human colorectal cancer.
1. Introduction
Cancer, one of the most destructive diseases affecting human health today, continues to be a focal point of extensive research.1 Among the various treatment options, chemotherapy is widely used clinically to treat numerous types of cancers.2–5 10-Hydroxycamptothecin (HCPT), a broad-spectrum antineoplastic drug that inhibits topoisomerase I and is an analog of natural camptothecin, has shown promise.6 However, its clinical application is limited by its low water solubility, poor stability, high toxicity, and other side effects. To mitigate these limitations, a potential strategy would be to load HCPT onto nanocarriers that are safe, stable, and water-soluble.7In recent years, numerous nanomaterials have been extensively synthesized for use in drug delivery systems, due to their targeted impact, ease of functionalization, and intracellular absorption capacity.8 Organic nanomaterials often possess properties such as biodegradability, low toxicity, and chemical modification,9 but they may not be adequate for controlling drug release. In contrast, inorganic nanomaterials possess high drug loading capacity, stability, and controllable release properties. However, their biocompatibility often poses a challenge.10 Thus, there is an urgent need to develop drug delivery systems that integrate appropriate particle size, high biosafety, and good biodegradability. Metal–organic frameworks (MOFs) are materials with ordered network structures formed by the coordination bonds between metal ions and organic ligands. They have shown promise in cancer therapy.11,12 Compared to traditional drug carrier materials, MOFs offer diverse structures, precise crystal structure information, and biodegradability. These attributes make MOFs an extremely suitable choice as nanodrug carriers for cancer treatment.13–15
ZIF-90, which self-assembles from zinc ions and imidazole-2-carbaldehyde (2-ICA), is biocompatible with a variety of cell lines and disintegrates within weeks in vitro.16–18 The aldehyde group on the ZIF-90 ligand can form a Schiff base bond with an amino group, enabling efficient loading of drug molecules. Upon reaching the weakly acidic cancer site, the coordination bond in the ZIF-90 structure breaks, leading to the collapse of the skeleton. Due to the hydrolysis reaction, the Schiff base bond also breaks, resulting in the release of the drug.19 Furthermore, ZIF-90 can respond to subcellular adenosine triphosphate (ATP) as the coordination of ATP to Zn2+ is much stronger than that of imidazole to Zn2+.20 This holds promise for an improved therapeutic effect on cancer cells, given that the ATP concentration in tumor cells is about 100 times higher than that in normal cells.21 Previous studies have primarily focused on utilizing ZIF-90 nanomaterials for passive targeting of cancer cells by leveraging the enhanced permeability and retention (EPR) effect.22,23 Therefore, active targeting would be a promising strategy to fully explore the in vivo application of ZIFs in tumor therapy.24 However, there have been few reports on active targeted cancer therapy following nano-ZIF-90 specific targeting molecular modification.
Folate, as a targeting ligand for drug delivery, has been extensively studied. It can be selectively recognized by folate receptors (FR) that are overexpressed on the surface of cancer cells. This recognition stimulates receptor-mediated endocytosis, thereby enhancing tumor absorption of drugs while simultaneously reducing systemic toxicity.25,26 Polyethylene glycol (PEG), known for its high biocompatibility and ability to prolong circulation time, is considered an excellent candidate.27 Therefore, PEG-FA is perceived as a promising stabilizer for modifying drug delivery systems to achieve more effective tumor-targeting therapy.28,29
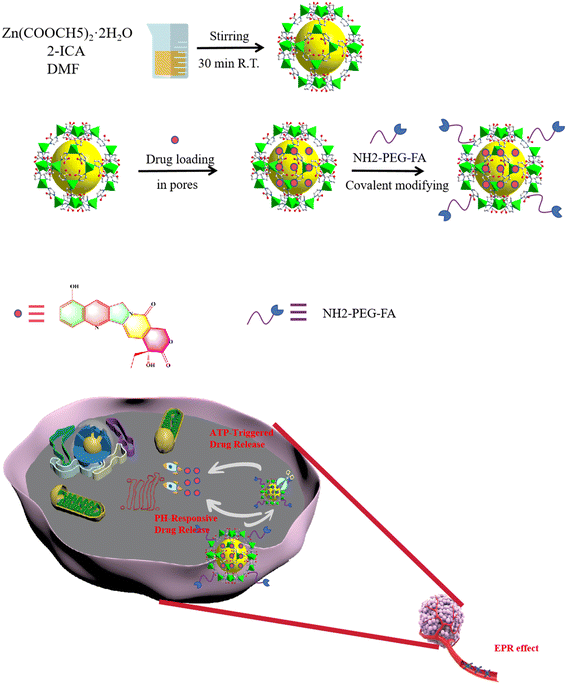
In this study, we rationally designed an ATP-triggered, pH-responsive, and PEG-FA-functionalized drug delivery system named HCPT@ZIF-90-PEG-FA, which achieved active targeted delivery and demonstrated efficient anti-cancer activity. As shown in Scheme 1, ZIF-90 was synthesized using the liquid-phase diffusion method, followed by loading HCPT into the pores of ZIF-90 through physical adsorption. PEG-FA was linked to ZIF-90 through a Schiff base reaction, resulting in the HCPT@ZIF-90-PEG-FA composite material. The composite material offers several advantages: 1) it demonstrates a positive therapeutic effect on colon cancer; 2) the modification of PEG-FA improves the water solubility and targeting capabilities of the composites; 3) the ZIF-90 nanomaterial exhibits ATP and pH responses, triggering the release of the chemotherapy drug HCPT, thereby increasing the efficacy in killing cancer cells and minimizing harm to normal cells. Overall, HCPT@ZIF-90-PEG-FA nanocomposites are effective materials for targeted therapy of colon cancer. Thus, this work provides a straightforward method to create a multifunctional nanotherapeutic platform that enhances the therapeutic effectiveness for colon cancer. This strategy of functionalizing a series of molecules, such as PEG and FA, onto MOFs to impart unique functions is expected to offer promising insights for enhancing the efficacy of tumor therapy.
2. Experimental section
2.1 Materials
In our study, all examined chemicals were used without any additional purification. The chemicals, including zinc acetate dihydrate (Zn(CH3COOH)2·2H2O), imidazole-2-carboxaldehyde (ICA, 98%), polyvinylpyrrolidone (PVP), (S)-10-hydroxycamptothecin (HCPT, 98%), folic acid (FA, 98%), 1-ethyl-3-[3-dimethylaminopropyl] carbodiimide hydrochloride (EDC, 97%+), N-hydroxysuccinimide (NHS, 98%), and NH2-PEG-NH2, were procured from Aladdin (Shanghai, China). All materials were used as obtained.2.2 Synthesis of ZIF-90
The synthesis of drug-loaded ZIF-90 was adapted and modified from a previously reported procedure.30 The specific steps are as follows: zinc acetate dihydrate (Zn(CH3COOH)2·2H2O) (6 mL, 0.1 M) was added to a solution of imidazole-2-carboxaldehyde (ICA) (6 mL, 0.2 M) and polyvinylpyrrolidone (PVP) (160 mg) in N,N-dimethylformamide (DMF) and H2O. The mixture was stirred at 60 °C for 20 minutes. The resulting solution was then transferred to a centrifuge tube and centrifuged at a speed of 10![[thin space (1/6-em)]](https://www.rsc.org/images/entities/char_2009.gif) 000 rpm. The supernatant was discarded, and the residue was washed alternately three times with DMF and methanol. Lastly, it was dried in a vacuum oven to produce nanoscale ZIF-90 materials.
000 rpm. The supernatant was discarded, and the residue was washed alternately three times with DMF and methanol. Lastly, it was dried in a vacuum oven to produce nanoscale ZIF-90 materials.
2.3 Synthesis of HCPT@ZIF-90
To prepare the drug-loaded nano ZIF-90, 100 mg of HCPT was dissolved in 25 mL of methanol in a 50 mL round bottom flask under stirring until fully dissolved. Subsequently, 100 mg of activated nano ZIF-90 sample was added to the solution. The mixture was stirred at room temperature in the dark for 24 hours. Subsequently, the particles were separated by centrifugation at 10![[thin space (1/6-em)]](https://www.rsc.org/images/entities/char_2009.gif) 000 rpm for 10 minutes and washed with an excess of methanol until the wash solution became colorless. The resulting particles were then vacuum-dried at room temperature for 12 hours. The loading of HCPT on nano-ZIF-90 was determined by monitoring the reaction using UV/vis spectroscopy at a wavelength of 367 nm.
000 rpm for 10 minutes and washed with an excess of methanol until the wash solution became colorless. The resulting particles were then vacuum-dried at room temperature for 12 hours. The loading of HCPT on nano-ZIF-90 was determined by monitoring the reaction using UV/vis spectroscopy at a wavelength of 367 nm.
2.4 Synthesis of FA-PEG-NH2, HCPT@ZIF-90-PEG-FA
The conjugate FA-PEG-NH2 was synthesized following a process detailed in a previous report.31 To start, FA (0.04 mmol, 17.65 mg) was initially activated using EDC (0.036 mmol, 6.90 mg) and NHS (0.036 mmol, 4.14 mg). This process was conducted at room temperature for one hour in 5 mL of DMSO. Following this, the solution containing the newly activated FA was gradually mixed with the NH2-PEG-NH2 (Mw = 2000, 0.02 mmol, 40.0 mg) solution in DMSO (5 mL). The mixture was continuously stirred with a strong magnetic stirrer at room temperature for three days. The mixture was then dialyzed against phosphate-buffered saline (PBS) and water, each three times in 2 L volumes over a three-day period. This was achieved using a dialysis membrane with a molecular weight cutoff (MWCO) of 2000. The final product, FA-PEG-NH2, was obtained through lyophilization.To start, 25 mg of pre-synthesized FA-PEG-NH2 was dissolved in 30 mL of methanol solution and heated in an oil bath. Once the temperature reaches 60 °C, HCPT@ZIF-90 and three drops of ice-cold acetic acid were added successively while stirring. The mixture was allowed to react under continuous reflux for 10 minutes. After this period, it was returned to room temperature and stirred in the dark for 24 hours. Following the reaction, the mixture was centrifuged at 10![[thin space (1/6-em)]](https://www.rsc.org/images/entities/char_2009.gif) 000 rpm for 10 minutes and washed with excess methanol until the solution is colorless. Finally, the sample was freeze-dried for future use.
000 rpm for 10 minutes and washed with excess methanol until the solution is colorless. Finally, the sample was freeze-dried for future use.
2.5 Characterization
A multitude of instruments were used for different characterization and analyses. For TEM characterization, the JEOL JEM 2100F transmission electron microscope was employed, while the Sigma 300 scanning electron microscope was used for SEM analysis. The Malvern Zetasizer Nano ZS90 was used to determine the average size and size distribution using DLS. UV-vis absorption spectroscopy was conducted using a U-4100 UV-vis spectrophotometer. The Nexus 670 Fourier-transform infrared spectrometer was selected for FT-IR analysis, and the Zetasizer Nano ZS90 instrument was utilized to measure the zeta potential. The TA equipment was used for TGA measurements, and a Micromeritics ASAP2460 apparatus was employed for nitrogen adsorption/desorption analysis. XRD analysis was conducted using the X'Pert3 Powder instrument with Cu Kα radiation, covering the 2θ range of 5–50°. To quantitatively analyze the amount of a specific element, we employed ICP-OES (PerkinElmer 8300). The MTT experiments were performed using a Thermo Multiskan MK3, and flow cytometric analyses were conducted using a GUAVA easyCyte. Finally, cellular uptake was observed using CLSM (Leica TCS SP8).2.6 In vitro drug loading study
To determine the drug loading capacity of ZIF-90, drugs post-loading were collected from HCPT@ZIF-90 by centrifugation. Subsequently, the collected drugs were washed three times with deionized water to remove any unabsorbed drugs. UV-vis absorption measurements were used to analyze the concentration of HCPT in the collected supernatants. The amount of drugs loaded in ZIF-90 was calculated by subtracting the remaining drugs in the supernatants from the total quantity of drugs added. Lastly, the drug loading efficiency (LE) was calculated using eqn (1). | (1) |
2.7 In vitro ATP and pH responsive drug release
2 mg of dried HCPT@ZIF-90 powder was weighed and 2 mL of pH 5.4 PBS buffer solution was added for dissolution. After dissolution, the solution mentioned above was transferred into a dialysis bag with a molecular weight cut-off (MWCO) of 2000 Da. Subsequently, the dialysis bag was placed into two 50 mL small beakers. In each beaker, 40 mL of pH 5.4 buffer solution and 40 mL of pH 5.4 PBS + ATP solution were added. The beaker was placed on a mixer with stirring. Then, 3 mL of PBS buffer solution was periodically removed from each of the two beakers, and the absorbance of each solution at a wavelength of 367 nm was measured, respectively. In addition, 3 mL of PBS buffer solution with the corresponding pH was added to the two beakers promptly, ensuring that the volume of buffer in the beaker remained consistent with the initial amount before absorption. The experimental method for releasing the pH 7.4 PBS buffer solution is consistent with the above.2.8 Hemolysis assay
A hemolysis study was conducted to determine the blood compatibility of HCPT@ZIF-90-PEG-FA. The hemolytic activity of HCPT@ZIF-90-PEG-FA and ZIF-90 nanoparticles was assessed following the methods described in previous reports. Mouse blood was centrifuged at 1500 rpm for 10 minutes to remove the serum, followed by washing the red blood cells three times with a sterile isotonic PBS solution. The suspension of MRBC was then diluted tenfold with PBS buffer. One milliliter of the diluted MRBC suspension was added to 4 mL of water (as a positive control), 4 mL of PBS (as a negative control), and 4 mL of PBS containing HCPT@ZIF-90-PEG-FA and ZIF-90 at different particle concentrations (25–200 mg mL−1). After gentle shaking, the mixture was left to stand for 4 hours at room temperature. The sample was then centrifuged at 10![[thin space (1/6-em)]](https://www.rsc.org/images/entities/char_2009.gif) 000 rpm for 1 minute. Subsequently, photographs were taken, and the absorbance of the supernatant (hemoglobin) was measured using a U-4100 UV-vis spectrophotometer. The hemolysis percentage of different samples was calculated by dividing the difference in absorbance at 541 nm between samples and negative controls by the difference in absorbance at 541 nm between positive and negative controls. This procedure was repeated three times, and the degree of hemolysis was determined as follows:
000 rpm for 1 minute. Subsequently, photographs were taken, and the absorbance of the supernatant (hemoglobin) was measured using a U-4100 UV-vis spectrophotometer. The hemolysis percentage of different samples was calculated by dividing the difference in absorbance at 541 nm between samples and negative controls by the difference in absorbance at 541 nm between positive and negative controls. This procedure was repeated three times, and the degree of hemolysis was determined as follows: | (2) |
2.9 In vitro cytotoxicity assay
The in vitro cytotoxicities of HCPT@ZIF-90-PEG-FA, HCPT@ZIF-90, free HCPT, and ZIF-90 solution were tested on HCT116 cells using the MTT method. Briefly, HCT116 cells were seeded in 96-well plates to achieve a concentration of 5 × 10³ cells per well. After an overnight incubation, the cells were treated with varying concentrations of HCPT@ZIF-90-PEG-FA, HCPT@ZIF-90, free HCPT, or ZIF-90 solution for 24 hours. Subsequently, 10 μL of PBS containing 5 mg mL−1 3-(4,5-dimethylthiazol-2-yl)-2,5-diphenyltetrazolium bromide (MTT) was added to each well, and the cells were incubated for another 4 hours at 37 °C. The supernatant was then discarded, and 150 μL of DMSO was added to each well to dissolve the resulting purple formazan. The absorbance of each well was measured at 490 nm using a microplate reader. The study was repeated three times for all samples. Cell viability rates, which indicate the cytotoxicity of HCPT@ZIF-90-PEG-FA, were calculated as follows: | (3) |
2.10 In vitro apoptosis and cycle assay
HCT116 cells in the logarithmic growth phase were seeded in a 96-well plate and cultured for 24 hours. After this incubation period, the old medium was aspirated, and fresh medium containing free HCPT, HCPT@ZIF-90, or HCPT@ZIF-90-PEG-FA was added to the plate. Untreated HCT116 cells served as the control group. After another 24 hour cultivation period, the cells were treated with trypsin, harvested, washed with a PBS solution, and suspended in a buffer. Next, they were marked with 5 μL of Annexin V-FITC and 5 μL of propidium iodide. After incubating for 10 minutes, an appropriate amount of binding buffer was added to dilute the cell solution. Cell apoptosis was detected using flow cytometry.2.11 Cell uptake test
HCT116 cells were inoculated onto a laser confocal culture dish at a concentration of 1 × 10⁴ cells per milliliter. Each well was filled with 1 mL of the cell suspension, and the cells were allowed to culture for one day. Afterward, the dish was taken out of the incubator, the culture medium was discarded, and the cells were delicately rinsed three times with pre-warmed PBS solution at 37 °C. Subsequently, 0.5 mL of HCPT@ZIF-90-PEG-FA preparation was added, and the cells were incubated for 6 hours. After the incubation, the drug solution was discarded, and ice-cold PBS at 4 °C was added to halt uptake. The cells were then washed three times, fixed with 4% paraformaldehyde for 20 minutes, and subsequently washed five times with cold PBS. After discarding the PBS solution, 200 μL of PBS was added, and the cells were washed three more times with cold PBS. Observations and image capture were performed using a laser confocal microscope.342.12 Animal experiments
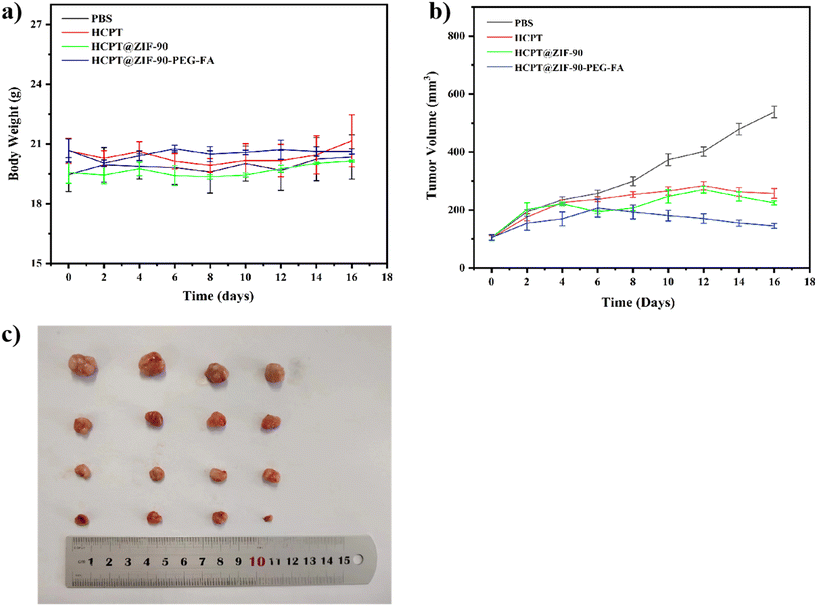
Tumor inoculation: each mouse will be subcutaneously inoculated with HCT116 tumor cells (5 × 10⁶) in 0.1 mL of PBS in the right abdominal region for tumor development. Treatment will begin when the average tumor size reaches approximately 100 mm3. The date of tumor cell inoculation was recorded as day 0. Treatment regimen: 10 mg kg−1, administered intraperitoneally once every 2 days for a total of, 8 injections. Sixteen mice with HCT116 tumors ranging in size from 100 to 115 mm3 were divided into four groups to study the antitumor efficacies in vivo. HCPT, HCPT@ZIF-90, and HCPT@ZIF-90-PEG-FA were injected intraperitoneally. The PBS group served as the control group. The mice were treated every other day for a total of 16 days. During the experiment, the tumor volume and body weight of the mice were measured every two days. All animals were purchased from the Laboratory Animal Center of Yunnan University (in Kunming, China). All animal experiments were conducted on female BALB/c mice (24 ± 3 g) with a tumor vaccination age of 6 weeks and treatment concluding at 11 weeks. All animal operations are carried out in accordance with the care and use guidelines of the Yunnan University Laboratory Animal Center and are approved by the Ethics Committee of the Yunnan University Laboratory Animal Center.3. Results and discussion
3.1 Characterization of ZIF-90, HCPT@ZIF-90, and HCPT@ZIF-90-PEG-FA
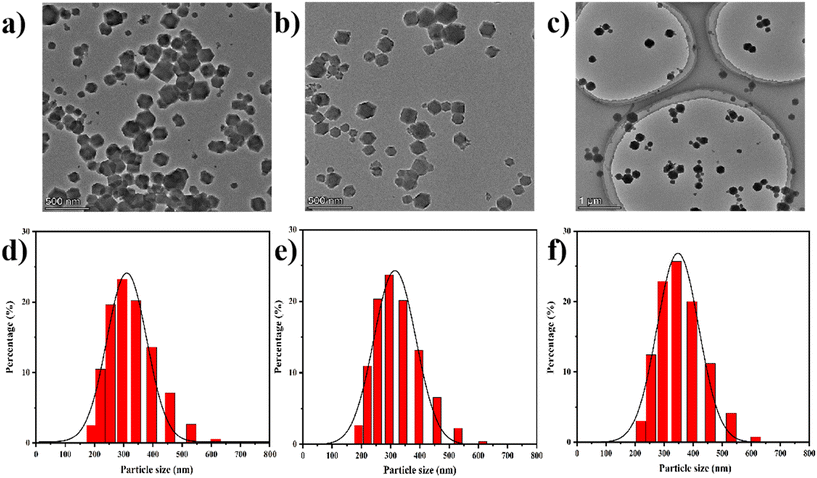
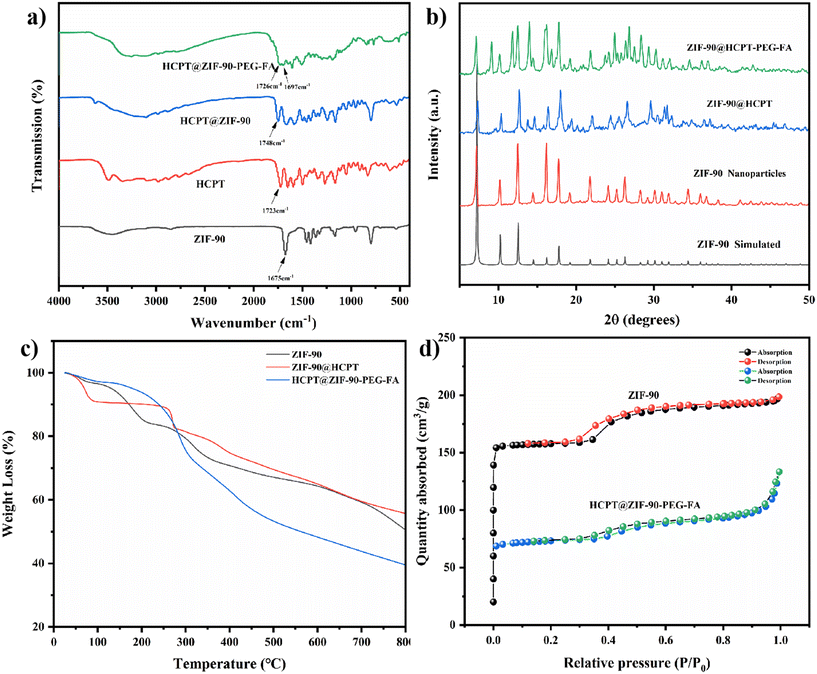
The resulting ZIF-90, HCPT@ZIF-90-PEG-FA, was characterized by SEM, and the morphology of the nano-MOF was examined. Scanning electron microscopy (SEM) images confirmed that all samples exhibited the same cubic morphology (Fig. S1†). The transmission electron microscopy (TEM) reveals that ZIF-90, HCPT@ZIF-90, and HCPT@ZIF-90-PEG-FA are uniformly dispersed and exhibit a cubic shape. Additionally, the particle size measures approximately 300–400 nm, consistent with the findings from the SEM (Fig. 1a). In addition, the HCPT@ZIF-90-PEG-FA particles were well dispersed, indicating that PEG-FA can prevent aggregation. Moreover, PEG-FA effectively prevents the aggregation of HCPT@ZIF-90 particles. Fig. S2† displays the energy spectra of C, O, N, and Zn elements in the synthesized particles, demonstrating the efficient synthesis process of ZIF-90 nanoparticles. The particle size and distribution of the test samples were also determined by DLS. As shown in Fig. 1b, the particle size was 338.3 nm for ZIF-90, 349.3 nm for HCPT@ZIF-90, and 363.9 nm for HCPT@ZIF-90-PEG-FA. The distribution is narrow (polydispersity index less than 0.2). Due to the coating and linking of PEG-FA, the particle size of HCPT@ZIF-90-PEG-FA was significantly larger than that of ZIF-90 and HCPT@ZIF-90.In order to verify the structure of the synthesized ZIF-90 series, which includes ZIF-90, HCPT@ZIF-90, and HCPT@ZIF-90-PEG-FA, IR characterization was performed first. As shown in Fig. S3,† the stretching vibration peak of the aldehyde group observed at 1675 cm−1 of the synthesized ZIF-90 nanoparticles is consistent with the ICA spectrum, indicating no participation in the reaction. In addition, the Zn–N stretching band at 540 cm−1 in ZIF-90 indicates the coordination of zinc ions to N-imidazole. As shown in Fig. 2a, for HCPT@ZIF-90, there is a ketone-based stretching vibration peak at 1748 cm−1 from the chemotherapeutic drug HCPT. Similarly, for HCPT@ZIF-90-PEG-FA, a ketone-based stretching vibration peak is observed at 1726 cm−1, indicating the successful loading of the chemotherapeutic drug HCPT. The ketone-based stretching vibration peaks of the two materials mentioned above are slightly red-shifted compared to that of HCPT alone, suggesting the presence of an interaction force between ZIF-90 and HCPT. For the HCPT@ZIF-90-PEG-FA composite material, it can be observed that at 1675 cm−1, the intensity of the aldehyde group stretching vibration from ZIF-90 decreases. This decrease indicates that the aldehyde group of ZIF-90 has undergone a Schiff base reaction with one terminal amino group of PEG, resulting in successful attachment of PEG to HCPT@ZIF-90. This attachment endowed the nanomaterial with hydrophilicity. Interestingly, at 1697 cm−1, an amide peak appeared, attributed to the carboxyl group of FA and the other end of PEG. The amidation reaction of the amino group enables the successful incorporation of FA, enhancing the material's targeting capabilities. The structure and purity of the synthesized ZIF-90 were further confirmed by XRD analysis. As shown in Fig. 2b, the X-ray diffraction pattern of the synthesized ZIF-90 is in good agreement with the simulated pattern based on single-crystal X-ray data, which clearly indicates that a pure ZIF-90 phase was obtained. After loading the chemotherapeutic drug HCPT, the position of the XRD diffraction peak remained basically unchanged. This indicates that the symmetry of the crystal did not shrink or change, and the crystal structure was not destroyed. It was observed that for HCPT@ZIF-90-PEG-FA, the positions of the main diffraction peaks remained unchanged, but some new peaks appeared at lower angles. These new peaks may be associated with the scattering factor of folic acid FA. The zeta potentials of ZIF-90, HCPT, HCPT@ZIF-90, and HCPT@ZIF-90-PEG-FA were 33.8 ± 1.35 mV, −33.0 ± 1.33 mV, 13.0 ± 0.91 mV, and −17.2 ± 0.90 mV, respectively (Fig. S4†). The zeta potential of HCPT@ZIF-90 is lower than that of ZIF-90. This is because the surface of drug-loaded ZIF-90 is covered with a small amount of HCPT due to strong absorption. Compared with other nano-MOFs, the PEG-FA-coated nano-MOFs exhibited negative surface charge characteristics due to the PEG-FA amino groups, confirming the successful linkage of PEG-FA.
Thermogravimetric analysis (TGA) was performed on additional ZIF-90, HCPT@ZIF-90, and HCPT@ZIF-90-PEG-FA (Fig. 2c). At 30–200 °C, most of the residual solvents (water, DMF) in ZIF-90, HCPT@ZIF-90, and HCPT@ZIF-90-PEG-FA will be activated and removed, resulting in a decrease in weight. When the temperature reaches about 255 °C, the weight of HCPT@ZIF-90 and HCPT@ZIF-90-PEG-FA decreases sharply, while the weight of ZIF-90 hardly drops, maintaining a flat surface. This indicates that the HCPT organic matter begins to decompose due to heat (HCPT's melting point is about 255 °C), showing successful loading of HCPT on ZIF-90. When the temperature reaches 300 °C, the ZIF-90 skeleton begins to collapse. As can be seen in the figure, the weight decreases between 300 and 800 °C, indicating the collapse of the ZIF-90 skeleton. Among the three samples with the same weight, HCPT@ZIF-90-PEG-FA has the lowest remaining weight. This is because it contains a long chain of PEG, so more weight is lost through thermal decomposition. This can indirectly indicate that PEG has been successfully attached to the ZIF-90 material. The porosity of the synthesized ZIF-90 and HCPT@ZIF-90-PEG-FA was investigated through nitrogen adsorption experiments (Fig. 2d). The BET (Brunauer–Emmett–Teller) surface areas are 498.2459 and 233.5705 m2 g−1, respectively. The analysis showed that the porous structure of HCPT@ZIF-90-PEG-FA still existed, but the modification of HCPT and PEG-FA slightly decreased the BET. Furthermore, the pore size analysis of the synthesized ZIF-90 revealed that it is a mesoporous material (Fig. S5†).
3.2 Drug loading and release
In this study, the loading and release behavior of HCPT, a drug known for inhibiting cancer cell growth, in ZIF-90 nanoparticles was explored. The standard concentration curves for HCPT were established using UV-visible spectroscopy, as illustrated in Fig. S6.† The calculated results revealed that the loading rate of HCPT on ZIF-90 nanoparticles is 22.3%.We investigated the release behavior of HCPT@ZIF-90 in the presence of ATP, considering the high ATP concentrations (1–10 mM) in the tumor microenvironment (TME). As shown in Fig. 3a, in a PBS solution at pH 7.4, only 30.5% of HCPT was released from the HCPT@ZIF-90 solution within a 10 hour period, thereby ensuring high biocompatibility and minimal side effects on normal tissues. In the same pH 7.4 PBS solution, the addition of 10 mM ATP resulted in only a 51.8% release of HCPT within 10 hours. Contrastingly, the release rate of HCPT from HCPT@ZIF-90 in a pH 5.4 PBS solution, with or without 10 mM ATP, was considerably accelerated, with approximately 67.0% and 80.1% being released, respectively, after 10 hours. This can be attributed to the superior coordination capability of ATP with Zn2+ over imidazole. This causes an excess of ATP in HCPT@ZIF-90 to displace 2-ICA in ZIF-90, leading to the breakdown of the ZIF-90 structure and the rapid release of HCPT. At pH 5.0 and 10 mM ATP, the release rate of HCPT from HCPT@ZIF-90 was 84.7%.
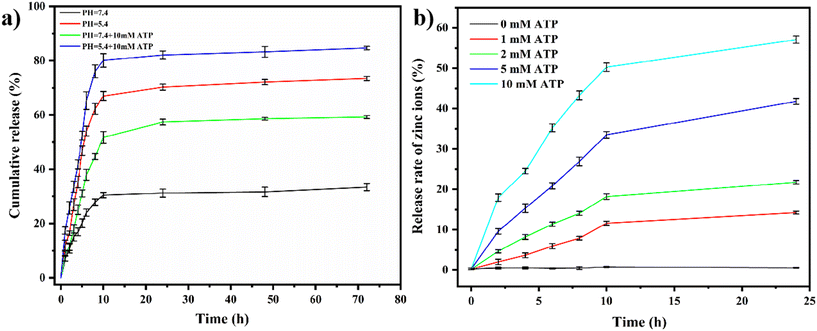 | ||
| Fig. 3 (a) The release profiles of HCPT under different conditions; (b) the release spectra of zinc ions in ZIF-90 in the presence of different concentrations of ATP. | ||
In conclusion, the structural instability of ZIF-90 in weak acid and ATP promotes HCPT release in tumor cells. These findings suggest that HCPT@ZIF-90 can protect the release of HCPT from ZIF-90 at physiological pH, while lower pH triggers rapid drug release into the TME or tumor cells, especially in organelles with high ATP levels.
The release of zinc ions at different ATP concentrations (1–10 mM) was measured using inductively coupled plasma emission spectroscopy (ICP-OES) (Fig. 3b). The results showed that the release of zinc ions increased with the increase in ATP concentration in a concentration-dependent manner. This result also reflects the decomposition of the ZIF-90 framework in the presence of ATP. The concentration of ATP in the internal environment of cancer cells is mostly 1–10 mM. At this point, the ZIF-90 framework breaks down and releases the anti-cancer drug HCPT, which kills the cancer cells. However, the concentration of ATP in the normal intracellular environment is very low. Therefore, HCPT is not released, reducing its killing effect on normal cells.
In Fig. 3b, it is evident that the release of Zn2+ is nearly zero in the absence of ATP. This is because the ZIF-90 framework remains intact under neutral conditions, preventing the release of Zn2+. In Fig. 3a, we can observe that in a PBS solution with a pH of 7.4, the drug release reached approximately 30% after 10 hours. This can be attributed to the partial loading of chemotherapy drugs onto the surface of ZIF-90 through physical adsorption. Due to the weak interaction force, drugs were diffused and released. Since ZIF-90 does not lyse under neutral conditions, the drug trapped in the deep pore is not released, resulting in minimal release amounts.
We further investigated the release mechanism of ZIF-90 through XRD diffraction (Fig. S7†). The analysis revealed that the crystal structure of ZIF-90 underwent changes, and the position of the diffraction peak shifted in the pH = 5.4 and 10 mM ATP environment. However, at pH = 7.4, the diffraction peak of ZIF-90 remained unchanged, indicating that the crystal structure remained intact. TEM (Fig. S8†) showed that at pH = 7.4, the morphology of ZIF-90 remains consistent, maintaining a regular dodecahedral shape, while it changes at pH = 5.4, becoming irregular in the presence of ATP.
3.3 In vitro hemolysis in ZIF-90
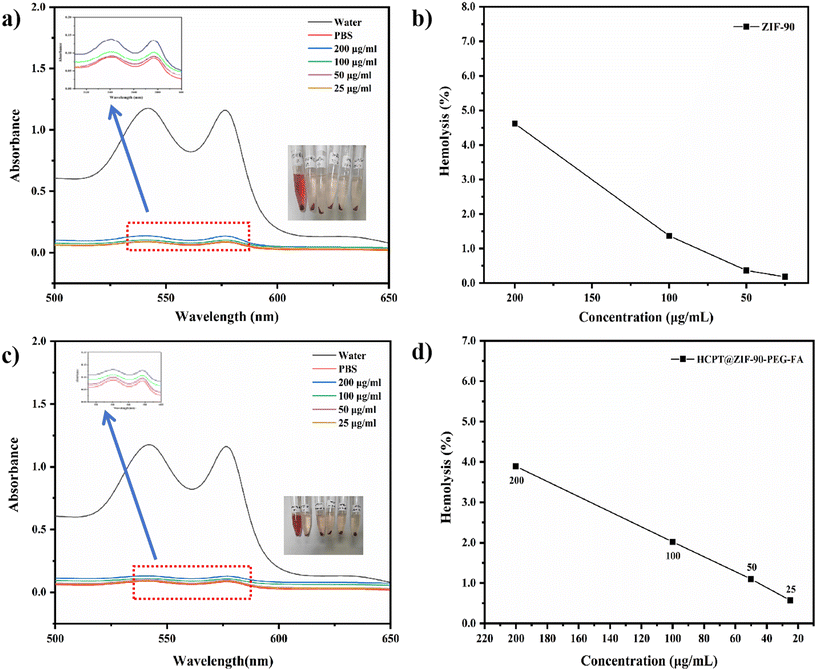
The hemocompatibility of ZIF-90 and HCPT@ZIF-90-PEG-FA was evaluated through a hemolytic assay, with PBS buffer used as the negative control group. Distilled water was used as a replacement for PBS to establish the positive control group, representing 100% hemolysis. After a 4 hour incubation with different concentrations of ZIF-90 (25–200 μg mL−1), erythrocytes exhibited no significant color change compared to the initial PBS solution. This indicates a low hemolysis rate for ZIF-90 (Fig. 4a) and HCPT@ZIF-90-PEG-FA (Fig. 4c). Based on the hemolysis calculation formula, the rate of hemolysis decreased as the concentration increased. Among these concentrations, the sample with the maximum concentration (200 μg mL−1) displayed a hemolysis rate of 4.62% for ZIF-90 (Fig. 4b) and 3.89% for HCPT@ZIF-90-PEG-FA (Fig. 4d). This maintained a hemolysis rate below 5%, in accordance with the standards prescribed by the Chinese Pharmacopoeia.3.4 In vitro cellular cytotoxicity
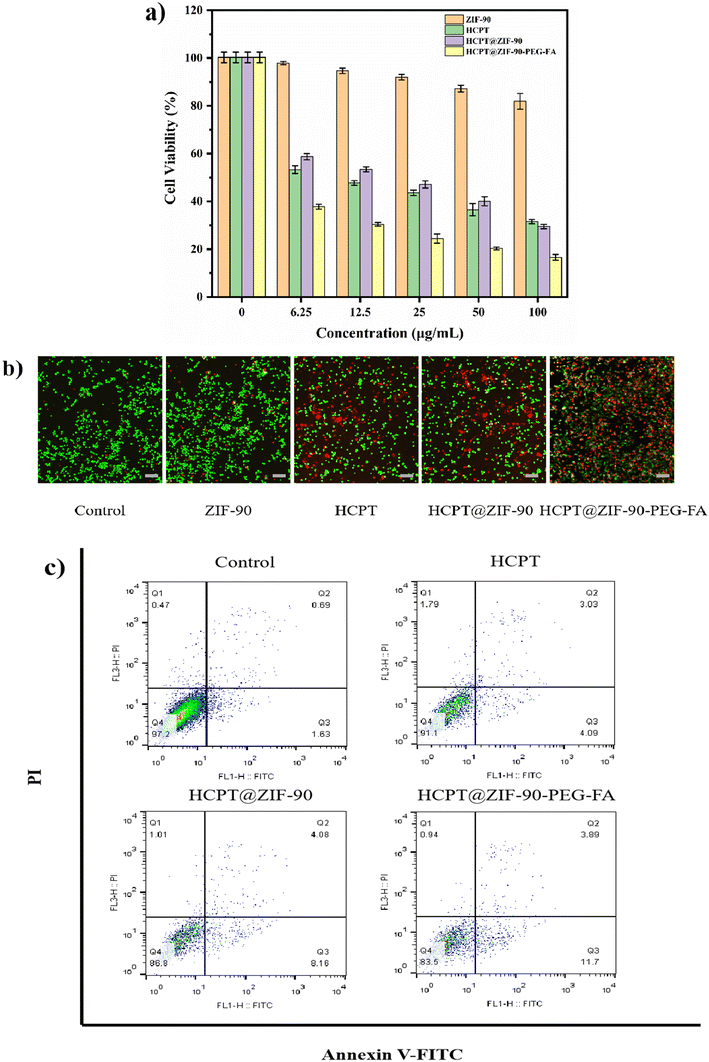
Initially, the cytotoxicity of the ZIF-90 series against HCT116 cells was evaluated using a standard methyl thiazolyl tetrazolium (MTT) assay, where cell viability served as a measure of cytotoxicity. Referring to Fig. 5a, at concentrations ranging from 6.25 to 100 μg mL−1, the survival rate of cells exposed to ZIF-90 nanomaterials was over 80%, indicating excellent biocompatibility of ZIF-90. The cell survival rates of HCPT, HCPT@ZIF-90, and HCPT@ZIF-90-PEG-FA all exhibited a decreasing trend with increasing concentration, indicating a concentration-dependent effect. Concurrently, it is notable that the cell survival rate of HCPT@ZIF-90-PEG-FA at each concentration was lower than that of HCPT and HCPT@ZIF-90, with the survival rate at 100 μg mL−1 being 16.61 ± 1.19%. This can be attributed to the active targeting effect of folic acid and the hydrophilicity of PEG, which significantly increase the water solubility of HCPT. This suggests that HCPT@ZIF-90-PEG-FA significantly inhibits the proliferation of HCT116 cells.Calcein-AM (green) and propidium iodide (PI) (red) were used for dual staining of live and dead cells, which further validated the apoptosis-inducing effect (Fig. 5b). The control group mainly showed green fluorescence, whereas ZIF-90 only had a minimal number of dead cells. But HCPT, HCPT@ZIF-90-PEG-FA, and HCPT@ZIF-90-PEG-FA exhibited more dead cells, with HCPT@ZIF-90-PEG-FA showing the most intense red fluorescence, suggesting the highest number of dead cells. This result confirms that the synthesized HCPT@ZIF-90-PEG-FA can effectively induce apoptosis in cancer cells.
Additionally, flow cytometry was employed to demonstrate the therapeutic efficacy of the control group (PBS), HCPT, HCPT@ZIF-90, and HCPT@ZIF-90-PEG. As shown in Fig. 5c, the results were consistent with the live and dead cell staining and MTT assay mentioned earlier. Particularly, HCPT@ZIF-90-PEG-FA accounted for 83.5% of live cells, which was the lowest.
3.5 Cell cycle
The experimental results revealed a significant and notable alteration in the cell cycle of cancer cells after the application of 10 μg mL−1 ZIF-90 series nanomaterials to the cultures. Compared to the untreated cells, which showed sub G1 = 0.69%, G1 = 39.86%, S = 51.77%, and G2/M = 7.67%, the HCPT@ZIF-90-PEG-FA-treated cells exhibited a significant blockade in both the G1 phase (53.56%) and G2/M phase (10.83%). These results were similar to those observed in cells treated with HCPT or HCPT@ZIF-90 (Fig. 6). However, the extent of the G1 phase and G2 phase blockades was more pronounced in the HCPT@ZIF-90-PEG-FA-treated cells compared to those treated with ZIF-90 and HCPT@ZIF-90. Based on these observations, we hypothesize that HCPT@ZIF-90-PEG-FA may inhibit the proliferation of cancer cells by blocking DNA synthesis and arresting cell cycle progression.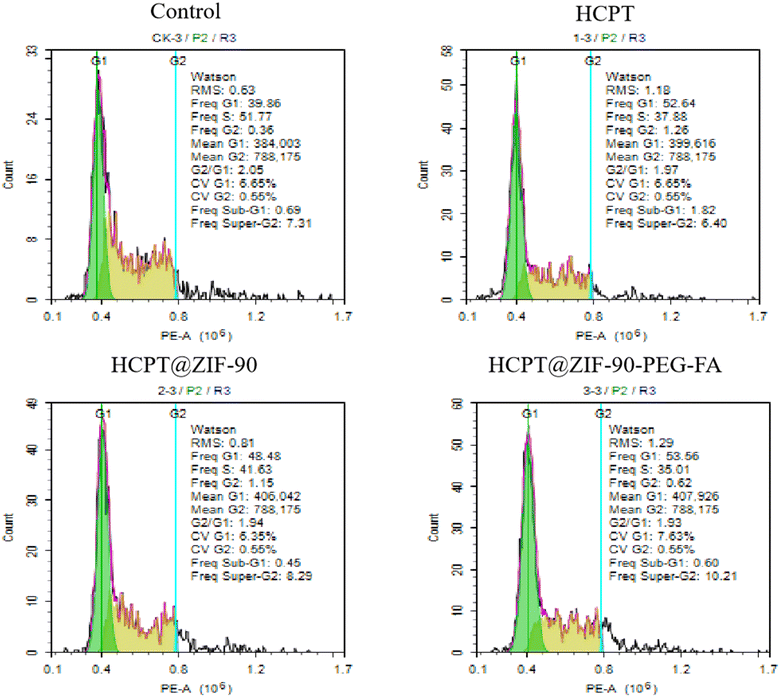 | ||
| Fig. 6 The effects of HCPT, HCPT@ZIF-90, HCPT@ZIF-90-PEG-FA on the cell cycle of HCT116 cells after 24 hours. | ||
3.6 Cell uptake
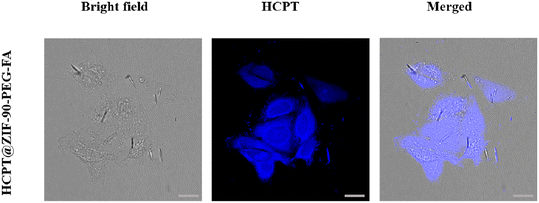
To determine the uptake of HCPT@ZIF-90-PEG-FA by HCT116 cells, an uptake experiment was conducted and subsequently examined using laser confocal microscopy.35 The results, as shown in Fig. 7, indicate that the blue fluorescence represents HCPT, while the gray fluorescence indicates the HCT116 cells. After a 6 hour drug incubation period, the HCPT@ZIF-90-PEG-FA was mainly observed in the cytoplasm of HCT116 cells, indicating successful drug penetration into the cells. As demonstrated, HCPT@ZIF-90-PEG-FA can accurately target HCT116 tumor cells, potentially leading to effective tumor treatment.3.7 In vivo tumor inhibition ability
Based on the excellent ATP-triggered and pH-sensitive drug release, as well as the biodegradable properties, the antitumor effects of HCPT@ZIF-90-PEG-FA nanoparticles in tumor-bearing mice were further explored. Tumor-bearing mice (16) were randomly divided into four groups, with four mice in each group: (a) PBS group, (b) HCPT group, (c) HCPT@ZIF-90 group, and (d) HCPT@ZIF-90-PEG-FA group. The curves of the body weight change and tumor volume change are shown in Fig. 8a and b. During the treatment period, there was no significant difference in body weight between the PBS group and the drug group, indicating a consistent growth trend. This suggests that the substance was less toxic to mice. The tumor growth in the PBS group was significantly faster than that in the drug group, indicating that HCPT has a certain inhibitory effect on tumor growth in vivo. In contrast, the HCPT and HCPT@ZIF-90 groups can effectively inhibit tumor growth with comparable therapeutic efficacy. This is because the ZIF-90 nanomaterial framework did not completely collapse in mice, and the released HCPT did not reach the theoretical quantity. However, the curative effect of HCPT and HCPT@ZIF-90 is not as good as that of HCPT@ZIF-90-PEG-FA. This is attributed to the EPR effects, pH-responsive drug release, and folic acid-mediated active targeting effects, which significantly enhance anti-tumor efficacy. The photograph of excised tumors from each group after treatment is shown in Fig. 8c. Tumor-bearing mice injected with HCPT@ZIF-90-PEG-FA exhibited significantly smaller tumor sizes compared to those treated with other samples.4. Conclusion
In conclusion, the synthesized HCPT@ZIF-90-PEG-FA exhibited uniform size and significant stability. This demonstrated the superior drug loading efficiency of ZIF-90, possessing ATP-triggered and pH-sensitive release characteristics. Compared to the direct application of free HCPT and other formulations like HCPT@ZIF-90, HCPT@ZIF-90-PEG-FA has demonstrated outstanding anti-colon cancer therapeutic effects both in vitro and in vivo. The enhanced cytotoxicity aimed at eliminating cancer cells resulted from the increased internalization of HCPT, facilitated by folate receptor (FR)-induced endocytosis, and improved permeability and retention (EPR) effects. Cell uptake results suggest that HCPT@ZIF-90-PEG-FA could enhance drug accumulation in tumors, positioning it as a promising candidate for targeted cancer therapy. Due to its low water solubility, poor stability, high toxicity, and side effects, the clinical application of HCPT is limited. Loading HCPT onto stimulation-responsive nanoMOFs is a very advantageous treatment method. The dual-responsive metal–organic framework (MOF) nanocarrier, combined with active targeting using folic acid, enables precise targeting and action on HCT116 cells by the HCPT chemotherapy drug. This platform harbors immense potential for enhancing therapeutic outcomes and extending the applications of MOFs in cancer therapy.Conflicts of interest
The authors declare no competing financial interest.Acknowledgements
This work was financially supported by the National Natural Science Foundation of China (grant No. 21967019), the Yunnan Applied Basic Research Projects (202201AT070067), the Postgraduate Research and Innovation Foundation of Yunnan University (No. KC-22222136), and Graduate Research Innovation Fund Project of Yunnan University (No. KC-23234500). The authors thank the Advanced Analysis and Measurement Center of Yunnan University for the sample testing service. The authors would like to thank Tong Qi from Shiyanjia Lab (https://www.shiyanjia.com) for the partial biological testing.References
- F. Rehan, N. Ahemad, R. A. Islam, M. Gupta, S. H. Gan and E. H. Chowdhury, Pharmaceutics, 2020, 12, 984 CrossRef CAS PubMed.
- A. Turna and İ. Sarbay, J. Thorac. Dis., 2020, 12, 7626–7634 CrossRef PubMed.
- A. Prat, E. Pineda, B. Adamo, P. Galvan, A. Fernandez, L. Gaba, M. Diez, M. Viladot, A. Arance and M. Munoz, Breast, 2015, 24, S26–S35 CrossRef PubMed.
- D. N. Kumar, A. Chaudhuri, F. Aqil, D. Dehari, R. Munagala, S. Singh, R. C. Gupta and A. K. Agrawal, Cancers, 2022, 14, 1435 CrossRef CAS PubMed.
- D.-H. Bach, J.-Y. Hong, H. J. Park and S. K. Lee, Int. J. Cancer, 2017, 141, 220–230 CrossRef CAS PubMed.
- Y. Chen, Z. Wang, X. Wang, M. Su, F. Xu, L. Yang, L. Jia and Z. Zhang, Int. J. Nanomed., 2022, 17, 4227–4259 CrossRef PubMed.
- J. Dong, S. Guo and Y. Wang, Zhongguo Zuzhi Gongcheng Yanjiu Yu Linchuang Kangfu, 2008, 12, 4507–4510 CAS.
- Q. Yin, J. Shen, Z. Zhang, H. Yu and Y. Li, Adv. Drug Delivery Rev., 2013, 65, 1699–1715 Search PubMed.
- J. Pardo, Z. Peng and R. Leblanc, Molecules, 2018, 23, 378 CrossRef PubMed.
- Z. Mousavikhamene, M. J. Abdekhodaie and H. Ahmadieh, Mater. Sci. Eng., C, 2017, 79, 812–820 CrossRef CAS PubMed.
- X. Gao, M. Zhai, W. Guan, J. Liu, Z. Liu and A. Damirin, ACS Appl. Mater. Interfaces, 2017, 9, 3455–3462 CrossRef CAS PubMed.
- H. Zhao, S. Hou, X. Zhao and D. Liu, J. Chem. Eng. Data, 2019, 64, 1851–1858 CrossRef CAS.
- S.-X. Lin, W.-L. Pan, R.-J. Niu, Y. Liu, J.-X. Chen, W.-H. Zhang, J.-P. Lang and D. J. Young, Dalton Trans., 2019, 48, 5308–5314 RSC.
- Z. Xue, M. Zhu, Y. Dong, T. Feng, Z. Chen, Y. Feng, Z. Shan, J. Xu and S. Meng, Nanoscale, 2019, 11, 11709–11718 RSC.
- X. Xiao, S. Liang, Y. Zhao, D. Huang, B. Xing, Z. Cheng and J. Lin, Nanoscale, 2020, 12, 3846–3854 RSC.
- X.-X. Cao, S.-L. Liu, J.-S. Lu, Z.-W. Zhang, G. Wang, Q. Chen and N. Lin, J. Solid State Chem., 2021, 300, 122259 CrossRef CAS.
- C.-I. Yen, S.-M. Liu, W.-S. Lo, J.-W. Wu, Y.-H. Liu, R.-J. Chein, R. Yang, K. C. W. Wu, J. R. Hwu, N. Ma and F.-K. Shieh, Chem. – Eur. J., 2016, 22, 2925–2929 CrossRef CAS PubMed.
- C. G. Jones, V. Stavila, M. A. Conroy, P. Feng, B. V. Slaughter, C. E. Ashley and M. D. Allendorf, ACS Appl. Mater. Interfaces, 2016, 8, 7623–7630 CrossRef CAS PubMed.
- F.-M. Zhang, H. Dong, X. Zhang, X.-J. Sun, M. Liu, D.-D. Yang, X. Liu and J.-Z. Wei, ACS Appl. Mater. Interfaces, 2017, 9, 27332–27337 CrossRef CAS PubMed.
- Z. Jiang, Y. Wang, L. Sun, B. Yuan, Y. Tian, L. Xiang, Y. Li, Y. Li, J. Li and A. Wu, Biomaterials, 2019, 197, 41–50 CrossRef CAS PubMed.
- X.-X. Chen, M.-J. Hou, G.-J. Mao, W.-X. Wang, F. Xu, Y. Li and C.-Y. Li, Microchim. Acta, 2021, 188, 287 CrossRef CAS PubMed.
- J. Fang, W. Islam and H. Maeda, Adv. Drug Delivery Rev., 2020, 157, 142–160 CrossRef CAS PubMed.
- J. Shen, M. Ma, H. Zhang, H. Yu, F. Xue, N. Hao and H. Chen, ACS Appl. Mater. Interfaces, 2020, 12, 45838–45849 Search PubMed.
- Z. Chen, R. K. Kankala, L. Long, S. Xie, A. Chen and L. Zou, Coord. Chem. Rev., 2023, 481, 215051 CrossRef CAS.
- L. F. de Oliveira, K. Bouchmella, K. D. A. Gonçalves, J. Bettini, J. Kobarg and M. B. Cardoso, Langmuir, 2016, 32, 3217–3225 CrossRef CAS PubMed.
- H. Chen, Y. Zhang, X. Xin, N. Feng, D. Wu, J. Zhang, B. Fang and N. Zhang, Microporous Mesoporous Mater., 2021, 319, 111033 CrossRef CAS.
- A. Behl, V. S. Parmar, S. Malhotra and A. K. Chhillar, Polymer, 2020, 207, 122901 CrossRef CAS.
- J. Li, L. Zheng, H. Cai, W. Sun, M. Shen, G. Zhang and X. Shi, Biomaterials, 2013, 34, 8382–8392 CrossRef CAS PubMed.
- H. Zhang, W. Jiang, R. Liu, J. Zhang, D. Zhang, Z. Li and Y. Luan, ACS Appl. Mater. Interfaces, 2017, 9, 19687–19697 CrossRef CAS PubMed.
- C. Yu, W. Zhu, Z. He, J. Xu, F. Fang, Z. Gao, W. Ding, Y. Wang, J. Wang, J. Wang, A. Huang, A. Cheng, Y. Wei and S. Ai, Colloids Surf., A, 2021, 615, 126255 CrossRef CAS.
- Q. Chen, K. Li, S. Wen, H. Liu, C. Peng, H. Cai, M. Shen, G. Zhang and X. Shi, Biomaterials, 2013, 34, 5200–5209 CrossRef CAS PubMed.
- S.-H. Zhou, R.-D. Wang, J.-C. Guo, S.-M. Zhou, X. Zhou, J. Du, Q.-H. Zhao, X. Ren and M.-j. Xie, Eur. J. Med. Chem., 2023, 262, 115892 CrossRef CAS.
- I. P. Sæbø, M. Bjørås, H. Franzyk, E. Helgesen and J. A. Booth, Int. J. Mol. Sci., 2023, 24, 2914 CrossRef PubMed.
- S.-H. Zhou, W.-H. Liao, Y. Yang, W. Li, Y.-Y. Wu, T.-T. Wu, S.-H. Deng, J. Zhou, Z. Li, Q.-H. Zhao, J.-Y. Xu, C. Chen and M.-J. Xie, ACS Omega, 2023, 8, 6945–6958 CrossRef CAS PubMed.
- Z. Si-Han, W. Rui-Dong, W. Tian-Tian, D. Shi-Hui, G. Ji-Chao, Z. Shu-Min, Z. Xuan, D. Jiajia, Z. Qi-Hua, R. Xiaoxia and X. Ming-jin, Eur. J. Med. Chem., 2023, 262, 115892 CrossRef.
Footnote |
| † Electronic supplementary information (ESI) available. See DOI: https://doi.org/10.1039/d3md00725a |
| This journal is © The Royal Society of Chemistry 2024 |

