 Open Access Article
Non-ideal nernstian behavior in organic electrochemical transistors: fundamental processes and theory†
Bianca de Andrade
Feitosa
 *ab,
Bruno Bassi Millan
Torres
a,
Marcos
Luginieski
a,
Douglas José
Coutinho
c and
Gregório Couto
Faria
 a
a
aInstituto de Física de São Carlos (USP), São Carlos-SP, 13566-590, Brazil. E-mail: bianca.feitosa@alumni.usp.br
bEscola de Engenharia de São Carlos (USP), São Carlos-SP, 13563-120, Brazil
cUniversidade Tecnológica Federal do Paraná (UTFPR), Toledo-PR, 85902-490 Toledo-PR, Brazil
First published on 25th September 2024
Abstract
Despite the successful implementation of organic electrochemical based devices (OEDs), fundamental processes that regulate their operations and sensing capabilities, specifically those related to ion-to-electron transduction, remain unclear. Indeed, there is still a lack of fundamental models to explain the steady-state and transient characteristics of OEDs, associating fundamentals of the physical-chemistry of the pair polymer–electrolyte with the output performance of such devices. In this study, we bring new highlights to a thermodynamic-based model that qualitatively and quantitatively describes OEDs operation, with a special focus on the organic electrochemical transistor (OECT). In this context, we introduce novel interpretations for traditional drain current models, grounded in thermodynamic and electrochemical principles. The model fitting parameters are correlated to the physical and chemical properties of the polymer–electrolyte pair, and it has been shown to explain trends observed in experimental results from the literature. Moreover, our model reveals that a non-Nerstian electrochemical behavior dominates OECT operation. Also, by analyzing experimental data, we are able to generate guidelines for material design and device development, targeting highly sensitive electrochemical biosensors and devices.
New conceptsOrganic mixed ionic electronic conductors (OMIECs) efficiently couple ionic and electronic transport making them an ideal material class for fabricating bioelectronic devices. Among several OMIEC-based platforms, organic electrochemical transistors (OECT) have been the device of choice for fabricating bioelectronic and biosensing devices. However, due to the diversity of these materials, establishing a correlation between device response and the pair polymer–electrolyte properties has proven to be challenging. Few attempts have been made through theoretical models to establish this correlation, however, without considering the fundamentals of electrochemistry and thermodynamics. Here, we introduce alternative interpretations to the traditional OECT models of drain current, grounded in electrochemical and thermodynamic principles. Different from other models available in the literature, it is possible to analytically solve the model for experimental curves, and quantitatively explain correlations observed in previous studies. The model reveals the origin of the effects between the characteristics of the channel material and electrolyte on the performance of the device. Moreover, based on electrochemical characterizations of OMIECs, the model allows us to predict whether an OECT built for a specific combination of OMIEC and electrolyte will operate. This finding streamlines the selection of materials and electrolytes for OECT applications, indicating the ideal conditions for their use. |
Introduction
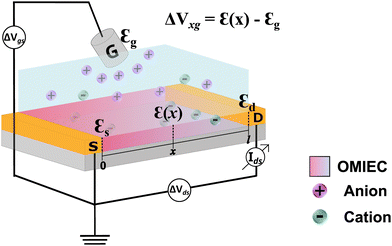
Organic mixed ionic and electronic conductors (OMIECs) have emerged in the last decades as promising materials in materials science, bioelectronics, and neuromorphic computing.1–5 These are conjugated polymers and organic molecules that, in certain conditions,6 can transport electronic charge carriers and ions with similar efficiencies.7–10 The association of these two characteristics allows their application as the platform of choice in the next generation of ion–electron devices including batteries, supercapacitors, electrochromic displays, and organic electronic transistors.11 In ideal conditions, OMIECs materials exhibit the ability to be swollen by solvents and, therefore, to efficiently transport ionic species.6,12–14 OMIECs are mostly organic π-conjugated polymers, many of them polythiophene derivatives.13,15,16 Indeed, in the recent past, π-conjugated polymers were heavily investigated due to their electronic properties only, being successfully applied as lighting-emitting diodes (LEDs), photovoltaics (PV) and field effect transistors (FET).17–19 However, with the advent of organic bioelectronics and the need to electronically interface biology, OMIECs have gained unprecedented attention, making the field of organic electronics continue to soar.2,5,20One of the most successful OMIEC-based platforms is the organic electrochemical transistor (OECT).8,21 Such a component has attracted attention due to its ability to transduce ionic into electronic signals with high gain.22,23 As in the traditional transistors, OECTs are three-terminal devices (Fig. 1). Two of them, the drain and source, are pre-patterned and connected by a semiconductor polymer film (OMIEC), defining the transistor channel. The third electrode, known as the gate electrode, is immersed into an electrolyte that is normally placed on top of the transistor channel.24,25 During OECT operation, a gate voltage is applied inducing ion migration from the electrolyte into the channel. The ion uptake by the semiconductor channel alters the current flowing between the drain and source electrodes, due to doping or depoping of the semiconductor. This leads to modulation of drain–current, based on the oxidation/reduction state of the active polymer deposited in the transistor channel.26–28 Indeed, the presence of an electrolyte as part of the OECT structure, allows it to be applied as the device of choice for mimicking and interfacing biological systems and media.5 Some of these applications are sensors for electrophysiological monitoring, neuromorphic devices, and biosensors to name a few.3,29,30
OECTs can operate in two modes: depletion and accumulation.21 The primary distinction lies in the initial doping state of the material employed in the channel. In depletion mode, the OMIEC is initially doped, (oxidized for p-type and reduced for n-type), and, therefore, has a high charge-carrier density. In this situation, the device is said to be in its ON state. Through the modulation of the gate voltage, the device gradually turns OFF by the migration of ions into the bulk of the channel, de-doping the channel material. In accumulation mode, OMIEC is initially undoped and modulation of the gate voltage reduces (for a p-type channel) or oxidizes (in case of an n-type) the semiconductor, turning the device ON, by increasing the channel conductivity.
OMIECs such as the poly(3,4-ethylenedioxythiophene) doped with poly(styrene sulfonate) (PEDOT:PSS) and poly(3-hexylthiophene) (P3HT) have been extensively used as active layers on OECTs, even producing records on transistors’ transconductance and ON/OFF ratio.6,31 Due to the wide library of available molecules, that are constantly updated with new ones,32,33 establishing relationships between the pair polymer–electrolyte properties with the output performance of such devices is essential to the development and fundamental understanding of the field.1,2 Progress has already been made correlating molecule design and device processing with microstructure, over ionic–electronic properties.8,13,33–35 However, a fundamental understanding of OECTs, especially associating the physical and chemical properties of the OMIEC–electrolyte pair with the output performance of such devices is still lacking in the technical literature.
Indeed, few models have already been developed to describe OECT steady-state and transient responses.24,36–44 The main models used to describe the behavior of OECTs are divided into two primary groups: capacitive-based models and drift-diffusion-based models.36 Among the capacitive models, the most famous one is the Bernard and Malliaras Model (B&M Model), proposed in 2007 to describe steady-state and transient behavior.37 The B&M model assumes two circuits, one electronic and another ionic, to describe OECT devices. The ionic circuit, however, is oversimplified, summarizing the rich ion-to-electron transduction to an equation that considers an ideal capacitor as the ionic reservoir.37,45 Needless to say, ion-to-electron transduction can only be described based on electrochemistry and thermodynamic equilibrium, making capacitive models oversimplified for fundamental studies. As a consequence, the data cannot be properly adjusted and explained through these models.41 On the other hand, drift-diffusion models have gained emphasis in recent years as a more sophisticated alternative to the capacitive-based models.39,41,43,44 However, it is necessary to make use of intricate numerical solutions due to the complexity of the equations used in describing OECTs, making them not easily accessible to a non-mathematical audience.
Few attempts to use electrochemical fundamentals to develop OMIEC-based device models have been made in the past.39,40 One of the first was carried out by Robinson et al. (2006).40 The authors were able to describe the linear and saturation regimes of OECT operation. However, their model development only allowed for qualitative discussions, not being possible, for instance, to fit experimental curves and extract useful parameters. More recently, Shirinskaya et al. (2018)39 also relied on the Nernst and Nernst–Planck equations for the steady-state OECT operation. Although their model could reproduce experimental curves, this was only possible through complicated numerical solutions, not completely accessible to the diverse bioelectronics community.
Recently, Cucci et al. (2022)46 proposed a model based on mixture thermodynamics to explain the performance of organic electrochemical transistors (OECTs). The researchers highlight the role of the entropy as a key factor driving the redox processes that control the transfer properties of OECTs in electrolyte-based environments. Anchored on such principles, the authors propose a model that calculates the nonlinear and voltage-dependent charge accumulation based on the Gibbs energy, moving away from the conventional assumptions of channel as a parallel plate capacitor.
Here, we present an analytical model that describes the steady-state behavior of OECTs, which is grounded on electrochemistry and thermodynamics principles. By associating the Ohms Law, the Nernst equation, and principles of thermodynamic equilibrium, we were able to derive a drain–current equation that fully describes the steady-state OECT behavior (both, linear and saturation region). The equation has three fitting parameters that are correlated to the OMIEC–electrolyte pair properties, anchored on electrochemistry and thermodynamic fundamentals. By performing fittings of experimental results published elsewhere in the literature,26,47 we were able to extract fundamental parameters (namely, σ, γ and  ) and correlated them to the findings discussed in the respective reports. Indeed, the model not only showed to be able to explain trends observed in steady-state transistors results but also, suggests that the electrochemical mechanism behind the OECT operation relies on non-ideal Nernstian behavior, allowing for a deeper comprehension of the OECT principles. The model, therefore, represents a new, accessible, and powerful tool for describing, studying, understanding, and designing OECT materials and devices.
Results and discussion
Model development
 | (1) |
 is the electrode potential, where A refers to the electrode of interest referenced against electrode B. Such electrode potential difference depends on the electrical potential (Φ) added to the chemical potential (μ), as described in eqn (1). For fundamental details on eqn (1), refer to ref. 48.
In electrochemical equilibrium, the electrode potential  associated with a particular electrochemical reaction is governed by the Nernst equation (eqn (2)). There
  is the standard electrode potential for a particular reaction, R is the gas constant, T is the temperature, F is the Faraday constant, z is the number of electrons transferred in the reaction, and νi are the stoichiometric coefficients. νi assumes positive values for products and negative for reactants, while ai represents the activities of the species involved. The concept of activity arises from thermodynamics to differentiate ideal from real mixtures, and for ideal systems, is often approximated to be equal to the concentration of species (ci).49–51
 | (2) |
Electrochemical potentials are often standardized against a reference electrode, which has a constant electrode potential and, ideally, is of a non-polarizable nature. Commonly used reference electrodes are the hydrogen electrode (SHE), calomel (Hg/Hg2Cl2), and silver/silver chloride electrode (Ag/AgCl) in saturated KCl, to name a few.50 The OMIEC and OECT communities often use wire or pellets of Ag/AgCl as gate electrodes, immersed into an electrolyte solution that may not have a constant composition, which from an electrochemical standpoint makes it a quasi-reference electrode.51 Keeping these concepts in mind, the Ag/AgCl quasi-reference electrode will be considered in the model herein developed and will be referred to as the “gate electrode”. It is worth-mentioning that OMIEC-based gate electrodes have been already proposed and used in OECTs, replacing the traditional Ag/AgCl. For instance, Au covered with PEDOT:PSS gate–electrodes have shown to be particularly useful, especially in planar OECT structures.52,53 Therefore, in the ESI,† Section S.1, we expand our model development also for the case of PEDOT:PSS-based gate electrodes.
The ideal behavior (Nernstian behavior)
Indeed, the choice of Ag/AgCl wire as the gate electrode in an OECT is due to its ability to act as a non-polarizable electrode.50 This means the electrode potential remains constant despite the current flowing through it, due to the fast kinetics of the reaction taking place at the electrode,51 as described in eqn (3). In this situation, there is a redox equilibrium involving the electrode (solid phase) composed by silver (Ag0) and silver chloride (AgCl) with chloride ions in solution.| AgCl + e− ⇄ Ag0 + Cl− | (3) |
 | (4) |
 corresponds to +0.222 V,51 and the concentration of Cl− is assumed to be constant. Considering the transistor channel and gate electrode as the OECTs electrochemical cell,
  and
and  define the film and gate electrode potentials, respectively. Therefore, the measured voltage across the cell is then given by the difference between these two electrode potentials:
 | (5) |
During OECT operation, the redox reaction in the gate electrode is coupled with the oxidation/reduction in the channel active material. The former is summarized by the reaction in eqn (6), and its corresponding Nernst equation is given by eqn (7), see below. Here it is assumed a monoelectronic reaction in the channel, where the CRed0 and COx+ corresponds to the concentration of reduced and oxidized species respectively, and  is the standard electrode potential semiconductor polymer:
| Ox+idized + e− ⇄ Red0uced | (6) |
 | (7) |
| Ox+idized + Ag0 + Cl− ⇄ Red0uced + AgCl | (8) |
 | (9) |
 and
and  . Therefore, these potentials are summarized in a formal electrode potential, defined as
  .
.
It is also assumed that there is a total density of available states for reduction/oxidation corresponding to the maximum total number of carriers’ concentration within the channel (ρmax), as defined in (eqn (10)). Notice that the definition of ρmax respects the mass conservation.
| ρmax = CRed0 + COx+ = constant | (10) |
The number of carriers within the active layer at a given applied gate voltage will be referred to as ρ. For p-type materials, ρ is equal to COx+. To avoid confusion, throughout the manuscript the model will be developed for p-type materials only. The calculations for the n-type counterparts are developed and discussed in Section SI-S2 in the ESI.†
Notice that the carrier densities will be expressed in mol cm−3 throughout this manuscript, to be in line with the standard electrochemical conventions. The definition of ρmax and ρ allows us to rewrite eqn (9) as:
 | (11) |
Eqn (11) is a general equation that holds for any type of electrochemical reaction that respects eqn (8). To apply eqn (11) in the context of an operating OECT, a few hypotheses are made. First, the transistor channel will be considered unidimensional. This implies that any ionic movement through the channel thickness will be neglected. Moreover, the electronic mobility (μe) will be considered constant, which seems to be valid, given the relatively small voltage operation of OECTs. Under these assumptions, one can write the channel potential as eqn (12):
 | (12) |
 | (13) |
 | (14) |
Through (eqn (14)) and utilizing Ohm's law (eqn (15)), it is possible to derive an analytical expression that describes the drain–source current (Ids) for the steady-state response of OECT. To obtain such a relation, the gradual channel approximation was used. This approximation assumes that the potential varies gradually along the channel from the drain to the source electrodes.54
 | (15) |
Although the maximum conductivity an OECT can achieve is given by σmax = Fμeρmax, being ρmax given by eqn (8), it is well accepted that only in very specific cases, with high-gate voltages, σmax can be achieved. Most of the OECTs results published to date do not operate in their full oxidizing state and, therefore, part of the reduced states is not accessible during the OECT operation. A classic example of it is PEDOT:PSS-based OECTs. Being a depletion mode OECT, it is almost impossible to completely turn off the transistor (Ids → 0). Therefore, one must account for the residual reduced states still left in the active film. That said the overall OECT channel current will have contributions from both portions of the channel, oxidized and reduced states. Therefore, the Ohm's Law is rewritten as eqn (16):
 | (16) |
 | (17) |
 | (18) |
To obtain the equation for the channel current, eqn (18) is then readily integrated and expressed in terms of the geometric parameters of the OECT channel. Assuming that w, h, and l represent the width, thickness, and length of the channel, respectively, one obtains:
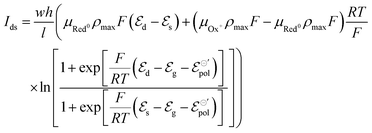 | (19) |
Here the subscripts d, s and g refer to drain, source and gate, respectively. The electrode potentials  can be rewritten as the gate (ΔVgs) and drain (ΔVds) potential applied into the device, (please, refer to the SI-S3, ESI†), leading to the following equation:
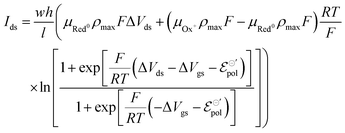 | (20) |
The product μρmaxF has S cm−1 as its physical unity, representing conductivity. This allows one to rewrite eqn (20) considering conductivity terms only. The terms related to μRed0 come from the residual conductivity of the channel, associated with electrochemical sites that are not accessed, and will be referred to σres. Those related to μOx+, give origin to the actual film conductivity, associated with the doping/dedoping process, due to the electrochemical reaction. Such conductivity will be referred to as  . That said eqn (20) can be rewritten as:
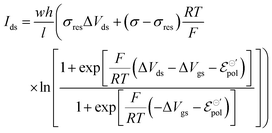 | (21) |
The same treatment can be used to describe drain–source current for devices operated with n-type material. Details on the development of the equation for n-type can be found in the ESI† (Section SI-S2). The final drain current equation for the n-type OECTs is shown below:
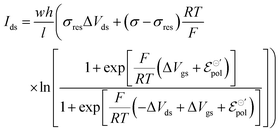 | (22) |
In eqn (21) and (22), the residual conductivity (σres), for accumulation mode OECTs, is related to the undoped state of semiconductor polymer and can be obtained from transfer curves for potentials lower than the doping potentials (see Fig. 2). For depletion mode OECTs, the residual conductivity refers to remaining doped states, and can be calculated through the saturation currents. The effect of σres over output and transfer shape curves is discussed in the ESI,† Section SI-S4.
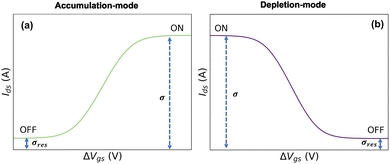 | ||
| Fig. 2 Representation of residual conductivity from transfer curves for (a) accumulation-mode OECT and (b) depletion-mode OECT. | ||
Conversely, the limit conductivity (σ) comes from the active carriers, (generated by the electrochemical reaction at the channel), and is related to the ion-to-electron transduction. Therefore, in the present model, σ assumes the role of a figure of merit in contrast to μC*, widely adopted by the OECT community to evaluate the performance of these devices. μC* was first proposed by Inal et al. (2017)55 to represent the ionic–electronic transport, through the product between electronic mobility (μ) and the volumetric capacitance (C*) of the semiconductor film. In the B&M model,37 it is assumed that the channel can be described through an equivalent RC circuit, where the ionic contribution is associated with the ideal capacitor. Although μC* is capable of describing trends observed in OECTs, the origin of C* lacks foundation regarding the fundamentals of the polymer–electrolyte electrochemical interaction. Here σ is defined from the total carrier density (ρmax), which was introduced through the Nernst equation and the law of mass conservation. Conversely, σ carries information that are correlated to the polymer–electrolyte interactions, as the other fitting parameter of the model (i.e.,  ) that will be discussed in subsequent sections. σ can be, therefore, interpreted as a fundamental conductivity parameter, directly associated with the number of accessible sites for doping or dedoping, for a particular polymer–electrolyte pair (somewhat related to C*, however with a first-principles definition).
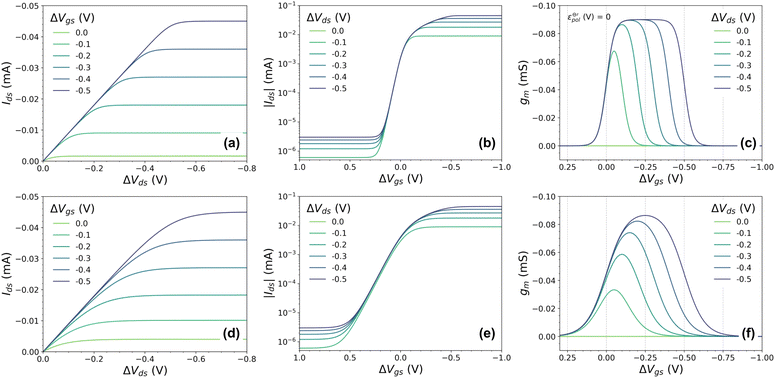
To validate the model, OECT curves were theoretically simulated using eqn (21) and standard OECT parameters (refer to the caption of Fig. 2 for the parameters used for such reconstruction). The simulated curves (Fig. 3(a) output, Fig. 3(b) transfer, and Fig. 3(c) transconductance) show a similar line shape as in real transistors. In the case of the output curves, for instance, they present an initial linear current increase, followed by a saturation regime. Thanks to the Nernstian Law, our model naturally transitions and reaches the saturation curve (unlike the B&M Model). However, the simulated curves in (Fig. 3(a)) appear to have an abrupt transition between the linear and saturation portions, unlike experimental curves. Normally, in real experimental curves, the transition is usually smoother and spreads over a wider range of drain potentials. The same is observed for the transfer and transconductance traces: although they resemble the transistor transfer and transconductance curves, their regime transitions are somewhat abrupt or peculiar. The transconductance “peak”, for instance, is nonrealistic, with its maximum being spread out through a large gate–voltage interval (Fig. 3(c)). In the following topic, we will address this peculiarity, extending and correcting our model to a non-ideal behavior (or non-Nernstian).
Non-Nernstian behavior
Experimental results seem to suggest that conjugated polymers do not behave ideally according to Nernst equation. Typically, an ideal reaction following Nernst equation will have a pre-logarithm factor RT/zF, where z is an integer, and represents the number of electrons involved in the electrochemical reaction.50,51 So far, we have used z = 1, since we have assumed a monoelectronic reaction. However, it has long been observed that the number of electrons exchanged during the redox reaction of semiconductor polymers can be fractional.56–58 This fractional ‘z’ has also been observed in electrochemical reactions involving aromatic molecules adsorbed on different electrochemically active electrodes.57,59Several hypotheses in regard to the physicochemical principles that lead to this non-ideality have been proposed. One of the first considered this fractional ‘z’ as a result of interactions between charges of neighboring polymeric chains.57,59–61 This phenomenon was also associated with mechanical stress caused by the insertion of ions and solvents into the polymeric film.58,62–64 It could lead to changes in the electrostatic interactions of the semiconductor polymer while it is oxidized or reduced.60 Moreover, changes in the polymer microstructure due to ionic uptake and polaron/bipolaron formations in distinct portions in a semicrystalline polymer have a strong effect on the doping processes and, therefore, could be associated with a non-Nerstian behavior in OMIEC.9,27,58,64
Thus, we have replaced the term z with a fractional one (γ), to reflect the non-ideality behavior in the model herein developed. Now, the non-ideal Nernst equation is described as follows (eqn (23)):
 | (23) |
 | (24) |
This non-ideality of the Nernst equation may originate from the change in the unity proportion of ions injected to charges created within the polymer channel. In the ideal case, for each injected ionic charge, an electronic charge is induced (or depleted) in (from) the polymer backbone, resulting in a 1![[thin space (1/6-em)]](https://www.rsc.org/images/entities/char_2009.gif) :
:![[thin space (1/6-em)]](https://www.rsc.org/images/entities/char_2009.gif) 1 ratio. This situation seems to be only possible when the ionic species is able to closely approach the conjugated backbone and solely induces a polaronic formation. However, due to the complex microstructure and morphology of conjugated polymers, ionic species hardly reach close contact with the polymer backbone as demonstrated in previous report.65 Flagg et al. (2023)65 studied the structure of a doped semicrystalline polymer OMIEC based on oligo(ethylene glycol). They find through grazing-incidence resonant X-ray diffraction (RXRD) analyses that the anions are positioned closer to the lamella mid-plane, and relatively distant from the polymer backbone. Instead, ions tend to disperse themselves into solvent-rich portions in the polymeric volume, generating a resulting electric field at the polymer backbone. Such an electric field, which is originated by the combination of several ionic charges, induces a polaronic formation, giving rise to a non- 1
1 ratio. This situation seems to be only possible when the ionic species is able to closely approach the conjugated backbone and solely induces a polaronic formation. However, due to the complex microstructure and morphology of conjugated polymers, ionic species hardly reach close contact with the polymer backbone as demonstrated in previous report.65 Flagg et al. (2023)65 studied the structure of a doped semicrystalline polymer OMIEC based on oligo(ethylene glycol). They find through grazing-incidence resonant X-ray diffraction (RXRD) analyses that the anions are positioned closer to the lamella mid-plane, and relatively distant from the polymer backbone. Instead, ions tend to disperse themselves into solvent-rich portions in the polymeric volume, generating a resulting electric field at the polymer backbone. Such an electric field, which is originated by the combination of several ionic charges, induces a polaronic formation, giving rise to a non- 1![[thin space (1/6-em)]](https://www.rsc.org/images/entities/char_2009.gif) :
:![[thin space (1/6-em)]](https://www.rsc.org/images/entities/char_2009.gif) 1 ion-to-electron transduction, which is accounted by the fractional γ factor.
1 ion-to-electron transduction, which is accounted by the fractional γ factor.
With all that said, the equation describing the drain current (Ids) for a non-Nernstian behavior and p-type material can then be rewritten as eqn (25):
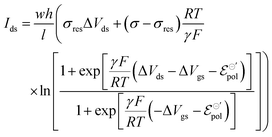 | (25) |
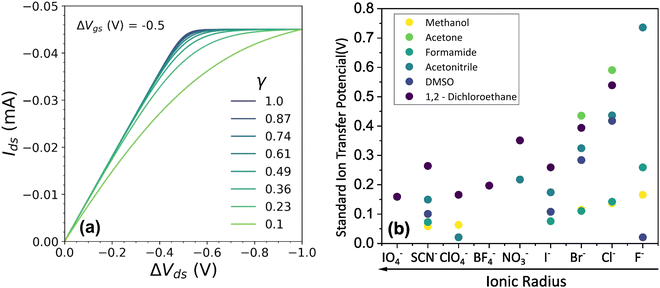 | ||
Fig. 4 (a) Effect of γ variation on output curve shape. Here were used the following parameters w = 1.5 mm, h = 100 nm, l = 250 um, σ = 1.5 S cm−1, σres = 1 × 10⁻⁴ S cm−1,  , T = 298.15 K, ΔVgs = −0.5 V. (b) Standard Ion Transfer Potential for anions from water to organic solvent from ref. 66–68 with adaptations. , T = 298.15 K, ΔVgs = −0.5 V. (b) Standard Ion Transfer Potential for anions from water to organic solvent from ref. 66–68 with adaptations. | ||
Our model not only provides fundamental principles to evaluate and characterize OECTs, but, also, offers a deeper insight into the nature of the electrochemical reaction. Indeed, the γ factor can now be explored in terms of the polymer microstructure characteristics and ionic swelling generating further knowledge on the ion-to-electron transduction in OECTs devices. Moreover, a higher γ results in more efficient OECT operation under the same conditions of  geometric parameters, and electronic mobility, as the saturation current occurs at lower drain voltages. That said, chemistries and materials scientists should look up for OECT materials with high ionic swelling and electrolytes (solvent + ionic salts) that are best compatible with the active layer, therefore enhancing the γ factor.
The standard electrode potential 
The  parameter, on its definition, represents the energy required for the species involved in the redox reaction to gain and/or lose electrons in their standard state. It determines how easy it would be to modulate the conductivity in the channel for a given polymer–electrolyte combination.24,52,63
In electrochemistry, it is well known that the energy associated with the ionic transfer process between different phases depends on the ionic radius and solvents involved.66Fig. 4(b) presents some of the standard ion transfer potentials from aqueous phase to organic solvents for commonly used anions.66–68 For the same anionic species, the standard ion transfer potential reduces according to the increase in solvent polarity. Although the standard ion transfer potential from the electrolyte to semiconductor polymer films has not yet been reported, a similar behavior can be expected during OECT operation. In this case, the polymeric material would behave as the organic phases in Fig. 4(b), imposing analogous effects to the transference of ions from electrolytes into the active material. Therefore, through a search of smaller  in case of a oxidation of p-type material, it is possible to offer a fundamental rationale for material design and processing towards low-voltage, high-transconductance OECT. For the reduction of an n-type material, were the cation plays the main role, a similar behaviour is expected.
A discussion on the impact of  γ, and σ on the device's transconductance can be found on the SI S6 (ESI†).
Model validation
A large amount of steady-state OECT data can be found in the literature. Here, we have chosen two seminal works to perform adjustments and to discuss and validate the model herein presented.(1) Paper by Flagg et al.:26 OECT performance × ionic size
The first selected article was the study conducted by Flagg et al. in 2018.26 The study examined the influence of various anionic species on the ionic–electronic transport in P3HT-based OECTs, a p-type material. The authors note that the correct choice of anion significantly impacts the ionic uptake by the channel and, therefore, the OECT characteristics. Notably, employing molecular anions like bis(trifluoromethanesulfonyl)imide (TSFI−) leads to higher channel currents compared to atomic anions like chloride (Cl−). Additionally, the type of anion influences the threshold voltage and the achieved doping levels during oxidation. The study also reveals that smaller anions exhibit a solvation shell of approximately ten water molecules, while larger anions can migrate into the film with minimal or no solvation at all. The authors propose that the observed behaviors come from variations in activation energy associated with the doping process, as indicated by the set of characterizations employed.
Thus, fittings from the experimental data available were made through eqn (25), since they have used P3HT as the active layer, which is a p-type material. The parameters of the device used were:26w = 19 mm, h = 140 nm, l = 20 μm and T = 298.15 K. Here, the parameter σres was assumed as 1 × 10⁻⁵ S cm−1, as expected for P3HT in undoped state.28,69 The adjustments can be found in Fig. 5(a) for the counterions: bis(trifluoromethanesulfonyl)imide (TSFI−), hexafluorophosphate (PF6−), perchlorate (ClO4−) and chloride (Cl−) at ΔVgs = −0.7 V. Eqn (25) was capable of fully describing the OECT behavior and predicting the linear and saturation regions for the analysed curves, by fittings with an R2 = 0.99 and p-values <0.05, for a 95% confidence interval. The values of σ, γ,  for the set of measurements can be found in Fig. 5(b)–(d), respectively, and its respective p-values in SI-S7 (ESI†).
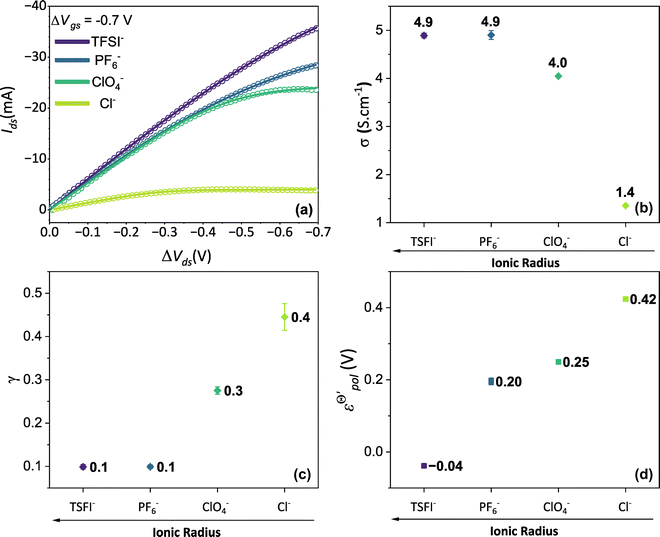 | ||
Fig. 5 (a) Output curves (hollow circles) from Flagg (2018), and fitting curves (solid lines) (b) σ, (c) γ and (d)  parameters. Reprinted (adapted) with permission from Flagg et al. (2018).26 Copyright © 2018, American Chemical Society. All data fittings with R2 = 0.99 and p-values < 0.05. parameters. Reprinted (adapted) with permission from Flagg et al. (2018).26 Copyright © 2018, American Chemical Society. All data fittings with R2 = 0.99 and p-values < 0.05. | ||
The fitting results indicate a relationship between the ionic radius and the fitting parameters.  and γ decays for species with larger radius, while the opposite behavior occurs for σ. Indeed, smaller
  and higher σ translate to optimize OECTs. In the present work, the smallest γ was obtained for the best operating OECT (the one interfaced by TFSI− electrolyte). Indeed, by analysing Fig. 5(c), γ decays with the ionic radii as expected, since the bigger the ionic species, the harder to produce a 1
![[thin space (1/6-em)]](https://www.rsc.org/images/entities/char_2009.gif) :
:![[thin space (1/6-em)]](https://www.rsc.org/images/entities/char_2009.gif) 1 ion-to-electron transduction. However, giving that
1 ion-to-electron transduction. However, giving that  is much smaller for the TFSI− case, it compensates for the smaller value of γ.
Conversely, the OECT operated with Cl− electrolyte exhibited the highest γ (0.4), and therefore tended to saturate at lower ΔVds than to larger anions. However, for the Cl− anion, σwas the lowest (1.4 S cm−1) among the tested electrolytes and  the highest. This indicates a limitation of the ionic specie to dope the polymer channel, in relation to molecular anions such as TFSI−, with σ = 4.9 S cm−1. The doping process was also influenced by
  which reduces considerably, from 0.42 V in Cl−, to −0.04 V in TSFI−. This means that under the conditions studied by Flagg et al. (2018),26 devices operated in TSFI− required way less energy to induce the transfer of the ion into the film and to promote the channel doping process, compared to anions with smaller ionic radii, such as Cl−. This observation aligns with the authors’ findings and discussions.
Finally, although it is yet premature to elaborate on any deeper relationships between γ,  , and σ, or to provide a stronger interpretation of the fitting parameters in relation to the physical chemistry of the ionic species and polymeric properties, our model clearly provides a powerful theoretical mean of exploring these parameters for a better understanding of the fundamentals in OMIEC-based devices.
(2) Paper by Rivnay et al.:47 Effect of microstructure on OECT device
Another parameter that has been the subject of studies is the effects of the microstructure and morphology of the mixed conductors on the performance of OECT. Rivnay and co-authors investigated the relationship of microstructure in PEDOT:PSS blends on its ionic–electronic transport, as well as its outcome on the performance of the OECTs.47 These effects were evaluated by adding an ethylene glycol(EG) as co-solvent, at concentrations of 0%, 5%, 20%, and 50%.
The authors observed that the increase in the cosolvent content resulted in a more pronounced phase separation between PEDOT:PSS and PSS-rich domains. This induced a greater PEDOT aggregation, slight densification of π-stacking in the PEDOT:PSS phase, and growth of the size domain, resulting in improved electronic mobility, deteriorating the ionic swelling. These morphological changes enhanced the conductivity of PEDOT:PSS films, from 6 S cm−1 in the pure film to 800 S cm−1 in the formulation with 5% EG. Concentrations above 10% did not show a significant increase in conductivity. On the other hand, at high concentrations of EG, a reduction in ionic mobility was noticed. These observations directly influenced the performance of the device, with the OECT built with the formulation of 5% co-solvent exhibiting the highest transconductance. In contrast, those at higher EG concentrations showed lower transconductance due to poor ionic mobility. This highlights the competition between phase separation and ionic and electronic mobility.
The fitting was made from the transfer curves of the experimental data available in ref. 47 by applying eqn (25). The geometric parameters used to perform the fitting were:47w = 50 μm, l = 50 μm and h = 390 nm, 174 nm, 208 nm and 184 nm for the concentrations of 0%, 5%, 20%, 50%, respectively, for ΔVds = −0.6 V, T = 298.15 K and σres = 1 × 10⁻³ S cm−1. These geometric parameters were obtained from the figure available in the ESI,† of the respective ref. 47. The curves and their respective adjustments can be found in Fig. 6, as well as the extracted σ, γ and  . There is a good agreement between the experimental curves and the theoretical fit (R2 = 0.99 and p-values <0.05, for a 95% confidence interval), with eqn (25) satisfactorily describing the transfer curves (Fig. 6(a)). The individual p-values are available in SI-S7 (ESI†). The values found for γ, reduced from 0.27 to 0.20 with the addition of EG. However, it did not show significant changes due to the rise in cosolvent concentration. On the other hand, the parameter
  and σ showed changes with the content of EG. The EG addition led to a reduction in
  , dropping from −0.03 V to −0.34 V, for 0% and 50% of EG, respectively. This indicates that during the PEDOT:PSS reduction process, the addition of EG makes it harder to de-dope the channel. This is consistent with the results found by the authors. They mentioned that despite the growth of the PEDOT:PSS phase, the whole process of OECT operation depends on the diffusion of ions in the channel. But, after passing through the PSS-rich regions, the process is limited by the rich domains of PEDOT:PSS where these ions do not have mobility to reach the PSS− molecules, and as a consequence, to dedope the channel.
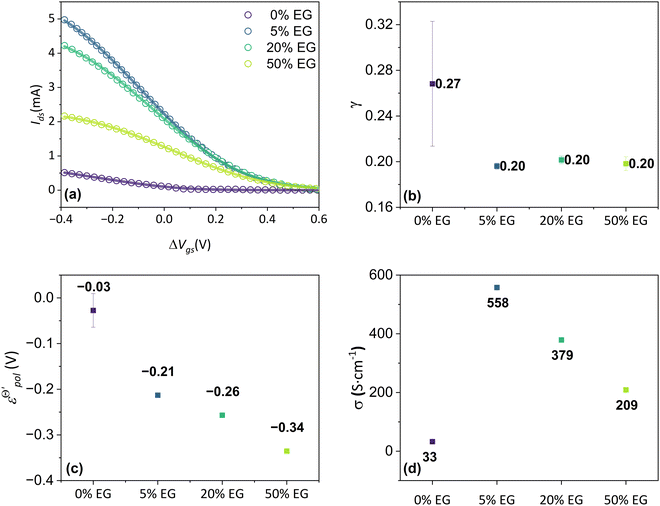 | ||
Fig. 6 (a) Transfer curves (hollow circles) from Rivnay (2016), and fitting curves (solid lines), (b) γ, (c)  and (d) σ parameters. Reprinted (adapted) with permission from Rivnay et al. (2016).47 For all adjustments R2 = 0.99 and p-values < 0.05. and (d) σ parameters. Reprinted (adapted) with permission from Rivnay et al. (2016).47 For all adjustments R2 = 0.99 and p-values < 0.05. | ||
The devices without EG addition presented a σ during the operation of 33 S cm−1. This was increased to 558 S cm−1 by the addition of 5% of EG. However for higher EG concentrations it dropped significantly. It is worth remembering that although different values of conductivity were found in the original manuscript, in the study by Rivnay and co-authors the conductivity measurements were made in a solid-state film, without electrolytes. These values could be changed during the device operation due to channel swelling. Using the presented model, the conductivity found reflects the actual conductivity during device operation.
Conclusions
In summary, we showed the development of an alternative model to OECT steady-state behavior, grounded on thermodynamics and electrochemistry. The model is capable to describing the linear and saturation regions of the curves. Through the model, it is possible to extracted three fitting parameters, σ, γ and . The channel conductivity (σ) plays the role of the figure of merit in contrast to μC*, while γ reflects the deviation from an ideal electrochemical reaction on the channel.
  the standard electrode potential brings information about the energy required to promote the oxidation and reduction of the channel, being correlated to the composition of electrolyte and semiconductor polymer on the OECT. The model was used to perform fittings from data from literature and demonstrated its capability to successfully explain the origin of observed phenomena. This makes the model a powerful tool assisting researchers in establishing guidelines for designing and optimizing OECTs in further applications.
Data availability
The data supporting this article have been included as part of the ESI.†Conflicts of interest
There are no conflicts to declare.Acknowledgements
This research was supported by the Brazilian Foundations, Fundação Coordenação de Aperfeiçoamento de Pessoal de Nível Superior (CAPES/PROEX) grant no. 88887.338197/2019-00, Fundação de Amparo à Pesquisa do Estado de São Paulo (FAPESP) grant no. 2022/02768-2, Instituto Nacional de Eletrônica Orgânica – INEO – (FATE MURI FA9550-15-1-0514), and University of São Paulo (USP).Notes and references
- B. D. Paulsen, K. Tybrandt, E. Stavrinidou and J. Rivnay, Nat. Mater., 2020, 19, 13–26 CrossRef CAS PubMed.
- S. Fabiano, L. Flagg, T. C. Hidalgo Castillo, S. Inal, L. G. Kaake, L. V. Kayser, S. T. Keene, S. Ludwigs, C. Muller, B. M. Savoie, B. Lüssem, J. L. Lutkenhaus, M. Matta, D. Meli, S. N. Patel, B. D. Paulsen, J. Rivnay and J. Surgailis, J. Mater. Chem. C, 2023, 11, 14527–14539 RSC.
- H. F. P. Barbosa, G. D. G. Higuita, F. Günther and G. C. Faria, Adv. Electron. Mater., 2022, 8, 2100864 CrossRef CAS.
- Y. van de Burgt, E. Lubberman, E. J. Fuller, S. T. Keene, G. C. Faria, S. Agarwal, M. J. Marinella, A. Alec Talin and A. Salleo, Nat. Mater., 2017, 16, 414–418 CrossRef CAS PubMed.
- J. Rivnay, R. M. Owens and G. G. Malliaras, Chem. Mater., 2014, 26, 679–685 CrossRef CAS.
- D. T. Duong, Y. Tuchman, P. Chakthranont, P. Cavassin, R. Colucci, T. F. Jaramillo, A. Salleo and G. C. Faria, Adv. Electron. Mater., 2018, 4, 1800090 CrossRef.
- A. Savva, S. Wustoni and S. Inal, J. Mater. Chem. C, 2018, 6, 12023–12030 RSC.
- A. Savva, R. Hallani, C. Cendra, J. Surgailis, T. C. Hidalgo, S. Wustoni, R. Sheelamanthula, X. Chen, M. Kirkus, A. Giovannitti, A. Salleo, I. McCulloch and S. Inal, Adv. Funct. Mater., 2020, 30, 1907657 CrossRef CAS.
- P. Cavassin, I. Holzer, D. Tsokkou, O. Bardagot, J. Réhault and N. Banerji, Adv. Mater., 2023, 35, 2300308 CrossRef CAS PubMed.
- B. D. Paulsen, R. Wu, C. J. Takacs, H.-G. Steinrück, J. Strzalka, Q. Zhang, M. F. Toney and J. Rivnay, Adv. Mater., 2020, 32(40), 2003404 CrossRef CAS PubMed.
- Y. Xuan, M. Sandberg, M. Berggren and X. Crispin, Org. Electron., 2012, 13, 632–637 CrossRef CAS.
- R. Colucci, B. A. Feitosa and G. C. Faria, Adv. Electron. Mater., 2024, 10(2), 2300235 CrossRef CAS.
- L. Q. Flagg, C. G. Bischak, J. W. Onorato, R. B. Rashid, C. K. Luscombe and D. S. Ginger, J. Am. Chem. Soc., 2019, 141, 4345–4354 CrossRef CAS PubMed.
- B. D. Paulsen, R. Wu, C. J. Takacs, H. G. Steinrück, J. Strzalka, Q. Zhang, M. F. Toney and J. Rivnay, Adv. Mater., 2020, 2003404, 1–7 Search PubMed.
- S. Himmelberger, D. T. Duong, J. E. Northrup, J. Rivnay, F. P. V. Koch, B. S. Beckingham, N. Stingelin, R. A. Segalman, S. C. B. Mannsfeld and A. Salleo, Adv. Funct. Mater., 2015, 25, 2616–2624 CrossRef CAS.
- H. Toss, C. Suspène, B. Piro, A. Yassar, X. Crispin, L. Kergoat, M.-C. Pham and M. Berggren, Org. Electron., 2014, 15, 2420–2427 CrossRef CAS.
- J. C. Scott and L. D. Bozano, Adv. Mater., 2007, 19, 1452–1463 CrossRef CAS.
- N. Koch, ChemPhysChem, 2007, 8, 1438–1455 CrossRef CAS PubMed.
- S. R. Forrest, Nature, 2004, 428, 911–918 CrossRef CAS PubMed.
- S. Inal, J. Rivnay, A.-O. Suiu, G. G. Malliaras and I. McCulloch, Acc. Chem. Res., 2018, 51, 1368–1376 CrossRef CAS PubMed.
- J. Rivnay, S. Inal, A. Salleo, R. M. Owens, M. Berggren and G. G. Malliaras, Nat. Rev. Mater., 2018, 3, 17086 CrossRef CAS.
- A. Nawaz, Q. Liu, W. L. Leong, K. E. Fairfull-Smith and P. Sonar, Adv. Mater., 2021, 33(49), 2101874 CrossRef CAS PubMed.
- H. Liu, J. Song, Z. Zhao, S. Zhao, Z. Tian and F. Yan, Organic Electrochemical Transistors for Biomarker Detections, Adv. Sci., 2024, 11(27), 2305347 CrossRef CAS PubMed.
- R. Colucci, H. F. de, P. Barbosa, F. Günther, P. Cavassin and G. C. Faria, Flexible Printed Electron., 2020, 5, 013001 CrossRef CAS.
- C. G. Bischak, L. Q. Flagg and D. S. Ginger, Adv. Mater., 2020, 2002610, 2002610 CrossRef PubMed.
- L. Q. Flagg, R. Giridharagopal, J. Guo and D. S. Ginger, Chem. Mater., 2018, 30, 5380–5389 CrossRef CAS.
- C. G. Bischak, L. Q. Flagg, K. Yan, T. Rehman, D. W. Davies, R. J. Quezada, J. W. Onorato, C. K. Luscombe, Y. Diao, C.-Z. Li and D. S. Ginger, J. Am. Chem. Soc., 2020, 142, 7434–7442 CrossRef CAS PubMed.
- D. J. Coutinho, B. de A. Feitosa, H. F. de P. Barbosa, R. Colucci, B. B. M. Torres and G. C. Faria, J. Phys. Chem. C, 2023, 127(50), 24011–24488 CrossRef.
- D. Khodagholy, T. Doublet, P. Quilichini, M. Gurfinkel, P. Leleux, A. Ghestem, E. Ismailova, T. Hervé, S. Sanaur, C. Bernard and G. G. Malliaras, Nat. Commun., 2013, 4, 1575 CrossRef PubMed.
- N. Coppedè, G. Tarabella, M. Villani, D. Calestani, S. Iannotta and A. Zappettini, J. Mater. Chem. B, 2014, 2, 5620–5626 RSC.
- D. A. Koutsouras, F. Torricelli and P. W. M. Blom, Adv. Electron. Mater., 2022, 9(2), 2200868 CrossRef.
- A. Giovannitti, C. B. Nielsen, D.-T. Sbircea, S. Inal, M. Donahue, M. R. Niazi, D. A. Hanifi, A. Amassian, G. G. Malliaras, J. Rivnay and I. McCulloch, Nat. Commun., 2016, 7, 13066 CrossRef CAS PubMed.
- A. Giovannitti, I. P. Maria, D. Hanifi, M. J. Donahue, D. Bryant, K. J. Barth, B. E. Makdah, A. Savva, D. Moia, M. Zetek, P. R. F. Barnes, O. G. Reid, S. Inal, G. Rumbles, G. G. Malliaras, J. Nelson, J. Rivnay and I. McCulloch, Chem. Mater., 2018, 30, 2945–2953 CrossRef CAS PubMed.
- A. Giovannitti, D.-T. Sbircea, S. Inal, C. B. Nielsen, E. Bandiello, D. A. Hanifi, M. Sessolo, G. G. Malliaras, I. McCulloch and J. Rivnay, Proc. Natl. Acad. Sci. U. S. A., 2016, 113, 12017–12022 CrossRef CAS PubMed.
- A. Savva, C. Cendra, A. Giugni, B. Torre, J. Surgailis, D. Ohayon, A. Giovannitti, I. McCulloch, E. Di Fabrizio, A. Salleo, J. Rivnay and S. Inal, Chem. Mater., 2019, 31, 927–937 CrossRef CAS.
- P. R. Paudel, J. Tropp, V. Kaphle, J. D. Azoulay and B. Lüssem, J. Mater. Chem. C, 2021, 9, 9761–9790 RSC.
- D. A. Bernards and G. G. Malliaras, Adv. Funct. Mater., 2007, 17, 3538–3544 CrossRef CAS.
- V. N. Prigodin, F. C. Hsu, J. H. Park, O. Waldmann and A. J. Epstein, Phys. Rev. B, 2008, 78, 035203 CrossRef.
- A. Shirinskaya, G. Horowitz, J. Rivnay, G. Malliaras and Y. Bonnassieux, Biosensors, 2018, 8, 103 CrossRef CAS PubMed.
- N. D. Robinson, P.-O. Svensson, D. Nilsson and M. Berggren, J. Electrochem. Soc., 2006, 153, H39 CrossRef CAS.
- V. Kaphle, P. R. Paudel, D. Dahal, R. K. Radha Krishnan and B. Lüssem, Nat. Commun., 2020, 11, 2515 CrossRef CAS PubMed.
- G. C. Faria, D. T. Duong and A. Salleo, Org. Electron., 2017, 45, 215–221 CrossRef CAS.
- N. Coppedè, M. Villani and F. Gentile, Sci. Rep., 2014, 4, 4297 CrossRef PubMed.
- M. Z. Szymanski, B. Luszczynska and D. Djurado, IEEE J. Sel. Top. Quantum Electron., 2013, 19, 1–7 Search PubMed.
- C. M. Proctor, J. Rivnay and G. G. Malliaras, J. Polym. Sci., Part B: Polym. Phys., 2016, 54, 1433–1436 CrossRef CAS.
- C. Matteo, A. Weissbach, L. M. Bongartz, R. Kantelberg, H. Tseng, H. Kleemann and K. Leo, Nat. Commun., 2022, 13, 4514 CrossRef PubMed.
- J. Rivnay, S. Inal, B. A. Collins, M. Sessolo, E. Stavrinidou, X. Strakosas, C. Tassone, D. M. Delongchamp and G. G. Malliaras, Nat. Commun., 2016, 7, 11287 CrossRef PubMed.
- S. Trasatti, Pure Appl. Chem., 1986, 58, 955–966 CrossRef CAS.
- I. Levine, Physical Chemistry, McGraw-Hill Education, 6th edn, 2009, vol. 1 Search PubMed.
- J. M. Pingarrón, J. Labuda, J. Barek, C. M. A. Brett, M. F. Camões, M. Fojta and D. B. Hibbert, Pure Appl. Chem., 2020, 92, 641–694 CrossRef.
- A. J. Bard and L. R. Faulkner, Electrochemical Methods:Fundamentals and applications, John Wiley & Sons, Inc, 2nd edn, 1944, vol. 2 Search PubMed.
- L. Contat-Rodrigo, C. Pérez-Fuster, J. V. Lidón-Roger, A. Bonfiglio and E. García-Breijo, Org. Electron., 2017, 45, 89–96 CrossRef CAS.
- M. Braendlein, A. Pappa, M. Ferro, A. Lopresti, C. Acquaviva, E. Mamessier, G. G. Malliaras and R. M. Owens, Adv. Mater., 2017, 29(13), 1605744 CrossRef PubMed.
- W. Shockley, Proc. IRE, 1952, 40, 1365–1376 Search PubMed.
- S. Inal, G. G. Malliaras and J. Rivnay, Nat. Commun., 2017, 8, 1767 CrossRef PubMed.
- D. D. Cunningham, A. Galal, C. V. Pham, E. T. Lewis, A. Burkhardt, L. Laguren-Davidson, A. Nkansah, O. Y. Ataman, H. Zimmer and H. B. Mark, J. Electrochem. Soc., 1988, 135, 2750–2754 CrossRef CAS.
- W. J. Albery, M. G. Boutelle, P. J. Colby and A. R. Hillman, J. Electroanal. Chem. Interfacial Electrochem., 1982, 133, 135–145 CrossRef CAS.
- P. Marque and J. Roncali, J. Phys. Chem., 1990, 94, 8614–8617 CrossRef CAS.
- A. P. Brown and F. C. Anson, Anal. Chem., 1977, 49, 1589–1595 CrossRef CAS.
- M. Nechtschein, F. Devreux, F. Genoud, E. Vieil, J. M. Pernaut and E. Genies, Synth. Met., 1986, 15, 59–78 CrossRef CAS.
- F. Devreux, Europhys. Lett., 1986, 1, 233 CrossRef CAS.
- T. F. Otero and F. Santos, Electrochim. Acta, 2008, 53, 3166–3174 CrossRef CAS.
- T. F. Otero and I. Boyano, J. Phys. Chem. B, 2003, 107, 6730–6738 CrossRef CAS.
- E. F. Bowden, M. F. Dautartas and J. F. Evans, J. Electroanal. Chem. Interfacial Electrochem., 1987, 219, 49–69 CrossRef CAS.
- L. Q. Flagg, J. W. Onorato, C. K. Luscombe, V. Bhat, C. Risko, B. Levy-Wendt, M. F. Toney, C. R. McNeill, G. Freychet, M. Zhernenkov, R. Li and L. J. Richter, Chem. Mater., 2023, 35, 3960–3967 CrossRef CAS.
- Y. Marcus, Pure Appl. Chem., 1983, 55, 977–1021 CrossRef CAS.
- Y. Marcus, M. J. Kamlet and R. W. Taft, J. Phys. Chem., 1988, 92, 3613–3622 CrossRef CAS.
- V. S. Markin and A. G. Volkov, Electrochim. Acta, 1989, 34, 93–107 CrossRef CAS.
- D. Neusser, C. Malacrida, M. Kern, Y. M. Gross, J. Van Slageren and S. Ludwigs, Chem. Mater., 2020, 32, 6003–6013 CrossRef CAS.
Footnote |
| † Electronic supplementary information (ESI) available. See DOI: https://doi.org/10.1039/d4mh00758a |
| This journal is © The Royal Society of Chemistry 2024 |

