 Open Access Article
Creative Commons Attribution 3.0 Unported Licence
A first principles study of RbSnCl3 perovskite toward NH3, SO2, and NO gas sensing
Mohammad Tanvir
Ahmed
 *a,
Debashis
Roy
 a,
Abdullah Al
Roman
a,
Shariful
Islam
b and
Farid
Ahmed
b
a,
Abdullah Al
Roman
a,
Shariful
Islam
b and
Farid
Ahmed
b
aDepartment of Physics, Jashore University of Science and Technology, Bangladesh. E-mail: tanvir.phy43@gmail.com
bDepartment of Physics, Jahangirnagar University, Bangladesh
First published on 5th February 2024
Abstract
The sensitivity of a RbSnCl3 perovskite 2D layer toward NH3, SO2, and NO toxic gases has been studied via DFT analysis. The tri-atomic layer of RbSnCl3 possessed a tetragonal symmetry with a band gap of 1.433 eV. The adsorption energies of RbSnCl3 for NH3, SO2 and NO are −0.09, −0.43, and −0.56 eV respectively with a recovery time ranging from 3.4 × 10⁻⁸ to 3.5 ms. RbSnCl3 is highly sensitive toward SO2 and NO compared to NH3. The adsorption of SO2 and NO results in a significant structural deformation and a semiconductor-to-metal transition of RbSnCl3 perovskite. A high absorption coefficient (>103 cm−1), excessive optical conductivity (>1014 s−1), and a very low reflectivity (<3%) make RbSnCl3 a potential candidate for numerous optoelectronic applications. A significant shift in optical responses is observed through SO2 and NO adsorption, which can enable identification of the adsorbed gases. The studied characteristics signify that RbSnCl3 can be a potential candidate for SO2 and NO detection.
1. Introduction
The rapid industrialization and growth of motorized traffic increase the emission of various toxic gases like NH3, SO2, NO, NO2, O3, CO, COCl2, etc. through numerous sources.1–4 Among various toxic gases, NH3, NO, and SO2 are quite soluble in water, and hence they can easily be absorbed into the body through the lungs or skin contact. Once in the body, they can dissolve in the bloodstream and cause harm to organs and tissues. They can also react with other environmental gases to form more harmful gases.5–7 NH3 is a highly toxic gas with a pungent smell that can be produced by agricultural activity as well as industrial wastes.1,8 SO2 gas is mainly generated by the burning of various fossil fuels, which is seriously injurious to health and the environment.2,8 NO is a highly hazardous gas which can cause even death by asphyxia.9 Hence, monitoring these gases is a vital task in order to provide a better living environment, which motivates researchers to create cutting-edge methods of sensing these substances.Since the historic discovery of graphene, scientists have become more interested in two-dimensional materials.10,11 Although graphene is a revolutionary discovery, pure graphene is not suitable for gas detection due to its poor sensitivity.2 Previous research revealed that NH3 is strongly adsorbed in defected BN NSs, Möbius BCN, graphdiyne NSs, C2N2 NSs, Pd-doped MoS2, CuO/WS2 heterostructures, noble metal doped MoSe2, etc.1,12–16 SO2 gas showed strong interactions with pristine boron nitride (BN) nanosheets (NSs), boron–carbon–nitride (BCN), BNN doped with Al, Si, Co and Mn, Ti-doped gallium nitride (GN) NSs, Al-doped MoS2, and so on.2,17–21 On the other hand, germanene NS, silicene NS, C-doped GN NS, aluminene NS, Au-doped MoS2, etc. 2D layers showed better sensitivity toward NO gas.22–26
Perovskites are multifunctional materials with great potential for numerous optoelectronic (OTE) applications.27 Various organic/inorganic perovskites have shown remarkable toxic gas-sensing properties both computationally and experimentally.28–36 Paper-based sensors of CH3NH3PbI3 (MAPI) perovskite showed a high sensitivity toward NH3 gas.28 NbWO6-based perovskite thin sheets showed strong interaction with H2S gas at low temperatures.29 ZnSnO3 perovskite nanospheres were demonstrated to be potential candidates for n-propanol sensors.30 Zhuang et al. fabricated a SCN-doped MAPI thin film, which showed remarkable sensitivity toward NO2 gas.31 Balamurugan and Lee synthesized YMnO3 nanopowder which demonstrated a fine sensing performance for H2S gas.32 Liu et al. studied the sensitivity of CsPbX3 (X = I, Br, and Cl) via density functional theory (DFT) calculation, which revealed strong adsorption of CH2O gas on CsPbBr3.33 Aranthady et al. reported that a La0.6Ca0.4FeO3 perovskite thin film showed enhanced sensitivity for SO2 gas detection.34 According to the experimental report of Marikutsa et al., BaSnO3 nanocrystals showed high sensitivity for SO2 gas.35 Formamidinium (FA) lead iodide-based sensors showed strong sensitivity and high selectivity for NH3 gas.36 RbSnCl3 perovskites are reported to be potential candidates for solar cells and thermoelectric and photocatalytic applications.37,38 The sensing performance of RbSnCl3 for various gases is yet to be studied.
Here we designed a 2D RbSnCl3 perovskite with three atomic layers and studied its structural, electronic and optical properties via DFT calculations. We also studied the adsorption phenomenon of NH3, SO2, and NO toxic gases on the RbSnCl3 layer. The sensitivity of the RbSnCl3 layer toward the selected gases is understood via the variation in distinct properties of the perovskite.
2 Computational details
In the current study, we have used the CASTEP code to find the global minimum structure and understand the sensing behavior implemented in “Materials Studio”. All of our calculations are performed based on density functional theory with the plane wave basis energy cut-off set to 650 eV. The global minimum structure used a 2 × 2 × 1 k-point mesh with the Perdew–Burke–Ernzerhof (PBE) formulation of the generalized gradient approximation (GGA) is used as the exchange–correlation functional,39 since GGA-PBE has provided satisfactory results in the study of adsorption and optoelectronic properties.40–42 We have set the convergence energy at 1.0 × 10⁻⁵ eV per atom for the geometry optimization, the ionic displacement at 0.001 Å, and the Gaussian smearing at 0.05 GPa for stress. The Hellmann–Feynman force for every atom has been set at a value of 0.03 eV Å−1. We have designed a triatomic layer of RbSnCl3 perovskite by building a 2 × 2 × 1 supercell. To avoid the interaction with surroundings we have used a vacuum slab of 35 Å. All complexes are optimized using the same optimization criteria.The adsorption energy (Ead) and recovery time (TR) of the complex structures are calculated from the following equations.
| Ead = EGas+RbSnCl3 − ERbSnCl3 − EGas, | (1) |
 | (2) |
3. Results and discussion
3.1. Geometry analysis
Fig. 1 shows the optimized geometries of the pristine RbSnCl3 layer along with their gas adsorbed complexes. The lattice parameters of the optimized structure are shown in Table 1. The RbSnCl3 layer possessed an orthorhombic phase with lattice parameters analogous to those in a previous study.43 A slight deformation of the structure is observed due to the adsorption of NH3 gas, which suggests a poor interaction of NH3 with the adsorbent layer. However, for SO2 and NO adsorption, a significant structural deformation is observed, signifying a strong adsorbate–adsorbent interaction. The volume of the RbSnCl3 unit cell increased due to the interaction with SO2 and NO gas, whereas in the presence of NH3, the volume is slightly decreased.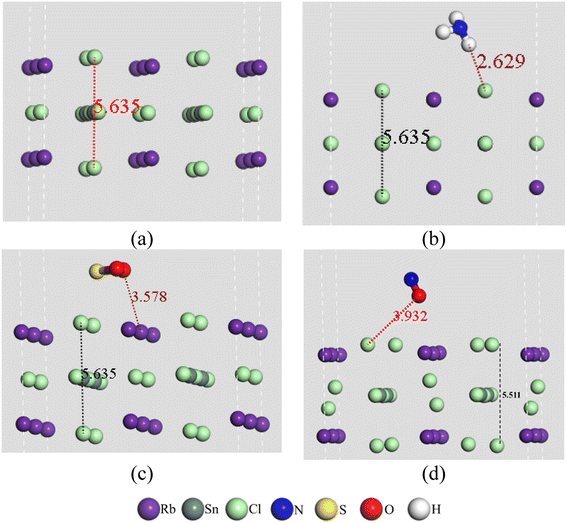 | ||
| Fig. 1 Geometry of (a) RbSnCl3, (b) RbSnCl3 + NH3, (c) RbSnCl3 + SO2, and (d) RbSnCl3 + NO structures. | ||
| Structures | a (Å) | b (Å) | c (Å) | α (degree) | β (degree) | γ (degree) | V (Å3) |
|---|---|---|---|---|---|---|---|
| RbSnCl3 | 5.490 | 5.490 | 5.635 | 90 | 90 | 90 | 169.84 |
| RbSnCl3 + NH3 | 5.490 | 5.489 | 5.635 | 90 | 90 | 90 | 169.81 |
| RbSnCl3 + SO2 | 5.540 | 5.490 | 5.635 | 85.9 | 89.9 | 89.9 | 171.39 |
| RbSnCl3 + NO | 5.590 | 5.540 | 5.511 | 90.9 | 90.6 | 89.9 | 170.67 |
The average bond lengths between atoms are shown in Table 2. The values in the parenthesis represent the bond lengths before adsorption. It is observed that the gas molecules suffer a slight deformation through the adsorption process. The average Sn–Cl bond length of the SnCl6 octahedra is about 2.77 Å, which agrees with a previous study.44 The average Sn–Cl bond lengths vary slightly due to the interaction of NH3 with RbSnCl3, whereas a significant structural deformation of the SnCl6 octahedra is a result of the interaction with SO2 and NO gas molecules.
| N–H | S![[double bond, length as m-dash]](https://www.rsc.org/images/entities/char_e001.gif) O O |
N![[double bond, length as m-dash]](https://www.rsc.org/images/entities/char_e001.gif) O O |
Sn–Cl | |
|---|---|---|---|---|
| NH3 | 1.030 (1.029) | |||
| SO2 | 1.459 (1.447) | |||
| NO | 1.193 (1.194) | |||
| RbSnCl3 + NH3 | 2.767 (2.770) | |||
| RbSnCl3 + SO2 | 2.791 | |||
| RbSnCl3 + NO | 2.812 |
3.2. Adsorption of NH3, SO2, and NO gases
The adsorption energy, recovery time, and adsorption length (Lad) are displayed in Table 3. The NH3 gas is very weakly adsorbed on the RbSnCl3 surface resulting in a very small recovery time of 3.4 × 10⁻⁸ ms, which is not suitable for practical applications at room temperature. SO2 gas is adsorbed significantly by the perovskite layer, whose recovery time makes RbSnCl3 suitable for SO2 sensing. Among the three selected gases, NO shows the strongest adsorption on the RbSnCl3 surface, with a recovery time of 3.5 ms. The strong interaction of NO and SO2 with adsorbent can result from the presence of high electronegative elements N, O and S, which can offer strong interaction via partial charge transfer between the adsorbent and adsorbate. Among them, NO possesses an unpaired electron in the π* antibonding orbital, which makes it more susceptible to bonding with the adsorbent surface, resulting in the strongest interaction. On the other hand, no unpaired electron is available in NH3. Though N is significantly electronegative, the presence of highly electropositive H atoms can generate an opposite force N atom on the adsorbent resulting in weakening of interaction strength.| Complexes | Adsorption energy (eV) | Adsorption length (Å) | Recovery time (ms) |
|---|---|---|---|
| RbSnCl3 + NH3 | −0.090 | 2.629 | 3.4 × 10⁻⁸ |
| RbSnCl3 + SO2 | −0.433 | 3.578 | 2.06 × 10⁻² |
| RbSnCl3 + NO | −0.564 | 3.932 | 3.5 |
RbSnCl3 perovskite showed comparatively poor sensitivity toward NH3 gas compared to BC3,45 graphene,46 phosphorene,47 silicene, BNNS,48 and MoSe2 (ref. 49) 2D layers. On the other hand, SO2 adsorption energy has a comparatively higher value than that of graphene,50 MoS2,51 MoSe2,52 and BNNSs.2 The NO adsorption on RbSnCl3 perovskite is comparatively stronger than on silicene,23 BN nanotubes,53 MoS2,26 and MoSe2.54
3.3. Electronic properties
The interactions between the atoms in pristine RbSnCl3 and gas-adsorbed RbSnCl3 can be well understood with the help of the electron density difference map and Mulliken (or Hirshfeld) population of the corresponding atoms. Tables 4 and 5 show the Mulliken and Hirshfeld charge distribution of the adsorbent and the complex structures, respectively. In Fig. 2 the red region indicates an electron-enriched region, while the green region shows an electron depletion region. The average Mulliken charge on each Rb, Sn and Cl is +0.87|e| +0.67|e| and −0.6|e| respectively. The A-site element, Rb, shows a partially positive charge due to high electropositivity, and hence Rb atoms act as electron donors. On the other hand, the Cl atoms of the SnCl6 octahedra show a partially negative charge due to Cl's higher electronegativity than Sn suggesting the displacement of bonding electrons of Sn–Cl bonds.55 The significant amount of the charge transfer indicates a strong covalent bonding between Sn and Cl atoms.56| Structures | Cl | Rb | Sn | N | O | S | H |
|---|---|---|---|---|---|---|---|
| RbSnCl3 | −0.600 | 0.870 | 0.670 | ||||
| RbSnCl3 + NH3 | −0.600 | 0.880 | 0.670 | −1.160 (−1.23) | 0.360 (0.41) | ||
| RbSnCl3 + SO2 | −0.606 | 0.853 | 0.745 | −0.800 (−0.80) | 1.500 (1.61) | ||
| RbSnCl3 + NO | −0.614 | 0.888 | 0.680 | 0.130 (0.14) | −0.120 (−0.14) |
| Structures | Cl | Rb | Sn | N | O | S | H |
|---|---|---|---|---|---|---|---|
| RbSnCl3 | −0.260 | 0.380 | 0.311 | ||||
| RbSnCl3 + NH3 | −0.258 | 0.372 | 0.305 | −0.290 (−0.29) | 0.080 (0.1) | ||
| RbSnCl3 + SO2 | −0.259 | 0.351 | 0.338 | −0.210 (−0.21) | 0.390 (0.41) | ||
| RbSnCl3 + NO | −0.263 | 0.35 | 0.345 | 0.031 (0.01) | −0.010 (−0.01) |
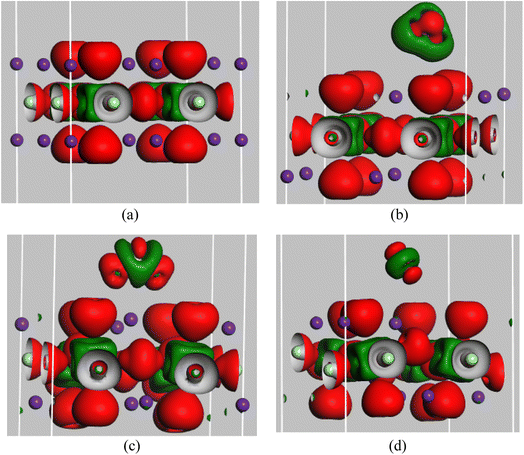 | ||
| Fig. 2 Electron density difference of (a) RbSnCl3, (b) RbSnCl3 + NH3, (c) RbSnCl3 + SO2, and (d) RbSnCl3 + NO structures with an isovalue of 0.02 e Å−3. | ||
After the adsorption of NH3, a very slight variation in charge distribution is observed due to the interaction with NH3. About −0.08|e| charge is transferred from the adsorbent to the NH3 molecule suggesting a weak interaction. The average charge on Rb, Sn, and Cl varies significantly due to SO2 and NO adsorption. About −0.1|e| Mulliken charge is transferred between the adsorbent and SO2/NO molecule. The extensive charge transfer between the absorbent and adsorbate through SO2 and NO adsorption results in a strong interaction. Hirshfeld charge analysis also verifies the charge transfer. Hence, the variation of Mulliken or Hirshfeld charge is commensurate with the adsorption energy of the three gas molecules under study.
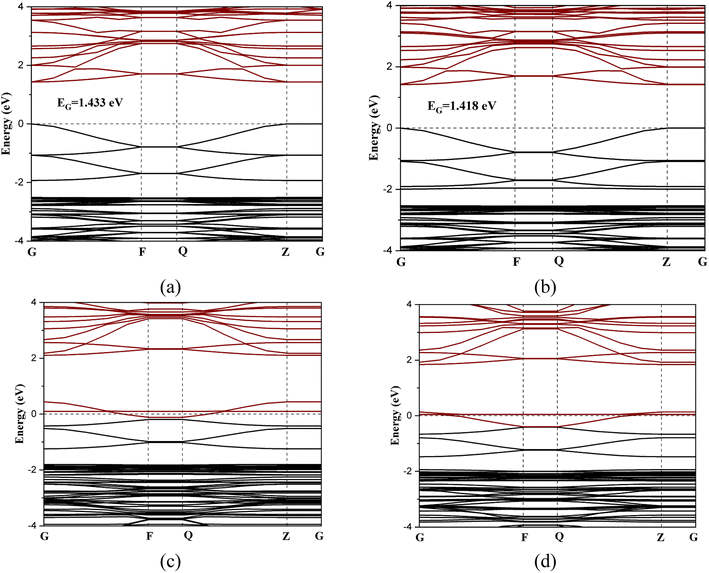
Fig. 3 shows the band structures of the perovskite layer and its gas-adsorbed complexes. The RbSnCl3 perovskite possesses a direct band gap of about 1.43 eV. Although a similar functional is used in the present study to that previously described, the obtained band gap is significantly higher.43 The increase of the band gap can be the result of the quantum confinement effect since in the present study a 2D layer of RbSnCl3 perovskite is designed. The band structures are determined along the G → F → Q → Z → G symmetry points of the Brillouin zone. The conduction band minimum (CM) and minimum of the valence band (VM) are located at the ‘Z’ k-point. The interaction with NH3 gas resulted in a slight charge transfer and slight structural deformation, which caused a decrease in the band gap to 1.418 eV. The slight change in the band gap may result in a nominal variation in electrical conductivity, which makes NH3 sensing quite harder in practical situations. On the other hand, due to a significant charge transfer and structural deformation, the conduction band of RbSnCl3 overlapped with the Fermi level resulting in a zero-band gap while adsorbing SO2 and NO gases. Hence, a semiconductor-to-metal transition occurred due to SO2 and NO adsorption on the RbSnCl3 layer, which can offer a significant change in conductivity resulting in a potential thin layer for SO2 and NO sensing. The electrical conductivity (σ) of a semiconducting adsorbent is related to the band gap as the following equation,
 | (3) |
Hence, the conductivity significantly increases after gas adsorption. The absolute measurements of conductivity can be calibrated in order to identify the type of the present toxic gases.
Fig. 4 shows the partial density of states (PDOS) of the RbSnCl3 layer and its gas-adsorbed complexes. In RbSnCl3, the electronic configuration of Sn and Cl is 5s25p2 and 3s23p5 respectively. Hence the contribution of the VM comes from the p-orbital Cl, and the Sn-p orbital contributes to the CM, which is analogous to a previous study.43 The A-site element Rb has no significant contribution to the VM or CM, and hence it does not directly affect the crystal band edge, which agrees with previous studies.57,58 No significant variation in electronic contribution to the VM and CM is observed due to NH3 adsorption, which is consistent with the nominal variation in the band gap. After SO2 adsorption, band overlapping was observed due to the contribution of p orbitals of S and O atoms near the Fermi level, which as a result reduced the band gap. A similar phenomenon is observed with NO adsorption. The p-orbitals of both N and O contribute significantly to the Fermi level resulting in a zero-band gap.
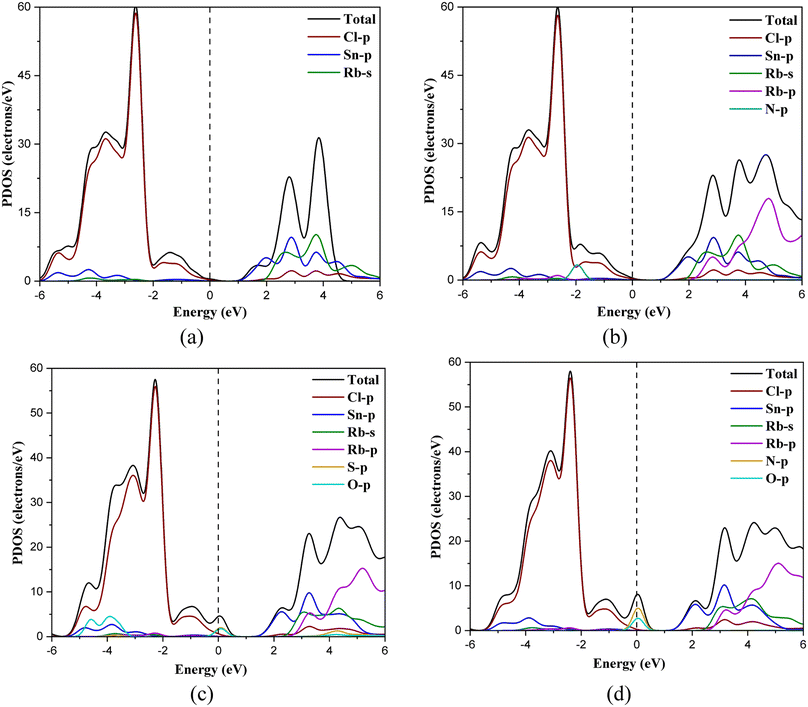 | ||
| Fig. 4 PDOS spectra of (a) RbSnCl3, (b) RbSnCl3 + NH3, (c) RbSnCl3 + SO2, and (d) RbSnCl3 + NO structures. | ||
3.4. Optical properties
The optical responses of the RbSnCl3 perovskite layer in the visible ranges satisfy previous findings.43 The RbSnCl3 perovskite shows an absorption coefficient (AC) over 103 cm−1 order (Fig. 5) in the visible region, which makes it a potential material for various optoelectronic applications. The high AC along with the band gap of 1.43 eV can provide better visible light absorption in solar cells. No significant variation in the AC is observed after NH3 adsorption. However, a significant red shift of the absorption peak is observed due to NO and SO2 adsorption, which suggests a strong optical response in gas sensing. The shift in the absorption peak can be used in determining the type of adsorbed gas.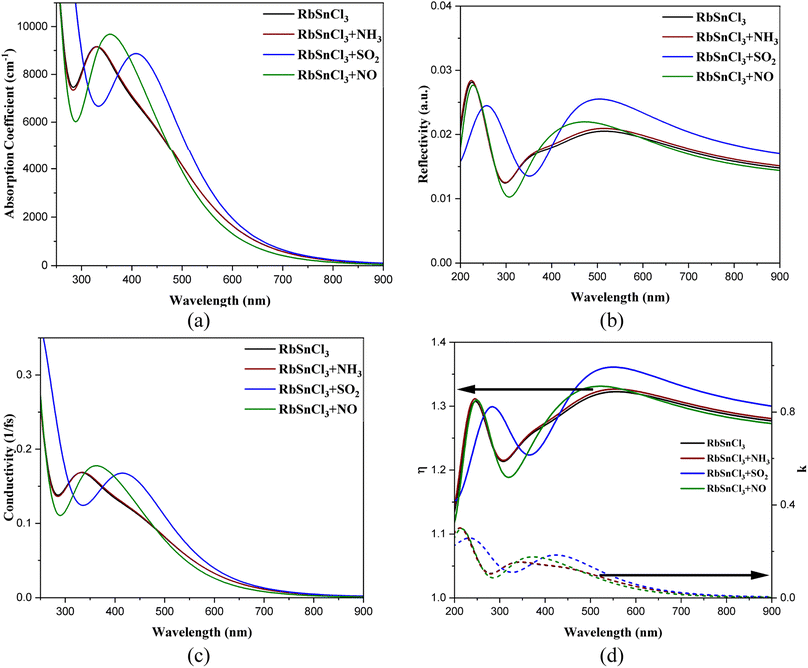 | ||
| Fig. 5 (a) Absorption coefficient, (b) reflectivity, (c) conductivity, and (d) refractive indices of the optimized geometries. | ||
An extensive redshift of the reflectivity peak is observed through NO adsorption, which suggests that there would be a change in the color of the RbSnCl3 material in the presence of NO gas. This idea can also be applied in sensing and detecting the nature of the toxic gas present in the environment. All the structures showed very poor reflectivity (<3%) in the visible region, suggesting a small portion of energy loss via reflection.
RbSnCl3 showed high optical conductivity (OC) in the lower wavelength region of the visible spectrum. The OC peak is observed in the near UV region of value over 1014 s. The high OC is preferable for various optoelectronic applications, i.e., photodiodes, detectors, etc. No observable variation in the OC occurred in the presence of NH3 gas; however, a redshift of the OC peak in the presence of NO and SO2 suggests a significant optical response in the visible wavelength. Conductivity gradually decreases with increasing wavelength.
The RbSnCl3 perovskite shows a low refractive index (η = 1.24–1.33) for visible wavelength. A low η is always preferable for optoelectronic research and the materials are suitable as antireflection coatings.59 A low η signifies a low energy loss via reflection. NH3 adsorption shows no significant variation in the refractive index; however, a drastic change is observed via SO2 and NO adsorption. The η increased up to 1.36 due to NO adsorption. The imaginary part of the refractive index (k) is also known as the extinction coefficient. A non-zero value of k signifies optical absorption, which increases with increasing the value of k. Hence, the k-spectra are analogous to the absorption spectra, where k is the maximum in the lower wavelength region of the visible spectrum. The value of k for RbSnCl3 perovskite at 400 nm is 0.14, which further increased to 0.170 and 0.176 after NO and SO2 adsorption, respectively. The peak of k red shifted due to NO and SO2 adsorption with an increase in its value suggesting an increase in absorption in the presence of NO and SO2 gases.
The significant variation in optical responses, i.e., shifting of absorption, reflection, and conductivity maxima, can be calibrated in order to identify the nature of adsorbed gases. Since both RbSnCl3 + SO2 and RbSnCl3 + NO are zero band gap complexes, the variation in optical characteristics (color) can be a way to distinguish between SO2 and NO adsorption.
4. Conclusion
A triatomic layer of RbSnCl3 perovskite is designed and optimized to ground state geometry successfully through DFT calculations. The toxic gases NH3, SO2, and NO are adsorbed on the RbSnCl3 layer with negative adsorption energies with a strong interaction between RbSnCl3–SO2 and RbSnCl3–NO. The RbSnCl3–SO2 and RbSnCl3–NO interactions result in comparatively more structural deformation of RbSnCl3 crystals than RbSnCl3–NH3 interaction. The charge transfer between adsorbent and adsorbate also verifies the strong interactions. The recovery times in the ms range also verify the applicability of the RbSnCl3 gas sensor in a practical environment. The band gap of the pure RbSnCl3 layer is about 1.43 eV which decreased to 1.412 in the presence of NH3; however, a complete semiconductor-to-metal transition is observed due to SO2 and NO adsorption. The RbSnCl3 layer showed a high AC, OC and very low reflectivity endowing it with potential for numerous optoelectronic research studies. A significant red shift in the AC and OC is observed due to SO2 and NO adsorption, which can be used to detect the type of adsorbed gas. The strong adsorption energies and variation in electronic and optical properties suggest that RbSnCl3 perovskite is a potential gas sensor for detecting as well as identifying NO and SO2 toxic gases.5 Future work
The synthesis and gas sensitivity of RbSnCl3 perovskite can be determined experimentally. The gas sensitivity of various perovskite structures can be studied both theoretically and experimentally. Various environmental factors, i.e., temperature, pressure, and presence of harmless environmental gases may affect the sensitivity of the gas sensor, which can be investigated in future studies.Conflicts of interest
There are no conflicts to declare.Acknowledgements
We are thankful to the Jashore University of Science and Technology Project Grant 2023-2024 (Grant No. 23-FoS-JC-06) for providing the necessary financial support for this research.References
- M. T. Ahmed, S. Islam and F. Ahmed, R. Soc. Open Sci., 2022, 9, 220778 CrossRef PubMed
.
- M. T. Ahmed, S. Hasan, S. Islam and F. Ahmed, Appl. Surf. Sci., 2023, 623, 157083 CrossRef
.
- A. Abooali and F. Safari, J. Comput. Electron., 2020, 19, 1373 CrossRef
.
- H. Luo, K. Xu, Z. Gong, N. Li, K. Zhang and W. Wu, Appl. Surf. Sci., 2021, 566, 150390 CrossRef
.
- C. H. Wu, E. D. Morris and H. Niki, J. Phys. Chem., 1973, 77, 2507 CrossRef
.
- W. B. Faulkner and B. W. Shaw, Atmos. Environ., 2008, 42, 6567 CrossRef
.
- G. R. Carmichael, D. G. Streets, G. Calori, M. Amann, M. Z. Jacobson, J. Hansen and H. Ueda, Environ. Sci. Technol., 2002, 36, 4707 CrossRef PubMed
.
- M. A. Khan, F. Qazi, Z. Hussain, M. U. Idrees, S. Soomro and S. Soomro, Int. J. Electrochem. Sci., 2017, 12, 1711 CrossRef CAS
.
- Z. Gao, Y. Sun, M. Li, W. Yang and X. Ding, Appl. Surf. Sci., 2018, 456, 351 CrossRef CAS
.
- Z. Li, N. Wang, Z. Lin, J. Wang, W. Liu, K. Sun, Y. Q. Fu and Z. Wang, Appl. Mater., 2016, 8, 20962 CrossRef CAS PubMed
.
- H. Nazemi, A. Joseph, J. Park and A. Emadi, Sensors, 2019, 19, 1285 CrossRef CAS PubMed
.
- H. Li, Z. Chen, X. Fang and D. Tie, Superlattices Microstruct., 2015, 88, 371 CrossRef CAS
.
- V. Nagarajan and R. Chandiramouli, J. Mol. Liq., 2018, 249, 24 CrossRef CAS
.
- C. He, M. Zhang, T. T. Li and W. X. Zhang, Appl. Surf. Sci., 2020, 505, 144619 CrossRef CAS
.
- H. Luo, J. Shi, C. Liu, X. Chen, W. Lv, Y. Zhou, M. Zeng, J. Yang, H. Wei, Z. Zhou, Y. Su, N. Hu and Z. Yang, Nanotechnology, 2021, 32, 445502 CrossRef CAS PubMed
.
- A. I. Ayesh, Physica E Low Dimens. Syst. Nanostruct., 2022, 139, 115188 CrossRef CAS
.
- R. Khatun, M. T. Ahmed, S. Islam, M. K. Hossain, M. A. Hossain and F. Ahmed, Int. J. Comput. Mater. Sci. Surf. Eng., 2021, 10, 184 Search PubMed
.
- F. Behmagham, E. Vessally, B. Massoumi, A. Hosseinian and L. Edjlali, Superlattices Microstruct., 2016, 100, 350 CrossRef CAS
.
- H. Roohi and N. A. Ardehjani, RSC Adv., 2020, 10, 27805 RSC
.
- R. Zhang, D. Fu, J. Ni, C. Sun and S. Song, Chem. Phys. Lett., 2019, 715, 273 CrossRef CAS
.
- M. A. H. Khan, M. V. Rao and Q. Li, Sensors, 2019, 19, 905 CrossRef PubMed
.
- V. Nagarajan and R. Chandiramouli, J. Mol. Liq., 2017, 234, 355 CrossRef CAS
.
- R. Chandiramouli, A. Srivastava and V. Nagarajan, Appl. Surf. Sci., 2015, 351, 662 CrossRef CAS
.
- H. Roohi and N. A. Ardehjani, Surf. Sci., 2022, 717, 121988 CrossRef CAS
.
- V. Nagarajan and R. Chandiramouli, Mater. Sci. Eng. B, 2018, 229, 193 CrossRef CAS
.
- E. Salih and A. I. Ayesh, Physica E Low Dimens. Syst. Nanostruct., 2021, 131, 114736 CrossRef CAS
.
- H. J. Snaith, Nat. Mater., 2018, 17, 372 CrossRef CAS PubMed
.
- A. Maity, A. K. Raychaudhuri and B. Ghosh, Sci. Rep., 2019, 9, 1 CrossRef CAS PubMed
.
- J. Wang, Y. Ren, H. Liu, Z. Li, X. Liu, Y. Deng and X. Fang, Adv. Mater., 2022, 34, 2104958 CrossRef CAS PubMed
.
- Y. Yin, Y. Shen, P. Zhou, R. Lu, A. Li, S. Zhao, W. Liu, D. Wei and K. Wei, Appl. Surf. Sci., 2020, 509, 145335 CrossRef CAS
.
- Y. Zhuang, W. Yuan, L. Qian, S. Chen and G. Shi, Phys. Chem. Chem. Phys., 2017, 19, 12876 RSC
.
- C. Balamurugan and D. W. Lee, Sensor. Actuator. B Chem., 2015, 221, 857 CrossRef CAS
.
- X. Liu, J. Qiu, Q. Huang, X. Chen, J. Yu and J. Bao, Phys. Chem. Chem. Phys., 2023, 25, 11620 RSC
.
- C. Aranthady, T. Jangid, K. Gupta, A. K. Mishra, S. D. Kaushik, V. Siruguri, G. M. Rao, G. V. Shanbhag and N. G. Sundaram, Sensor. Actuator. B Chem., 2021, 329, 129211 CrossRef CAS
.
- A. Marikutsa, M. Rumyantseva, A. Baranchikov and A. Gaskov, Mater, 2015, 8, 6437–6454 CrossRef CAS PubMed
.
- A. A. Parfenov, O. R. Yamilova, L. G. Gutsev, D. K. Sagdullina, A. V. Novikov, B. R. Ramachandran, K. J. Stevenson, S. M. Aldoshin and P. A. Troshin, J. Mater. Chem. C, 2021, 9, 2561 RSC
.
- Y. Li, X. Gong, P. Zhang and X. Shao, Chem. Phys. Lett., 2019, 716, 76 CrossRef CAS
.
- P. Kumari, R. Sharma, U. Lilhore, R. Khenata and V. Srivastava, Int. J. Energy Res., 2022, 46, 23893 CrossRef CAS
.
- W. Kohn and L. J. Sham, Phys. Rev., 1965, 140, A1133 CrossRef
.
- W. Zhu, Z. Wu, G. S. Foo, X. Gao, M. Zhou, B. Liu, G. M. Veith, P. Wu, K. L. Browning, H. N. Lee, H. Li, S. Dai and H. Zhu, Nat. Commun., 2017, 8, 1 CrossRef PubMed
.
- A. A. Piya, S. U. D. Shamim, M. N. Uddin, K. N. Munny, A. Alam, M. K. Hossain and F. Ahmed, Comput. Theor. Chem., 2021, 1200, 113241 CrossRef CAS
.
- S. Idrissi, H. Labrim, L. Bahmad and A. Benyoussef, Chem. Phys. Lett., 2021, 766, 138347 CrossRef CAS
.
- M. H. Rahman, M. Jubair, M. Z. Rahaman, M. S. Ahasan, K. (Ken) Ostrikov and M. Roknuzzaman, RSC Adv., 2022, 12, 7497 RSC
.
- S. Zhou, X. Kuang, F. Kuang, J. Qiu, M. Yu, J. Chen, J. Ma, Y. Li, F. Tang and A. Mao, J. Phys. Chem. C, 2023, 127, 13346 CrossRef CAS
.
- S. Mehdi Aghaei, M. M. Monshi, I. Torres, S. M. J. Zeidi and I. Calizo, Appl. Surf. Sci., 2018, 427, 326 CrossRef CAS
.
- V. E. Comparán Padilla, M. T. Romero de la Cruz, Y. E. Ávila Alvarado, R. García Díaz, C. E. Rodríguez García and G. Hernández Cocoletzi, J. Mol. Model., 2019, 25, 1 CrossRef PubMed
.
- S. Lei, R. Gao, X. Sun, S. Guo, H. Yu, N. Wan, F. Xu and J. Chen, Sci. Rep., 2019, 9, 1 CrossRef CAS PubMed
.
- A. Srivastava, C. Bhat, S. K. Jain, P. K. Mishra and R. Brajpuriya, J. Mol. Model., 2015, 21, 1 CrossRef PubMed
.
- A. I. Ayesh, Phys. Lett. A, 2022, 441, 128163 CrossRef CAS
.
- A. S. Rad, M. Esfahanian, S. Maleki and G. Gharati, J. Sulphur Chem., 2016, 37, 176 CrossRef
.
- A. Abbasi and J. J. Sardroodi, Appl. Surf. Sci., 2019, 469, 781 CrossRef CAS
.
- A. I. Ayesh, Phys. Lett. A, 2022, 422, 127798 CrossRef CAS
.
- A. A. El-Barbary, K. M. Eid, M. A. Kamel, H. O. Taha and G. H. Ismail, J. Surf. Eng. Mater. Adv. Technol., 2015, 05, 154 Search PubMed
.
- M. Sharma, P. Jamdagni, A. Kumar and P. K. Ahluwalia, AIP Conf. Proc., 2016, 1731, DOI:10.1063/1.4948211/884699
.
- R. A. Evarestov, E. A. Kotomin, A. Senocrate, R. K. Kremer and J. Maier, Phys. Chem. Chem. Phys., 2020, 22, 3914 RSC
.
- S. Das, S. U. D. Shamim, M. K. Hossain, F. Ahmed, M. A. Hossain and M. O. Rahman, Appl. Surf. Sci., 2022, 600, 154173 CrossRef CAS
.
- M. T. Ahmed, S. Islam and F. Ahmed, Heliyon, 2023, 9, e17779 CrossRef CAS PubMed
.
- E. Mosconi, A. Amat, M. K. Nazeeruddin, M. Grätzel and F. De Angelis, J. Phys. Chem. C, 2013, 117, 13902 CrossRef CAS
.
- M. T. Ahmed, S. Islam, M. S. Bashar, M. A. Hossain and F. Ahmed, Adv. Mater. Sci. Eng., 2022, 2022, 7606339 Search PubMed
.
| This journal is © The Royal Society of Chemistry 2024 |

