
 Open Access Article
 This Open Access Article is licensed under a Creative Commons Attribution-Non Commercial 3.0 Unported Licence
An ultrasensitive label-free RNase H assay based on in vitro transcription of fluorogenic light-up aptamer†
Jinhwan
Lee
,
Hansol
Kim
,
Yan
Li
,
Seoyoung
Lee
and
Hyun Gyu
Park
 *
*
Department of Chemical and Biomolecular Engineering (BK21 Four), Korea Advanced Institute of Science and Technology (KAIST), 291 Daehak-ro, Yuseong-gu, Daejeon 34141, Republic of Korea. E-mail: hgpark@kaist.ac.kr; Fax: +82-42-350-3910; Tel: +82-42-350-3932
First published on 7th March 2024
Abstract
Herein, we proposed a label-free method to identify RNase H activity by utilizing in vitro transcription of fluorogenic light-up aptamers. In this work, we employed the specially designed two pivotal components of the hairpin substrate probe (HP) containing an RNA/DNA chimeric stem region and the template probe (TP) as a transcription template, and the RNase H activity was made to lead to the formation of a complete ds T7 promoter. T7 RNA polymerase could then promote in vitro transcription to generate numerous light-up RNA aptamers that result in significant fluorescence enhancements upon binding to the cognate fluorogenic dye. By leveraging this deliberate design principle, we identified RNase H activity ultrasensitively as low as 0.000156 U mL−1 with excellent specificity against non-target enzymes. We further demonstrated that the strategy can also reliably identify RNase H activity in heterogeneous biological samples such as cell lysates, ensuring its robust practical applicability. This work would provide invaluable insight for the development of innovative biosensing systems utilizing in vitro transcription of light-up aptamers, and it could be broadened to construct other assays by appropriately redesigning the HPs.
Introduction
An endonuclease termed Ribonuclease H can degrade RNA strands in RNA/DNA hybrids by cleaving phosphodiester linkages between ribonucleotides through an endonucleolytic mechanism.1–3 The enzyme is found in a wide variety of organisms, from bacteria and archaea to higher eukaryotes, including humans. RNase H activity is known to play pivotal roles in many vital biological processes like DNA replication, RNA transcription, and DNA repair.4,5Furthermore, RNase H is vital in the lifecycle of reverse-transcribing viruses, including human immunodeficiency virus (HIV), Moloney murine leukemia virus (MoMLV), and hepatitis B virus (HBV). These viruses depend on the intrinsic RNase H activity of the reverse transcriptase (RT) for efficient conversion of their RNA genomes into DNA to incorporate them into the host genome.3,6 Despite current treatments that primarily focus on inhibiting the protease, integrase, and DNA polymerase activities of RT, the emergence of drug-resistant viral variants underscores the need for novel antiviral strategies targeting RNase H.3,7,8 Therefore, RNase H activity has become an important target in antiviral research, and developing efficient techniques for measuring RNase H activity is crucial to screen potential drugs that can inhibit RNase H.
Various strategies have been established to identify RNase H activity, such as high-performance liquid chromatography (HPLC),9 gel electrophoresis,10 and capillary electrophoresis.11 Despite adequate applications of these methods in the RNase H assay, they have several drawbacks, such as labor-intensiveness, insufficient sensitivity, and/or a relatively long assay time, severely limiting their prevalent applications. As a compelling alternative to transcend these drawbacks, some fluorometric methods have been recently proposed by utilizing molecular beacons, DNAzymes, and DNA intercalating dyes.4,12–18 These methods, however, mostly require time-consuming and costly modifications of fluorophore and quencher on substrate probes, which might interfere with the intrinsic RNase H activity due to the steric hindrance caused by the modifications,16,17 which might diminish the assay reliability. Thus, there is a strong incentive for further advancements in the RNase H assay.
Aptamers are single-stranded oligonucleotide sequences that can selectively bind to target molecules19 and numerous biosensors based on aptamers have been extensively developed to identify proteins, small molecules, and even whole cells.20–22 Beyond the target recognitions, various light-up RNA aptamers have been developed as a compelling signaling element capable of creating greatly enhanced fluorescence signals upon binding to their respective fluorophores.23,24 Due to several crucial merits including fast fluorescence activation, high photobleaching resistance,25 and high quantum yield,26 the light-up RNA aptamers have been intensively utilized as a signaling module to construct novel fluorogenic biosensors, where the aptamers are normally produced through in vitro transcription.25–30
Based on this background, we herein proposed a new label-free and ultrasensitive strategy to identify RNase H activity by employing Broccoli light-up RNA aptamer. We ingeniously designed the hairpin-shaped RNA/DNA substrate probe (HP) and the template probe (TP) such that the activity of RNase H would initiate the in vitro transcription to produce the RNA aptamers that generate the final fluorescence signal to identify the activity of RNase H. Notably, by incorporating the T7 promoter sequence into the stem region of the HP, we have successfully developed a detecting system where the double-strand T7 promoter is directly produced by the target, without the need for additional reaction steps by using DNA polymerase for the generation of double-strand T7 promoter.26,31,32 Taking advantage of this novel design principle, we were able to identify RNase H activity with excellent sensitivity, specificity, and practical utility.
Materials and methods
Materials
Bioneer Co. (Daejeon, South Korea) synthesized and purified the oligonucleotides (Table S1†) used in this work via polyacrylamide gel electrophoresis (PAGE), except for the hairpin substrate probe (HP), which underwent purification by HPLC. DNase I, Escherichia coli (E. coli) RNase H, ribonucleoside triphosphate (rNTP) set, exonuclease I (Exo I), exonuclease III (Exo III), and T7 RNA polymerase were obtained from Enzynomics (Daejeon, South Korea). Lambda exonuclease (λ Exo), Eco RI, and Uracil DNA glycosylase (UDG) were supplied by New England Biolabs Inc. (Beverly, MA, USA). DFHBI and DFHBI-1T were acquired from Sigma-Aldrich (St. Louis, MO, USA). Ultrapure DNase/RNase-free distilled water was supplied by Bioneer Co. and used for all assays. Other reagents used in this work were of analytical grade and used without any additional purification.Procedure for RNase H activity assay
The reaction solution (10 μL) was prepared by mixing 1 μL of 10× T7 RNA polymerase buffer (100 mM DTT, 20 mM spermidine, 100 mM MgCl2, 400 mM Tris–HCl (pH 7.9)), 0.6 μL of HP (5 μM), 5.4 μL of DW, and 3 μL of an RNase H analyte solution at varying concentrations. After 30 minutes of incubation at 37 °C, the solution was heated to 65 °C for 20 min to ensure that RNase H activity does not affect subsequent transcription reaction. Next, the transcription solution composed of 6.7 μL of DW, 4 μL of rNTP mix (25 mM), 2 μL of T7 RNA polymerase buffer (10×), 6 μL of DFHBI (500 μM), 1 μL of T7 RNA polymerase (50 U μL−1), and 0.3 μL of template probe (TP) (5 μM) was introduced into the reaction solution and then kept at 37 °C for 45 min. The Tecan Infinite M200 Pro microplate reader (Männedorf, Switzerland) was used to monitor the fluorescence intensity emitted from the reaction solution in 384-well Greiner Bio-One microplates (ref. 781077, Courtaboeuf, France). After the reaction, the sample was excited at 460 nm and scanned between 490 nm and 590 nm.Gel electrophoresis analysis
The reaction solutions were injected into a 6× loading buffer, and the mixture was resolved on a 15% polyacrylamide gel using a 1× TBE buffer as a running buffer. Electrophoresis was conducted at a constant voltage of 130 V for 100 min. After electrophoresis, the gel was stained with SYBR Gold for 15 min and subsequently captured using a ChemiDoc™ Imaging System (Bio-Rad, Hercules, CA, USA). For the DFHBI staining test, the gel was stained in a DFHBI staining solution (10 μM DFHBI, 1 mM MgCl2, 100 mM KCl, 40 mM HEPES (pH 7.4)) for 15 min.33Biological sample test
The A549 and HT-29 tumor cell lines were supplied by the Korean Cell Line Bank (Seoul, South Korea) and cultured in Dulbecco's Modified Eagle's Medium (DMEM) (Welgene, Gyeongsan, South Korea) supplemented by 10% fetal bovine serum (FBS) (RMBIO®, Missoula, MT, USA) in a humidified atmosphere with 5% CO2 at 37 °C. The cells were harvested during the exponential growth phase and diluted to make a 5 × 10⁶ cells mL−1 solution. From the cell lysates, proteins were extracted based on the PRO-PREP™ protein extraction solution kit (Intron Biotechnology, Seongnam, South Korea), and the protein concentrations were calculated based on the Pierce™ bicinchoninic acid (BCA) protein assay (Thermo Fisher Scientific, Waltham, MA, USA). Finally, RNase H activities included in 0.5 μg of each cell lysate were determined following the procedure shown in section ‘Procedure for RNase H activity assay’.Results and discussion
Basic working concept
As presented in Fig. 1, the proposed RNase H assay based on in vitro transcription of light-up aptamer (ITA) utilizes two crucial components, the hairpin substrate probe (HP) and the template probe (TP). The HP is designed to include a chimeric RNA/DNA stem region with a T7 promoter sequence, which acts as a substrate for RNase H, while the TP consists of the same RNA stem sequence at the 3′ end extended by an antisense of light-up aptamer at the 5′ end. In principle, RNase H in a sample degrades the RNA region of the chimeric stem, leading to the disruption of the hairpin structure. TP is then able to hybridize with the linearized HP, forming the complete ds T7 promoter along the 3′ end of the HP, where T7 RNA polymerase readily promotes in vitro transcription. As a consequence, a large number of light-up RNA aptamers are produced and generate highly enhanced fluorescence signals upon binding to the cognate fluorogens, which could be used to identify the activity of RNase H. If the RNase H is absent, on the other hand, the HP remains intact, and subsequent reactions responsible for the final fluorescence signal would not occur. | ||
| Fig. 1 Schematic representation to identify RNase H activity based on the in vitro transcription of fluorogenic light-up aptamers. | ||
Feasibility test
To assess the feasibility of the designed method, we performed ITA reactions under various reaction conditions and monitored the fluorescence emission spectra produced by the cognate fluorogen. In this work, we particularly employed Broccoli light-up aptamer and its pair fluorogenic dye, 3,5-difluoro-4-hydroxybenzylidene imidazolinone (DFHBI) due to its various appealing advantages including high transcription efficiency by T7 RNA polymerase.27 As presented in Fig. 2(a), only the positive sample that contained HP, TP, DFHBI, T7 RNA polymerase, and RNase H exhibited marked fluorescence enhancement. However, the samples lacking any of the reaction elements did not exhibit any significant increase in fluorescence. Without RNase H, only a slight fluorescence signal was observed, which could be attributed to the transient opening of HP due to the breathing effect of the stem region. Nevertheless, the signal obtained in the presence of RNase H was significantly higher and could be clearly distinguished from the nonspecific signal. | ||
| Fig. 2 Feasibility of the designed approach. (a) Fluorescence emission spectra from DFHBI after the in vitro transcription of Broccoli RNA aptamers. a: TP + DFHBI + T7 RNA polymerase, b: HP + TP + T7 RNA polymerase, c: HP + DFHBI + T7 RNA polymerase, d: HP + TP + DFHBI, e: HP + TP + DFHBI + T7 RNA polymerase, f: HP + TP + DFHBI + T7 RNA polymerase + RNase H, g: DNA HP + TP + DFHBI + T7 RNA polymerase, h: DNA HP + TP + DFHBI + T7 RNA polymerase + RNase H. (b) PAGE image of the reaction products after SYBR Gold staining. M: DNA ladder, M1: HP, M2: TP, 1: HP + RNase H, 2: HP + TP, 3: HP + TP + RNase H. (c) PAGE image of the reaction products after DFHBI gel staining. 1: without RNase H, 2–6: with RNase H at varying concentrations (0.01 U mL−1, 0.03 U mL−1, 0.05 U mL−1, 0.1 U mL−1, and 1 U mL−1, respectively.). The final concentrations of HP, TP, rNTP mix, DFHBI, T7 RNA polymerase, RNase H, and DNA HP were 200 nM, 200 nM, 3.3 mM, 100 μM, 1.67 U μL−1, 1 U mL−1, and 200 nM, respectively. | ||
To further verify that the fluorescence signal is produced exclusively by RNase H catalytic activity, we repeated the same reaction for the positive sample, but this time we employed the HP with its RNA stem strand replaced by the same DNA sequences (DNA HP), which would not be degraded by RNase H activity. As anticipated, the HP consisting of only DNA nucleotides did not lead to any distinct fluorescence signals even upon addition of RNase H. These findings verify that the RNase H activity initiates the cascade reaction by degrading the RNA stem strand of the HP, ultimately resulting in a strong fluorescence signal by producing the Broccoli light-up aptamers.
To further confirm the feasibility, we performed polyacrylamide gel electrophoresis (PAGE) analysis to examine if the intermediate products were properly produced during the designed reaction (Fig. 2(b)). First, we found that the HP is readily degraded by RNase H activity by observing that the HP band disappeared and a new band appeared below its original position when the HP was incubated with RNase H (lane 1). Next, the solution containing HP and TP in the absence of RNase H just showed the two separate bands in their original positions, indicating that they remained separate and did not hybridize with each other (lane 2). On the other hand, when RNase H was applied to the mixture of HP and TP, the two HP and TP bands observed in lane 2 disappeared and instead a new intense band clearly appeared in the upper region, which surely corresponds to the hybridized duplex of TP with the cleaved HP (lane 3). Most importantly, we verified that the final assay products, Broccoli RNA aptamers were successfully produced only from the positive samples containing RNase H, based on another PAGE analysis where only broccoli aptamers are fluorescently visualized on the gel by DFHBI staining (Fig. 2(c)). We also observed that the band intensities for the Broccoli RNA aptamers increased as the concentration of RNase H increased (lane 2–6). Again, all these results firmly verify that RNase H readily degrades the RNA stem of HP and initiates the following in vitro transcription to generate the Broccoli light-up RNA aptamers, as envisioned in Fig. 1.
Analytical performances of the designed approach
To enhance the analytical performance of the designed strategy, we optimized a series of reaction parameters by evaluating the signal-to-background ratios F/F0 at 508 nm, where F and F0 represent the fluorescence intensities from the samples containing target RNase H or not, respectively, under different conditions. First, DFHBI was found to produce a higher F/F0 value through binding to the Broccoli aptamer and was selected as a cognate fluorogen over another cognate dye, DFHBI-1T (Fig. S1†). Next, we optimized the length of the RNA region in the HP stem composed of a total of 20 bases, which would influence the stability of the stem-loop structure and the RNase-H promoted cleavage reaction. As presented in Fig. S2,† the HP consisting of the whole RNA 20 base stem was found to lead to reaction conditions were also optimized, and the results presented in Fig. S3–6† showed that 100 nM HP, 50 nM TP, 3.3 mM rNTP mix, 1.67 U μL−1 T7 RNA polymerase, 30 min for the RNase H-promoted reaction, and 45 min for the in vitro transcription reaction were optimal and used for all subsequent assays.To assess the sensitivity of the designed strategy, we applied sample solutions containing varying concentrations of RNase H (ranging from 0.001 to 1 U mL−1) to the ITA reaction and monitored the corresponding fluorescence signals. As presented in Fig. 3, after plotting the fluorescence signal at 508 nm against RNase H concentration, a highly linear relationship (y = 485![[thin space (1/6-em)]](https://www.rsc.org/images/entities/char_2009.gif) 12x + 434.75, R2 = 0.9979) was observed in the range of 0 to 0.05 U mL−1, indicating that the developed method could accurately quantify RNase H activity. We determined the limit of detection (LOD) for our method to be 0.000156 U mL−1, using the equation LOD = 3σ/S, where σ and S represent the standard deviation of the negative control and the slope of the calibration curve, respectively. This LOD is lower than those of other approaches for detecting RNase H activities, as shown in Table S2.†
12x + 434.75, R2 = 0.9979) was observed in the range of 0 to 0.05 U mL−1, indicating that the developed method could accurately quantify RNase H activity. We determined the limit of detection (LOD) for our method to be 0.000156 U mL−1, using the equation LOD = 3σ/S, where σ and S represent the standard deviation of the negative control and the slope of the calibration curve, respectively. This LOD is lower than those of other approaches for detecting RNase H activities, as shown in Table S2.†
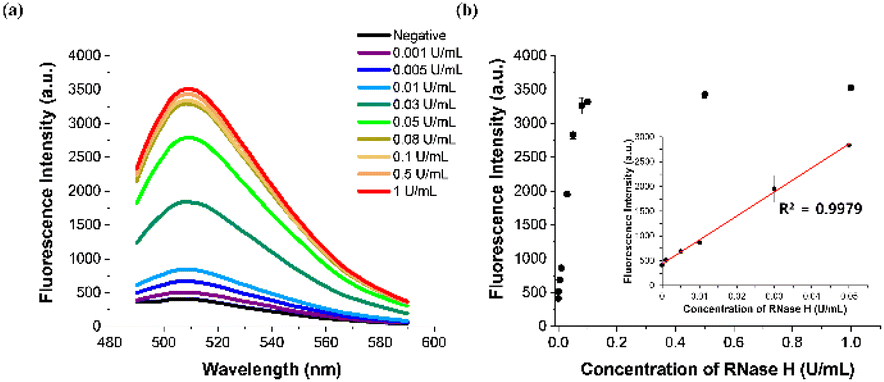 | ||
| Fig. 3 Sensitivity of the designed approach. (a) Fluorescence emission spectra and (b) corresponding fluorescence intensities at 508 nm for samples containing various concentrations of RNase H. Inset in panel (b) depicts a linear relationship between fluorescence intensity at 508 nm and the RNase H concentration which ranges from 0 to 0.05 U mL−1. The final concentrations of HP, TP, rNTP mix, DFHBI, and T7 RNA polymerase were 100 nM, 50 nM, 3.3 mM, 100 μM, and 1.67 U μL−1, respectively. The error bars were calculated from three independent experiments. | ||
The specificity of the designed system for the RNase H assay was next evaluated by testing some non-target enzymes, such as Exo I, Exo III, DNase I, UDG, λ exo, and Eco RI. Fig. 4 shows that only the RNase H-containing sample exhibited significant fluorescence enhancement, while samples containing other non-target enzymes, despite being present at concentrations 20 times higher than RNase H, produced negligible fluorescence signals. The results demonstrate the high specificity of the designed strategy towards the target RNase H activity.
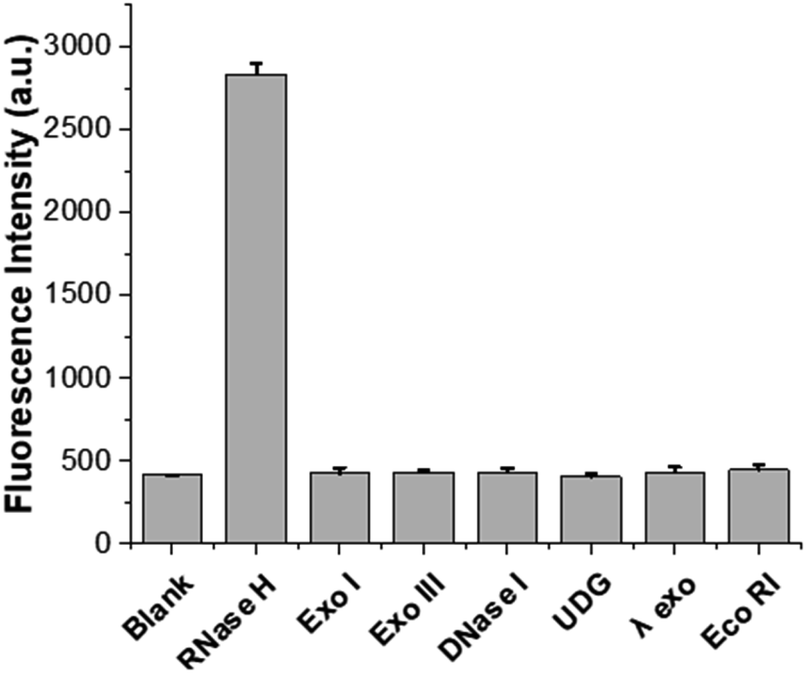 | ||
| Fig. 4 Specificity of the proposed strategy. Comparison of fluorescence intensities at 508 nm between samples containing RNase H and non-target enzymes. The final concentrations of RNase H and non-target enzymes were 0.05 U mL−1 and 1 U mL−1, respectively. The final concentrations of HP, TP, rNTP mix, DFHBI, and T7 RNA polymerase were 100 nM, 50 nM, 3.3 mM, 100 μM, and 1.67 U μL−1, respectively. The error bars were calculated from three independent experiments. | ||
Practical utility of the designed approach
To evaluate the practical utility, we employed the proposed method to examine the RNase H activity in cell lysates. We selected two types of tumor cell lines (A549, HT-29), known to exhibit significant RNase H expression,15 and performed the ITA reaction with their cell lysates. As shown in Fig. 5, the samples containing the two cell lysates showed substantial fluorescence enhancements, indicating that both cell lysates possess high RNase H activities. Notably, the relative RNase H activities in the two cell lysates fully agreed with those from previous reports,15,34 verifying the reliability of the designed strategy. To verify that the fluorescence enhancements were due to the activity of RNase H in the cell lysate and not to any nonspecific enzymes, we conducted the same experiment using HP containing only DNA stems (DNA HP). In such an instance, RNase H is unable to degrade the stem of the HP, the T7 promoter sequence is just blocked within the stem, and in vitro transcription would not proceed. As expected, negligible fluorescence signals were observed from the ITA reaction employing the DNA HP, which were just comparable to that from the blank control (Fig. 5). These findings suggest that the designed approach can accurately identify RNase H activities in complex heterogeneous biological samples, demonstrating its resilient practicality in actual clinical scenarios.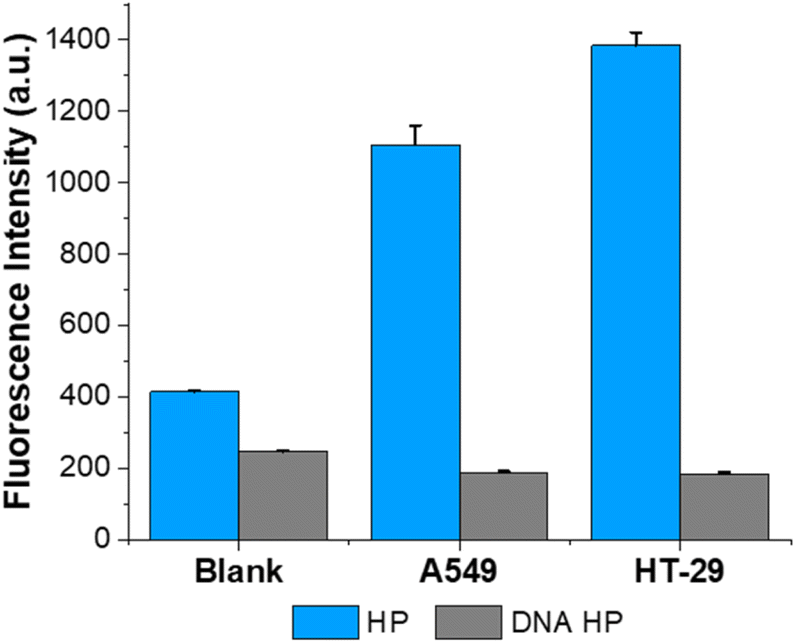 | ||
| Fig. 5 The proposed strategy for tumor cell lysates. Fluorescence signals at 508 nm were obtained from samples containing tumor cell lysates (A549, HT-29). The samples containing DNA HP were also analyzed for fluorescence intensities at 508 nm. The final concentrations of HP, TP, rNTP mix, DFHBI, and T7 RNA polymerase were 100 nM, 50 nM, 3.3 mM, 100 μM, and 1.67 U μL−1, respectively. The error bars were calculated from three independent experiments. | ||
Conclusions
We herein proposed a label-free and ultrasensitive method to identify RNase H activity by utilizing the target-triggered amplification of fluorogenic light-up RNA aptamers. The RNase H activity elaborately led to the in vitro transcription of numerous Broccoli aptamers, which could produce significant fluorescence enhancements upon binding to the cognate DFHBI dye. The proposed design principle allowed for the ultrasensitive detection of RNase H activity down to a record-low LOD of 0.000156 U mL−1 while maintaining excellent specificity against non-target enzymes. The practical utility of the designed method was also validated by successfully identifying the target RNase H activity in complex heterogeneous cell lysates. The proposed method has the potential to be applied to the construction of novel assay techniques for identifying various important biomarkers by accordingly redesigning the HPs. Our method would provide significant insight for the advancement of biosensing platforms that rely on the in vitro transcription of light-up aptamers.Conflicts of interest
There are no conflicts to declare.Acknowledgements
Financial support for this study was provided by the Mid-career Researcher Support Program (NRF-2021R1A2B5B03001739) of the National Research Foundation (NRF). This work was also supported by the NRF grant funded by the Ministry of Science and ICT (MSIT) of Korea (2022K1A4A8A01080317).References
- A. Muroya, Protein Sci., 2001, 10, 707–714 CrossRef CAS PubMed.
- H. Wu, W. F. Lima and S. T. Crooke, J. Biol. Chem., 1999, 274, 28270–28278 CrossRef CAS PubMed.
- S. J. Schultz and J. J. Champoux, Virus Res., 2008, 134, 86–103 CrossRef CAS PubMed.
- J. Rizzo, L. K. Gifford, X. Zhang, A. M. Gewirtz and P. Lu, Mol. Cell. Probes, 2002, 16, 277–283 CrossRef CAS PubMed.
- T. Ogawa and T. Okazaki, Mol. Gen. Genet., 1984, 193, 231–237 CrossRef CAS PubMed.
- E. Tramontano, A. Corona and L. Menéndez-Arias, Antiviral Res., 2019, 171, 104613 CrossRef CAS PubMed.
- P. L. Boyer, S. J. Smith, X. Z. Zhao, K. Das, K. Gruber, E. Arnold, T. R. Burke and S. H. Hughes, J. Virol., 2018, 92, e02203 CrossRef CAS PubMed.
- H.-P. Su, Y. Yan, G. S. Prasad, R. F. Smith, C. L. Daniels, P. D. Abeywickrema, J. C. Reid, H. M. Loughran, M. Kornienko, S. Sharma, J. A. Grobler, B. Xu, V. Sardana, T. J. Allison, P. D. Williams, P. L. Darke, D. J. Hazuda and S. Munshi, J. Virol., 2010, 84, 7625–7633 CrossRef CAS PubMed.
- H. H. Hogrefe, R. I. Hogrefe, R. Y. Walder and J. A. Walder, J. Biol. Chem., 1990, 265, 5561–5566 CrossRef CAS PubMed.
- E. Kanaya and S. Kanaya, Eur. J. Biochem., 1995, 231, 557–562 CrossRef CAS PubMed.
- K. C. Chan, S. R. Budihas, S. F. J. Le Grice, M. A. Parniak, R. J. Crouch, S. A. Gaidamakov, H. J. Isaaq, A. Wamiru, J. B. McMahon and J. A. Beutler, Anal. Biochem., 2004, 331, 296–302 CrossRef CAS PubMed.
- Y. Chen, C. J. Yang, Y. Wu, P. Conlon, Y. Kim, H. Lin and W. Tan, ChemBioChem, 2008, 9, 355–359 CrossRef CAS PubMed.
- D. Hu, F. Pu, Z. Huang, J. Ren and X. Qu, Chem.–Eur. J., 2010, 16, 2605–2610 CrossRef CAS PubMed.
- L. Wang, H. Zhou, B. Liu, C. Zhao, J. Fan, W. Wang and C. Tong, Anal. Chem., 2017, 89, 11014–11020 CrossRef CAS PubMed.
- C. Y. Lee, K. S. Kang, K. S. Park and H. G. Park, Microchim. Acta, 2018, 185, 53 CrossRef PubMed.
- Y. Jung, C. Y. Lee, K. S. Park and H. G. Park, Biotechnol. J., 2019, 14, 2–7 Search PubMed.
- K. Wu, C. Ma, H. Liu, H. He, W. Zeng and K. Wang, Anal. Methods, 2017, 9, 3055–3060 RSC.
- W. Wang, M. Shu, A. Nie and H. Han, Sens. Actuators, B, 2020, 304, 127380 CrossRef CAS.
- A. D. Ellington and J. W. Szostak, Nature, 1990, 346, 818–822 CrossRef CAS PubMed.
- V. Pavlov, Y. Xiao, B. Shlyahovsky and I. Willner, J. Am. Chem. Soc., 2004, 126, 11768–11769 CrossRef CAS PubMed.
- J. Zhang, L. Wang, D. Pan, S. Song, F. Y. C. Boey, H. Zhang and C. Fan, Small, 2008, 4, 1196–1200 CrossRef CAS PubMed.
- J. K. Herr, J. E. Smith, C. D. Medley, D. Shangguan and W. Tan, Anal. Chem., 2006, 78, 2918–2924 CrossRef CAS PubMed.
- F. Bouhedda, A. Autour and M. Ryckelynck, Int. J. Mol. Sci., 2017, 19, 44 CrossRef PubMed.
- J. Ouellet, Front. Chem., 2016, 4, 1–12 CAS.
- Z. M. Ying, B. Tu, L. Liu, H. Tang, L. J. Tang and J. H. Jiang, Chem. Commun., 2018, 54, 3010–3013 RSC.
- X. Tang, R. Deng, Y. Sun, X. Ren, M. Zhou and J. Li, Anal. Chem., 2018, 90, 10001–10008 CrossRef CAS PubMed.
- L. Sheng, Y. Lu, S. Deng, X. Liao, K. Zhang, T. Ding, H. Gao, D. Liu, R. Deng and J. Li, Chem. Commun., 2019, 55, 10096–10099 RSC.
- S. Lee, H. Kim, H. Y. Kim and H. G. Park, Chem. Commun., 2021, 57, 12341–12344 RSC.
- S. Lee, H. Kim, Y. Park and H. G. Park, Chem. Commun., 2022, 58, 4243–4246 RSC.
- Y. Park, J. Yoon, J. Lee, S. Lee and H. G. Park, Biosens. Bioelectron., 2022, 204, 114071 CrossRef CAS PubMed.
- J. Shen, X. Zhou, Y. Shan, H. Yue, R. Huang, J. Hu and D. Xing, Nat. Commun., 2020, 11, 1–10 CrossRef PubMed.
- M. Zhou, X. Teng, Y. Li, R. Deng and J. Li, Anal. Chem., 2019, 91, 5295–5302 CrossRef CAS PubMed.
- G. S. Filonov, C. W. Kam, W. Song and S. R. Jaffrey, Chem. Biol., 2015, 22, 649–660 CrossRef CAS PubMed.
- H. Kim, S. Lee, J. Lee and H. G. Park, Chem. Commun., 2022, 58, 2654–2657 RSC.
Footnote |
| † Electronic supplementary information (ESI) available. See DOI: https://doi.org/10.1039/d3na00975k |
| This journal is © The Royal Society of Chemistry 2024 |