 Open Access Article
First-principles calculations on monolayer WX2 (X = S, Se) as an effective drug delivery carrier for anti-tuberculosis drugs†
Khaled
Mahmud‡
,
Taki
Yashir‡
and
Ahmed
Zubair
 *
*
Department of Electrical and Electronic Engineering, Bangladesh University of Engineering and Technology, Dhaka 1205, Bangladesh. E-mail: ahmedzubair@eee.buet.ac.bd
First published on 25th March 2024
Abstract
Tuberculosis (TB) remains a major global health concern, necessitating the exploration of novel drug delivery systems to combat the challenges posed by conventional approaches. We investigated the potential of monolayer transition metal dichalcogenides (TMDs) as an innovative platform for efficient and targeted delivery of antituberculosis drugs. Specifically, the electronic and optical properties of prominent TB drugs, isoniazid (INH) and pyrazinamide (PZA), adsorbed on tungsten diselenide (WSe2) and tungsten disulfide (WS2) monolayers were studied using first-principles calculations based on density functional theory (DFT). The investigation revealed that the band gaps of WSe2 and WS2 monolayers remain unaltered upon adsorption of PZA or INH, with negative adsorption energy indicating stable physisorption. We explored different vertical and horizontal configurations, and the horizontal ones were more stable. When INH and PZA drugs were horizontally adsorbed together on WSe2, the most stable configuration was found with an adsorption energy of −2.35 eV. Moreover, the adsorbed drugs could be readily released by light within the visible or near-infrared (NIR) wavelength range. This opened up possibilities for their potential application in photothermal therapy, harnessing the unique properties of these 2D materials. The comprehensive analysis of the band structures and density of states provides valuable insights into how the drug molecules contributed to the conduction and valence bands. The optical responses of anti-TB drugs adsorbed in 2D WSe2 and WS2 were similar to those of pristine 2D WSe2 and WS2. We demonstrated the temperature-dependent release mechanism of our 2D WSe2 and WS2 drug complexes, confirming the feasibility of releasing the discussed anti-tuberculosis drugs by generating heat through photothermal therapy. These findings hold significant promise for developing innovative drug delivery systems that have enhanced efficacy for targeted and low-toxic TB treatment.
1 Introduction
TB is an infectious fatal disease and is one of the deadliest diseases worldwide. A bacterium called Mycobacterium tuberculosis primarily attacks the lungs and causes this infection.1 Despite antibiotics being developed, an estimated 10.6 million people are infected by tuberculosis annually, and 1.3 million people died of TB in 2022, according to the World Health Organization (WHO).2 One of the most prominent reasons for such fatality of this disease is the rise of drug-resistant variants of Mycobacterium tuberculosis.3 The conventional drug delivery system is worsening the problem as it has a low efficiency and poor bioavailability.4,5 Since the traditional drug delivery system is non-controlled and non-specific, even healthy tissues are affected by the drug dosages, and the targeted infected site receives low concentrations of drug dosage. High-concentration dosage in the form of tablets or capsules fails to fix the problem because it aggravates the side effects by harming healthy cells.6 To combat the issue, it is necessary to develop novel and effective drug delivery systems with enhanced medicinal profiles and therapeutic agent efficacy. Nanomaterial-based targeted drug delivery systems have gained popularity due to their targeted attack on infected cells while not endangering normal tissues and cells of the body.7Nanotechnology advancements have revolutionized conventional therapies by enhancing the efficacy of drug delivery strategies 8 Nanomaterial-based drug delivery systems have enhanced targeting because their small size, ranging from 1–100 nm, allows them to pass through biological barriers, such as the small intestine and skin, for more effective delivery.9 On top of that, depending on the drug carrier material, the crystallinity of the drug carrier, and the type of adsorption (chemisorption or physisorption) for different drugs, these nanocarrier/drug complexes release drugs through various mechanisms that ensure a controlled releasing mechanism. Multiple studies have shown that pH, temperature, and chemical reaction-controlled release are common mechanisms for explaining the release of pharmaceuticals from nanocarriers.10,11 From previous studies, different nanomaterial-based targeted drug delivery systems were reported, including silver (Ag) nanoparticles,12 Janus and dendrimer particles 13 and quantum dots.14 Different experimental procedures and clinical experiments on animals are ongoing regarding nanomaterial-based drug delivery systems.
The investigation of two-dimensional (2D) nanomaterials in the field of therapies and innovative biomedicine has garnered significant attention in recent times, as they provide efficient techniques for disease diagnosis and drug targeting treatment.15,16 Graphene and its oxides,17,18 hexagonal boron nitride19 and phosphorene20 were reported to be useful in targeted drug therapy. 2D materials demonstrate an impressive capability in drug delivery with numerous benefits. The use of 2D materials combined with specific pharmaceutical agents exhibited enhanced efficacy in comparison to alternative nanocarriers, such as nanoparticles, nanotubes, and nanowires, because of their lamella structure, which provides a high surface area-to-mass ratio and other unique physicochemical properties.21–23 The vast surface area ensured highly efficient drug loading.24 On top of that, 2D nanocarriers have good physical interactions with specific drugs, confirming their proper drug-carrying capability. Transition metal dichalcogenides (TMDs), a group of 2D materials, are very promising in biomedical applications25,26 along with their high utilization in spintronics27 and optoelectronics.28 These materials are widely used in sensing applications as their adsorption performance is superior. Previously, a DFT-based study of the interaction between gas molecules and MoS2 nanosheets was reported.29 TMD materials, WSe2 and MoS2, were theoretically studied as TiO2/WSe2 and TiO2/MoS2 nanocomposites for a high-performance gas sensor with excellent adsorption capabilities.30–32 A machine learning interatomic potential (MLIP) based approach can be beneficial to get the properties of materials.33 Moreover, TMD materials' superior light and heat conversion efficiencies make them suitable for photo/thermal-induced tumor photothermal and photodynamic therapy.34
Many targeted drug delivery systems were studied for cancer disease, whereas their use in TB treatment received recent attention. To combat TB, some antibiotics like isoniazid (INH), pyrazinamide (PZA) and rifampicin (RIF) are used. Since conventional methods fail to treat this disease, targeted drug delivery systems through nanomaterials have attracted huge interest. Nanoparticles like gold (Au)35 and carbon nanotubes36 were used to ensure that anti-TB drugs successfully reach infected lung cells and release the drug. However, 2D materials, including TMDs, will increase efficiency as they have larger planar and good loading and releasing capability. TMDs, such as WSe2 and WS2, are widely used in electronic and optoelectronic applications.27,37,38 The monolayers of these materials have direct bandgaps that pave the way for photothermal therapy. WSe2 and WS2 are biodegradable and have lower toxicity than graphene and its derivatives.39,40 These make them good candidates for targeted drug delivery systems. Exploring the suitability of different highly efficient, nontoxic 2D TMD materials in this field is vital. Moreover, TMDs, such as WSe2 and WS2, were not explored as drug delivery systems.
This study investigated the interaction between two prominent anti-TB drugs, INH and PZA, with two promising TMD materials, WSe2 and WS2, and the possible adsorption of the drugs on these 2D materials. We calculated various orientations of the adsorbed anti-TB drugs to evaluate the thermal stability of drug/2D TMD complexes from the perspective of adsorption energy. Furthermore, we calculated the band structures of pristine materials and the band structures when drugs were adsorbed on their planar surface. This investigation provided insight into their crystal-based interaction. For further comprehension, projected band structures were calculated to determine the orbital contributions of various bands. The density of states of drug atoms on adsorbed complexes was calculated to confirm their interaction with 2D materials. Additionally, we performed Mulliken charge analysis and calculated the electron density difference to know the nature of the bond and interaction of drug atoms and WS2 and WSe2. Optical properties were investigated to observe the absorption behavior of drug/2D TMD complexes and to check the suitability of using photothermal therapy. Finally, to investigate the controlled releasing criteria, we calculated the change of adsorption energy with increasing temperature. This study will facilitate designing a nanosystem for targeted and selective anti-TB drug delivery via WS2 and WSe2 monolayers.
2 Methods
We performed first-principles calculations using density functional theory (DFT),41 employing generalized gradient approximation (GGA) with the Perdew–Burke–Ernzerhof (PBE) parametrization functional for exchange–correlation interactions and Grimme's DFT-D scheme42 for van der Waals interactions. At first, we cleaved a monolayer of tungsten diselenide (WSe2) and tungsten disulfide (WS2) from bulk hexagonal symmetry (2 H) crystals. Each unit cell consists of three atoms: one tungsten (W) and two selenium (Se) or sulfur (S) atoms. To prevent interlayer interactions, we introduced a 20 Å vacuum. A (4 × 4 × 1) supercell, consisting of 48 atoms, was constructed to serve as the nanocarrier for anti-TB drugs such as INH and PZA. The chemical formulae of INH and PZA are C5N3H5O and C5N3H5O, respectively. We determined the suitable location and orientation for drug adsorption using the Adsorption Locator module43 in Materials Studio. We selected the most energetically stable orientation and location of drugs for subsequent relaxation and property calculations. The relaxation process was performed using the CASTEP44 module in Materials Studio, within a kinetic energy cutoff of 450 eV, Gaussian smearing of 0.04 eV, an ultrasoft pseudopotential for 2D TMDs and drug atoms and a (3 × 3 × 1) Γ-centered k-point grid in the Monkhorst–Pack scheme. The iterative procedure was repeated until the convergence threshold of the total energy reached below 10−5 eV per atom, the Hellmann–Feynman force among the atoms was below 0.02 eV Å−1, and the stress was below 0.1 GPa. For electronic and optical property calculations, we increased the sampling in the Monkhorst–Pack k-point grid to (5 × 5 × 1) Γ-centered k-points for higher accuracy. We used the DMol3 (ref. 45) module in Materials Studio to determine the adsorption energies (Eads) of the anti-TB drug/WSe2 (WS2) complexes. The adsorption energy was calculated by deducting the energies of the drug molecules and the monolayer WSe2 (WS2) from the energy of the complex, as given by,| Eads = Edrug/2D TMD − E2D TMD − Edrug | (1) |
Electronic band dispersion calculations were performed along the Γ (0 0 0) → M (0.0 0.5 0.0) → K (−0.333 0.667 0.0) → Γ (0 0 0) path for energetically stable configurations. The density of states (DOS) calculations were conducted for pure WSe2, pure WS2, drug/monolayer WSe2, and drug/monolayer WSe2. The projection of DOS on various orbitals of all constituent atoms was performed for drug complexes. These calculations were performed through the CASTEP module.
To further understand the nature of adsorption, we performed Mulliken charge analysis 46 and electron density difference (EDD) calculations in CASTEP. Additionally, we calculated the optical properties of the system in CASTEP to analyze the effect of drug adsorption on the 2D sheets. Details of the optical property calculations are provided in the ESI.† Furthermore, we performed orbital projected band structure calculations using the Quantum Espresso simulation package47,48 to determine the suborbital contributions to the various bands. Moreover, to show the temperature-dependent release of the drugs, we used the Phonopy open source package49 to determine the temperature-dependent portion of Helmholtz free energy. Through Phonopy, supercells with different displacements of atoms were created. After calculating the self-consistent field (SCF) of each of them, the force set was calculated, and through it, thermodynamic properties, including Helmholtz free energy and temperature-dependent vibrational energy, were estimated. In the Materials Studio, all the calculations were performed at T = 0 K. Hence, the adsorption energy was also calculated at T = 0 K. We determined temperature-dependent vibrational energy and calculated the adsorption energy for various temperatures.
3 Results
3.1 Geometry structure and adsorption energy for anti-TB drug/2D TMD complexes
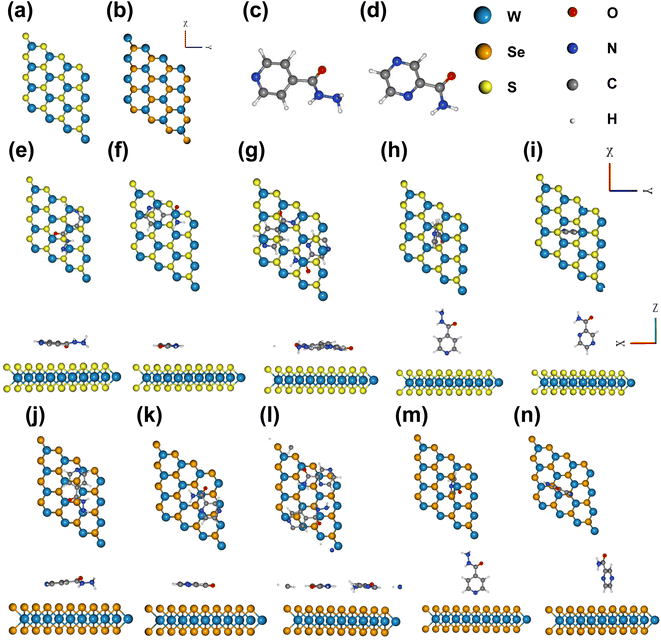
We relaxed the pristine structures of WS2, WSe2, INH, and PZA, which are shown in Fig. 1(a)–(d). INH and PZA drugs have a hexagonal plane and tilted –CON2H3 and –CONH2 functional groups. The transition metal tungsten (W) is sandwiched between two chalcogen layers of sulfur (S) atoms in 2 H WS2. The bulk WS2 consists of many layers of monolayer WS2, and layers are packed due to weak van der Waals forces. A monolayer of WS2 can be found through physical or chemical processes. A hexagonal phase is seen in the WS2 structure where three S atoms are bonded to a single W atom, and prominent coulombic interaction is found between S and W molecules. WSe2 has a similar geometric structure. Lattice constants, the bond length between W and S/Se atoms, and bond angles of two optimized structures were investigated. The results are shown in Table 1. The bond length of W–S was found to be 2.42 Å and for W–Se, the length was 2.53 Å. These results were consistent with previous studies.28,50 Monolayer WS2 and WSe2 had lattice constants of 3.18 Å and 3.2925 Å, which agreed with previously reported values.51| Crystal structures | Lattice constant (a = b in Å) | Bond length W–S (Å) | Bond length W–Se (Å) | ∠S–W–S | ∠Se–W–Se |
|---|---|---|---|---|---|
| WS2 (4 × 4 × 1) | 12.72 | 2.42 | 80.94° | ||
| WSe2 (4 × 4 × 1) | 13.17 | 2.53 | 81.13° |
Fig. 1(e)–(i) show the different adsorption configurations of INH and PZA drugs on the monolayer WS2 surface. From top and side views, it is demonstrated that drugs were adsorbed in both horizontal and vertical directions. In Fig. 1(g) it is seen that both drugs were simultaneously adsorbed in the horizontal direction for WS2. Here, the horizontal configuration implies that the drug and 2D TMDs were in a parallel direction, and the vertical configuration means the perpendicular orientation of drug structures. Fig. 1(j)–(n) show the 2D TMD drug complexes of horizontal and vertical adsorption on monolayer WSe2. Table 2 shows the calculated adsorption energy and vertical distances between anti-TB drugs and 2D TMDs. In 2D TMD drug complexes, the configurations suggest that physisorption occurred rather than chemisorption. For vertical structures of drug/2D TMD, we used the notation of drug(V)/2D TMD, and for horizontal structures, we used drug(H)/2D TMD. Drug (V)/WS2 and drug(V)/WSe2 had higher adsorption energies than other configurations, making them metastable. The most thermally stable structure was found when both INH and PZA drugs were adsorbed simultaneously. INH/PZA(H)/WSe2 configuration was the thermally strongest 2D TMD monolayer complex with an adsorption energy of −2.35 eV. PZA(V)/WS2 configuration had the highest adsorption energy of −0.28 eV among the studied configurations. Comparing thermal stability through the formation energy of the structures, INH/PZA(H)/WSe2 > INH/PZA(H)/WS2 > INH(H)/WSe2 > PZA(H)/WS2 > INH(H)/WS2 > PZA(H)/WS2INH(V)/WSe2 > PZA(V)/WS2 > INH(V)/WS2 > PZA(V)/WS2. If the adsorption energy of a drug/2D TMD complex becomes much lower, then stability may be higher but it will be difficult to release the drug conveniently. So, adsorption energy must be in the moderate range for drug release and structural stability. All the drug(V)/2D TMD complexes had much higher adsorption energy so they might be in a metastable state where their uncontrolled release characteristic is more probable. As a result, we emphasized drug(H)/2D TMD complexes in this paper.
| Drug structures | WS2 | WSe2 | ||
|---|---|---|---|---|
| d | E ads | d | E ads | |
| (Å) | (eV) | (Å) | (eV) | |
| INH (H) | 3.46 | −0.96 | 3.89 | −1.25 |
| PZA (H) | 3.38 | −0.99 | 3.59 | −1.21 |
| INH/PZA (H) | 3.11 | −1.97 | 3.16 | −2.35 |
| INH (V) | 3.32 | −0.48 | 2.81 | −0.80 |
| PZA (V) | 3.49 | −0.28 | 2.81 | −0.74 |
3.2 Electronic properties
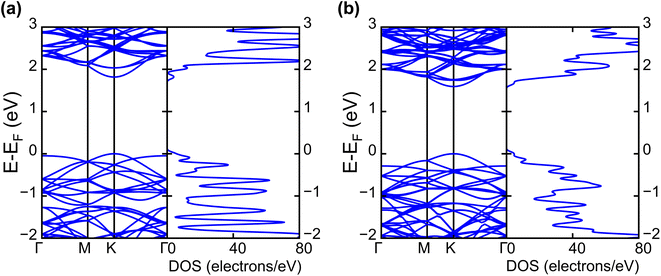 | ||
| Fig. 2 Calculated electronic band structures and corresponding DOS of pristine (a) WS2 and (b) WSe2 monolayers. | ||
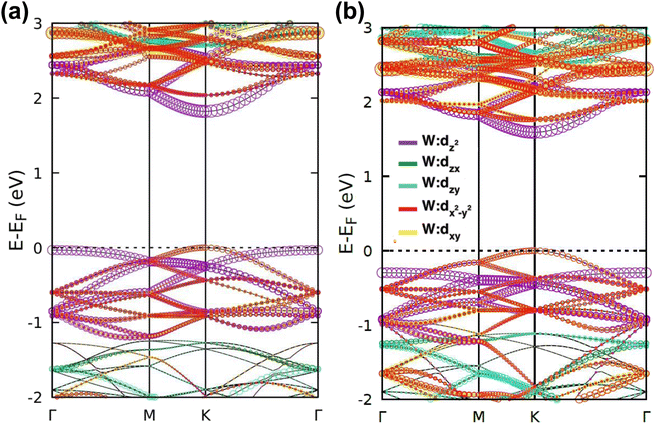
The band projection on atomic orbitals was performed to understand the band structure better, and the contributions of different orbitals were evaluated. The d-orbitals of the transition metal W atom mainly contributed to the valence and conduction band edges. For WS2, dx2−y2 contributed 36.68% and dxy contributed 36.66% to valence band maxima (VBM). Other main contributions to VBM came from the px (10.4%) and py (10.4%) orbitals of S atoms. The conduction band minima (CBM) mainly consisted of the dz2 orbital, with a contribution of 80.32%. The s orbital of the W atom contributed more than 10% to CBM. For WSe2, the involvement of d orbitals with their contribution percentage remained almost the same. The dx2−y2 contributed 38.59% and dxy contributed 38.11% to the valence band maxima (VBM) of WS2, while dz2 contributed to 78.69% to CBM. Fig. 3(a) and (b) show the orbital projected band diagram for pristine WS2 and WSe2 monolayers.
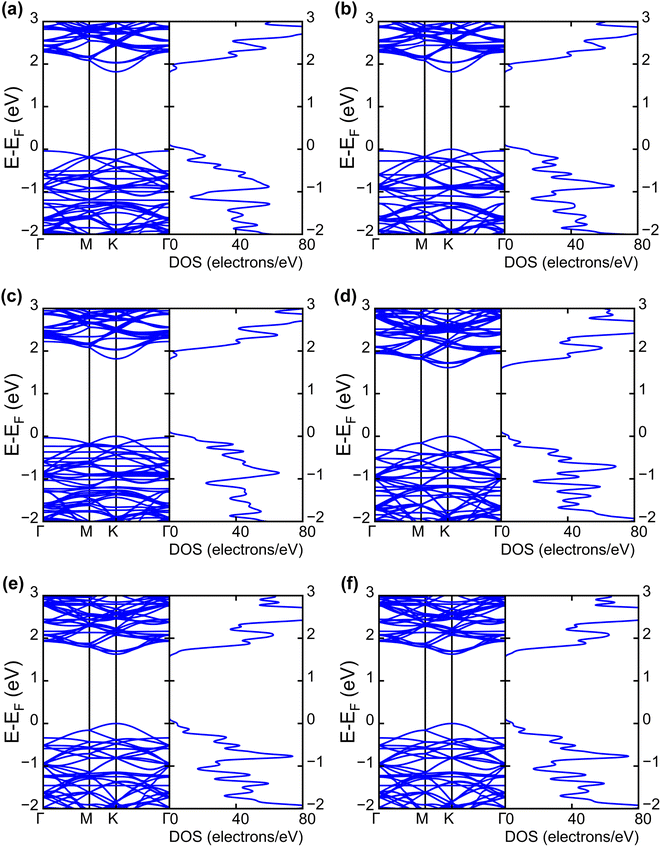 | ||
| Fig. 4 Electronic band structures and DOS of (a) INH(H)/WS2, (b) PZA(H)/WS2, (c) INH/PZA(H)/WS2, (d) INH(H)/WSe2, (e) PZA(H)/WSe2, and (f) INH/PZA(H)/WSe2. | ||
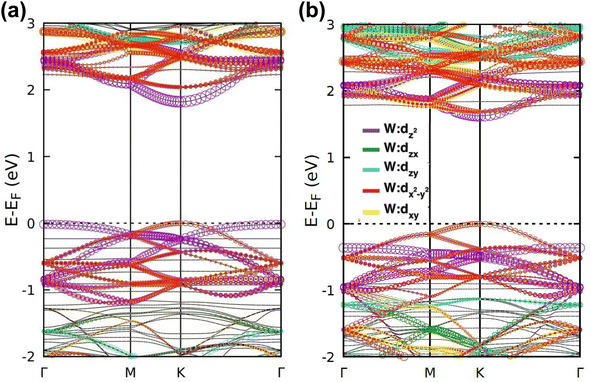
The projected DOS of drug atoms in drug/2D TMD complexes was calculated for further investigation. Fig. 5(a) and (b) depict the DOS of drug atoms in the two structures that were energetically most favorable, INH/PZA(H)/WS2 and INH/PZA(H)/WSe2. As new states of drugs were introduced into the complex structures, it is evident that interactions occurred between drug atoms and 2D materials. TB drug atoms that were adsorbed did not add new states to the pristine bandgap region, and that's why pristine structures dominated the bandgap of the 2D TMD monolayer complexes. However, drug atoms have added states below the VBM and above the CBM. Besides, it can be seen that the p orbital of the drug atoms predominantly contributed to the new states where the s orbital had little contribution to valence bands and almost negligible presence in conduction bands. Details of individual drug atoms' contribution to the DOS are discussed in the ESI.† Furthermore, we calculated the projected band structure for those two energetically most stable structures and found that the contributions of d orbitals are almost the same as that of their pristine structures. For INH/PZA(H)/WSe2, dx2−y2 contributed 39.65% and dxy contributed 39.65% to VBM where CBM mainly consisted of the dz2 orbital, with a contribution of 80.55%. However, insignificant changes in d suborbital contributions were observed in INH/PZA(H)/WS2 compared to those of pristine WS2, as seen in Fig. 6.
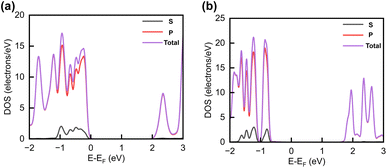 | ||
| Fig. 5 Calculated projected DOS of INH and PZA drug atoms for (a) INH/PZA(H)/WS2 and (b) INH/PZA(H)WSe2. | ||
3.3 Charge density analysis
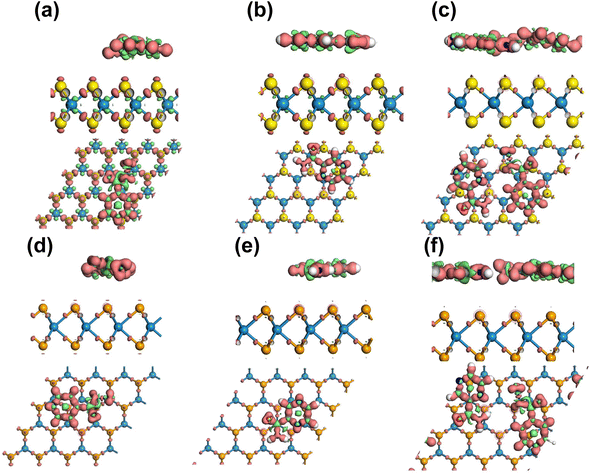
After confirming the energy stability of drug adsorption, comprehensive analyses were conducted using Mulliken charge analysis and the electron density difference (EDD) to elucidate the nature and mechanisms of drug adsorption on monolayer WSe2 and WS2. Notably, no covalent bonds were formed between the drug molecules and the 2D TMD materials, and the adsorption distances fell within the optimal range of physisorption. We determined the electron density difference, Δndrug/2D TMD, of the 2D TMD complexes before and after the drug molecules' physisorption using the formula below to explore the interaction between molecules and 2D TMDs.| Δndrug/2D TMD = ndrug/2D TMD − n2D TMD − ndrug | (2) |
Mulliken charge transfer analysis revealed that the average charge per atom exhibited slight changes following adsorption. Electrons were transferred from the drug molecules to the drug(H)/2D TMD complex interface, specifically to the electrophilic groups (CON2H3 in INH and CONH2 in PZA) of the drug molecules. The electrophilic groups of INH exhibited an attractive force towards the electrons present in the 2D TMDs. This interaction led to the polarization of the complex situated underneath the adsorption site, thereby inducing intramolecular charge transfer. The transfer of electrons between the drug molecules and the WSe2 and WS2 surfaces was not uniform. The atoms in the drug molecules that were closer to the interface experienced the greatest electron transfer, while the atoms that were further away experienced negligible electron transfer. The average charge density difference for each drug molecule is summarized in Tables 3 and 4.
| Atoms | WSe2 | INH(H)/WSe2 | PZA(H)/WSe2 | INH/PZA(H)/WSe2 |
|---|---|---|---|---|
| (|e|) | (|e|) | (|e|) | (|e|) | |
| H | 0.378 | 0.266 | 0.292 | 0.283 |
| C | 0 | −0.068 | 0.034 | −0.023 |
| N | −0.565 | −0.510 | −0.520 | −0.517 |
| O | −0.575 | −0.530 | −0.550 | −0.535 |
| Se | 0.100 | 0.121 | 0.113 | 0.139 |
| W | −0.190 | −0.203 | −0.196 | −0.212 |
| Atoms | WS2 | INH(H)/WS2 | PZA(H)/WS2 | INH/PZA(H)/WS2 |
|---|---|---|---|---|
| (|e|) | (|e|) | (|e|) | (|e|) | |
| H | 0.171 | 0.356 | 0.380 | 0.356 |
| C | 0.029 | 0.061 | 0.048 | −0.003 |
| N | −0.196 | −0.540 | −0.546 | −0.540 |
| O | −0.372 | −0.560 | −0.590 | −0.565 |
| S | −0.030 | −0.028 | −0.028 | −0.024 |
| W | 0.060 | 0.059 | 0.058 | 0.059 |
Drug molecules inside the INH(H)/WSe2 complex demonstrated the most significant gain in electron density, with the C, N, and O atoms gaining 0.068e, 0.055e, and 0.045e, respectively. Conversely, the H atoms in these molecules lost 0.112e. The molecules of the drug within the PZA(H)/WSe2 complex also gained electrons, but the gains were smaller than those observed in the INH(H)/WSe2 complex (0.045e, 0.034e, and 0.025e for N, C, and O atoms, respectively). The H atoms in these molecules also lost electrons, but the losses were also smaller than those observed in the INH(H)/WSe2 complex (0.086e). The drugs contained within the INH/PZA(H)/WSe2 complex showed the greatest gains again, with the N, O, and C atoms gaining 0.048e, 0.040e, and 0.023e, respectively. The H atoms in these molecules also lost electrons, but the losses were similar to those observed in the PZA(H)/WSe2 complex (0.095e).
Drug molecules inside the PZA(H)/WS2 complex gained electrons, with the greatest gains observed for the N and O atoms (0.344e and 0.118e, respectively). Conversely, the H and C atoms in these molecules lost electrons (0.112e and 0.019e). The molecules of the drug within the INH(H)/WS2 complex also gained electrons, but the gains were higher than those observed in the PZA(H)/WS2 complex (0.188e, 0.344e and 0.089e for O, N and C atoms, respectively). The H atoms in these molecules also lost electrons, but the losses were also higher than those observed in the PZA(H)/WS2 complex (0.185e). The drugs contained within the INH/PZA(H)/WS2 complex showed the largest gains in electron density among the three, with the greatest gains again observed for the C, O, and N atoms (0.0315e, 0.193e, and 0.344e respectively). The H atoms in these molecules also lost electrons, but the losses were similar to those observed in the PZA(H)/WS2 complex (0.185e).
Overall, the Mulliken charge transfer analysis results suggest that the drug molecules in all six complexes interacted with the WSe2 and WS2 surfaces similarly, with the greatest electron transfer occurring to the N, C, and O atoms. The H atoms in these molecules lost electrons, but the losses were smaller than those observed for the N, C, and O atoms. This electron sharing was found to be insufficient for the formation of additional covalent bonds but adequate for physisorption. Fig. 7 visually depicts the accumulation of electrons on the Se and S atoms, while the drug functional groups experienced a depletion of electrons. Here, an iso-surface value of 0.1 was used. Considering the significant adsorption distances and the low magnitude of charge transfer, it can be concluded that the drug molecules undergo physisorption on the WSe2 and WS2 monolayers.
3.4 Optical properties
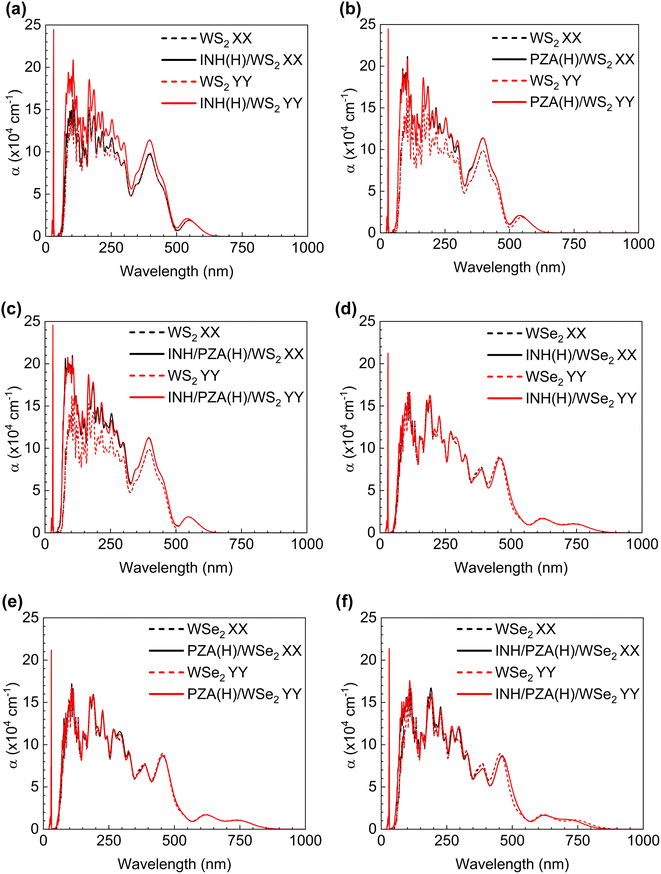
The WSe2 and WS2 drug complexes can be used in phototherapy. In this regard, the optical properties of WSe2 and WS2 and their drug complexes were calculated. The absorption coefficient vs. wavelength is a critical parameter for nanomaterial-based drug delivery systems. Absorption coefficients are calculated from the imaginary part of the complex dielectric constant of pristine structures and their complexes. (See the ESI for the detailed formulation†). The relationship between the absorption coefficient, α, and dielectric constants, ε1 and ε2, is given by the following equation. | (3) |
For the drug complexes to be utilized in photothermal therapy, there should be good absorption within the visible range (wavelengths of 400–700 nm) or near-infrared (NIR) range (700–1350 nm).55 This is because we cannot use light of all wavelengths on the body as it will damage the tissues and cells. Fig. 8(a)–(f) show the optical behavior of drug(H)/WS2 and drug(H)/WSe2 complexes compared with the pristine behavior. It is evident that a good absorption peak was found in both the visible range and the NIR range for drug (H)/WSe2 structures. However, for drug(H)/WS2 structures, a notable peak is found only within the visible light range. The PZA and INH structures have a noteworthy absorption peak between 3.5 and 4.0 eV.20 When they were adsorbed by WSe2 or WS2, the 2D TMD dominated their characteristics, and this aligned with the absorption coefficient figures too. When polarized light in the x or y direction passed through the pristine and drug(H)/2D TMD complexes, the absorption behavior was investigated. The pristine WSe2 structure had the same absorption behavior in both directions, and absorption started from the onset of the bandgap. WSe2 drug complexes also showed the same trend. For pristine WS2 absorption started from the edge of the corresponding bandgap wavelength, regardless of whether y or x polarized light was incident on it. Drug(H)/WSe2 complexes showed a similar tendency.
The utilization of NIR photothermal therapy is not feasible for drug(H)/WS2 structures because of the absence of a strong absorption peak within the NIR spectral range (700–1350 nm). Finally, it can be said that photothermal therapy can be achievable with both drug(H)/WS2 and drug(H)/WSe2 structures, regardless of whether x or y polarized light was incident. However, photothermal therapy with the NIR range can be achievable only for drug(H)/WSe2 structures. In this regard, WSe2 drug complexes are in a better place since the use of NIR is highly appreciable in photothermal therapy due to better biological penetration of NIR light in the body.56
3.5 Release of drug molecules
After optical radiation is applied in photothermal therapy, releasing drug compounds from drug/2D TMD structures is critical in targeted drug delivery systems. Hence, adsorption energy should be a function of temperature in this case. The previous calculations of adsorption energy were done at T = 0 K with the idealized criteria and omitting the thermal vibrational component of the system. In temperature-controlled studies, such as drug delivery in photothermal treatment, it is imperative to consider the Helmholtz free energy (F) as the essential thermodynamic potential. Consequently, the thermal corrections in the adsorption energy were determined by considering the phonon vibration modes as quantum harmonic oscillators. Vibrational energy is temperature-dependent, and adding it to ideal adsorption energy will give a more accurate result. Vibrational energy was calculated with the “finite difference method”.| F = EDFT + Avibrational | (4) |
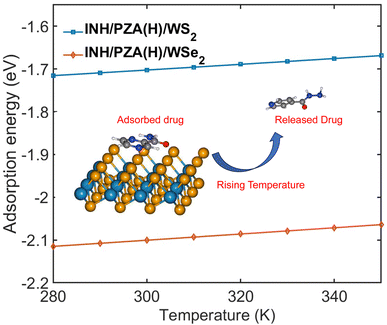
Fig. 9 demonstrates the change of adsorption energy with temperature. Both drug/2D TMD complexes showed an increase in adsorption energy with the increase in temperature. The INH/PZA(H)/WS2 graph shows a 0.3034 eV increase in adsorption energy when temperature increased from 0 to 350 K, where the INH/PZA(H)/WSe2 complex demonstrated a 0.2861 eV increase in energy. The rise of adsorption energy will enable a temperature-controlled release of anti-TB drug molecules. Since the formation energy (or adsorption energy of drug molecules) of 2D TMD complexes was rising, the probability of the anti-TB drug compound being isolated from weakly physisorbed interaction is higher. This method of temperature-dependent adsorption energy calculation was reported previously.20 Moreover, this temperature-controlled releasing mechanism is experimentally proven for other 2D material-based targeted drug delivery systems. For example, a multifunctional MoS2-based targeted drug delivery system for tumor cells was successfully synthesized, and the drug was released with photothermal therapy in the NIR region.57
4 Conclusion
We systematically investigated the interaction between two anti-TB drugs and two nanocarriers, WS2 and WSe2 monolayers, using DFT calculations. Our results suggested that all the drug/2D TMD complexes were stable because of their favorable adsorption energy. The most stable structure was found when INH and PZA drugs were simultaneously adsorbed on a TMD sheet. Further analysis of bands and DOSs suggested that band structures were mainly dominated by pristine TMD materials, which were more comprehensively understood by projected band structures. Moreover, EDD and Mulliken charge analysis of the drug(H)/TMD complexes ensured that no chemical bond was formed between drug atoms and 2D TMD materials. This suggests that both drugs can be easily released to the targeted site. Optical analysis showed that drug(H)/WS2 complexes had good absorption within the visible range and drug(H)/WSe2 had good absorption peaks within the NIR range. This shows the possibility of using photothermal therapy with our drug delivery system. Finally, we showed the temperature-dependent releasing mechanism of our TMD material complexes and ensured that the discussed anti-TB drugs could be released by creating heat through photothermal therapy. Our proposed targeted drug delivery system consisting of WS2 or WSe2 sheets showed great promise regarding their potential applications in photothermal therapy and temperature-dependent releasing behavior. The integration of combined photothermal therapy and chemotherapy treatments could revolutionize the field of TB therapy, paving the way for more effective and tailored approaches to combat this deadly disease.Author contributions
Khaled Mahmud: conceptualization, formal analysis, methodology, visualization, software, investigation, and writing – original draft. Taki Yashir: methodology, visualization, software, and investigation. Ahmed Zubair: supervision, conceptualization, methodology, visualization, project administration, resources, writing – original draft, and writing – review & editing.Conflicts of interest
There are no conflicts to declare.Acknowledgements
K. M. and T. Y. acknowledge the Nanoscale Simulation, Characterization and Fabrication Lab, Department of EEE, BUET, supervised by A. Z., for this work. All the authors thank the Department of EEE, BUET for providing the necessary support. T. Y. acknowledges the funding from the Research and Innovation Centre for Science and Engineering (RISE), BUET.Notes and references
- G. Delogu, M. Sali and G. Fadda, Mediterr. J. Hematol. Infect. Dis., 2013, 5, e2013070 CrossRef PubMed.
- https://www.who.int/news-room/fact-sheets/detail/tuberculosis .
- P. E. Almeida Da Silva and J. C. Palomino, J. Antimicrob. Chemother., 2011, 66, 1417–1430 CrossRef CAS PubMed.
- T. L. Andresen, S. S. Jensen and K. Jørgensen, Prog. Lipid Res., 2005, 44, 68–97 CrossRef CAS PubMed.
- F. Laffleur and V. Keckeis, Int. J. Pharm., 2020, 590, 119912 CrossRef CAS PubMed.
- T. Schaberg, K. Rebhan and H. Lode, Eur. Respir. J., 1996, 9, 2026–2030 CrossRef CAS PubMed.
- J. Jacob, J. T. Haponiuk, S. Thomas and S. Gopi, Mater. Today Chem., 2018, 9, 43–55 CrossRef CAS.
- R. Dhankhar, S. P. Vyas, A. K. Jain, S. Arora, G. Rath and A. K. Goyal, Artif. Cells, Blood Substitutes, Biotechnol., 2010, 38, 230–249 CrossRef CAS PubMed.
- H. Cheng, A. Chawla, Y. Yang, Y. Li, J. Zhang, H. L. Jang and A. Khademhosseini, Drug discovery today, 2017, 22, 1336–1350 CrossRef CAS PubMed.
- C. Alvarez-Lorenzo and A. Concheiro, Chem. Commun., 2014, 50, 7743–7765 RSC.
- L.-T. Fan and S. K. Singh, Controlled Release: A Quantitative Treatment, Springer Science & Business Media, 2012, vol. 13 Search PubMed.
- P. Prasher, M. Sharma, H. Mudila, G. Gupta, A. K. Sharma, D. Kumar, H. A. Bakshi, P. Negi, D. N. Kapoor and D. K. Chellappan, et al. , Colloid Interface Sci. Commun., 2020, 35, 100244 CrossRef CAS.
- V. Percec, D. A. Wilson, P. Leowanawat, C. J. Wilson, A. D. Hughes, M. S. Kaucher, D. A. Hammer, D. H. Levine, A. J. Kim and F. S. Bates, et al. , Science, 2010, 328, 1009–1014 CrossRef CAS PubMed.
- C. T. Matea, T. Mocan, F. Tabaran, T. Pop, O. Mosteanu, C. Puia, C. Iancu and L. Mocan, Int. J. Nanomed., 2017, 5421–5431 CrossRef CAS PubMed.
- M. Qiu, W. X. Ren, T. Jeong, M. Won, G. Y. Park, D. K. Sang, L.-P. Liu, H. Zhang and J. S. Kim, Chem. Soc. Rev., 2018, 47, 5588–5601 RSC.
- D.-K. Ji, C. Ménard-Moyon and A. Bianco, Adv. Drug Delivery Rev., 2019, 138, 211–232 CrossRef CAS PubMed.
- J. Liu, L. Cui and D. Losic, Acta Biomater., 2013, 9, 9243–9257 CrossRef CAS PubMed.
- S. Song, H. Shen, Y. Wang, X. Chu, J. Xie, N. Zhou and J. Shen, Colloids Surf., B, 2020, 185, 110596 CrossRef CAS PubMed.
- I. V. Sukhorukova, I. Y. Zhitnyak, A. M. Kovalskii, A. T. Matveev, O. I. Lebedev, X. Li, N. A. Gloushankova, D. Golberg and D. V. Shtansky, ACS Appl. Mater. Interfaces, 2015, 7, 17217–17225 CrossRef CAS PubMed.
- W. Liang and X. Luo, J. Phys. Chem. C, 2020, 124, 8279–8287 CrossRef CAS.
- J. Shi, P. W. Kantoff, R. Wooster and O. C. Farokhzad, Nat. Rev. Cancer, 2017, 17, 20–37 CrossRef CAS PubMed.
- L. Peng, X. Mei, J. He, J. Xu, W. Zhang, R. Liang, M. Wei, D. G. Evans and X. Duan, Adv. Mater., 2018, 30, 1707389 CrossRef PubMed.
- Y. Wang, M. Qiu, M. Won, E. Jung, T. Fan, N. Xie, S.-G. Chi, H. Zhang and J. S. Kim, Coord. Chem. Rev., 2019, 400, 213041 CrossRef CAS.
- H. Zhang, T. Fan, W. Chen, Y. Li and B. Wang, Bioact. Mater., 2020, 5, 1071–1086 Search PubMed.
- S. Anju and P. Mohanan, Synth. Met., 2021, 271, 116610 CrossRef CAS.
- S. Zhu, L. Gong, J. Xie, Z. Gu and Y. Zhao, Small Methods, 2017, 1, 1700220 CrossRef.
- K. S. Hoque and A. Zubair, ACS Omega, 2022, 7, 36184–36194 CrossRef CAS PubMed.
- I. M. Ifti, M. M. Hasan, M. A. H. Arif and A. Zubair, 2020 11th International Conference on Electrical and Computer Engineering (ICECE), 2020, pp. 391–394 Search PubMed.
- A. Abbasi, A. Abdelrasoul and J. J. Sardroodi, Adsorption, 2019, 25, 1001–1017 CrossRef CAS.
- A. Abbasi and J. J. Sardroodi, Comput. Theor. Chem., 2017, 1114, 8–19 CrossRef CAS.
- A. Abbasi and J. J. Sardroodi, J. Nanostruct. Chem., 2016, 6, 309–327 CrossRef CAS.
- A. Abbasi and J. J. Sardroodi, Appl. Surf. Sci., 2019, 469, 781–791 CrossRef CAS.
- B. Mortazavi, M. Silani, E. V. Podryabinkin, T. Rabczuk, X. Zhuang and A. V. Shapeev, Adv. Mater., 2021, 33, 2102807 CrossRef CAS PubMed.
- H. Chen, T. Liu, Z. Su, L. Shang and G. Wei, Nanoscale Horiz., 2018, 3, 74–89 RSC.
- H. R. Ali, M. R. Ali, Y. Wu, S. A. Selim, H. F. Abdelaal, E. A. Nasr and M. A. El-Sayed, Bioconjugate Chem., 2016, 27, 2486–2492 CrossRef CAS PubMed.
- N. K. Jain, V. Mishra and N. K. Mehra, Expert Opin. Drug Delivery, 2013, 10, 353–367 CrossRef CAS PubMed.
- S. G. Utsha, S. M. T.-S. Afrid and A. Zubair, 2022 12th International Conference on Electrical and Computer Engineering (ICECE), 2022, pp. 168–171 Search PubMed.
- S. M. Ta-Seen Afrid, S. Goswami Utsha and A. Zubair, 2022 IEEE International Conference of Electron Devices Society Kolkata Chapter (EDKCON), 2022, pp. 319–324 Search PubMed.
- J. H. Appel, D. O. Li, J. D. Podlevsky, A. Debnath, A. A. Green, Q. H. Wang and J. Chae, ACS Biomater. Sci. Eng., 2016, 2, 361–367 CrossRef CAS PubMed.
- W. Z. Teo, E. L. K. Chng, Z. Sofer and M. Pumera, Chem. –A Euro. J., 2014, 20, 9627–9632 CrossRef CAS PubMed.
- E. Engel, Density Functional Theory, Springer, 2011 Search PubMed.
- S. Grimme, J. Antony, S. Ehrlich and H. Krieg, J. Chem. Phys., 2010, 132, 154104 CrossRef PubMed.
- R. L. Akkermans, N. A. Spenley and S. H. Robertson, Mol. Simul., 2013, 39, 1153–1164 CrossRef CAS.
- S. J. Clark, M. D. Segall, C. J. Pickard, P. J. Hasnip, M. I. Probert, K. Refson and M. C. Payne, Z. Kristallogr. Cryst. Mater., 2005, 220, 567–570 CrossRef CAS.
- B. Delley, J. Chem. Phys., 2000, 113, 7756–7764 CrossRef CAS.
- R. S. Mulliken, J. Chem. Phys., 1955, 23, 1833–1840 CrossRef CAS.
- P. Giannozzi, S. Baroni, N. Bonini, M. Calandra, R. Car, C. Cavazzoni, D. Ceresoli, G. L. Chiarotti, M. Cococcioni and I. Dabo, et al. , J. Phys.: Condens.Matter, 2009, 21, 395502 CrossRef PubMed.
- P. Giannozzi, O. Andreussi, T. Brumme, O. Bunau, M. B. Nardelli, M. Calandra, R. Car, C. Cavazzoni, D. Ceresoli and M. Cococcioni, et al. , J. Phys.: Condens.Matter, 2017, 29, 465901 CrossRef CAS PubMed.
- A. Togo and I. Tanaka, Scr. Mater., 2015, 108, 1–5 CrossRef CAS.
- B. Amin, T. P. Kaloni and U. Schwingenschlögl, RSC Adv., 2014, 4, 34561–34565 RSC.
- W. S. Yun, S. Han, S. C. Hong, I. G. Kim and J. Lee, Phys. Rev. B, 2012, 85, 033305 CrossRef.
- R. Chaurasiya, A. Dixit and R. Pandey, Superlattices Microstruct., 2018, 122, 268–279 CrossRef CAS.
- C. Ernandes, L. Khalil, H. Almabrouk, D. Pierucci, B. Zheng, J. Avila, P. Dudin, J. Chaste, F. Oehler and M. Pala, et al. , npj 2D Mater. Appl., 2021, 5, 7 CrossRef CAS.
- M. Yankowitz, D. McKenzie and B. J. LeRoy, Phys. Rev. Lett., 2015, 115, 136803 CrossRef PubMed.
- X. Li, J. F. Lovell, J. Yoon and X. Chen, Nat. Rev. Clin. Oncol., 2020, 17, 657–674 CrossRef PubMed.
- Y. Zhang, S. Zhang, Z. Zhang, L. Ji, J. Zhang, Q. Wang, T. Guo, S. Ni, R. Cai and X. Mu, et al. , Front. Chem., 2021, 9, 728066 CrossRef CAS PubMed.
- C. Zhang, D. Zhang, J. Liu, J. Wang, Y. Lu, J. Zheng, B. Li and L. Jia, J. Nanobiotechnol., 2019, 17, 1–15 CrossRef CAS PubMed.
Footnotes |
| † Electronic supplementary information (ESI) available. See DOI: https://doi.org/10.1039/d3na01095c |
| ‡ These authors contributed equally to calculations. |
| This journal is © The Royal Society of Chemistry 2024 |

