 Open Access Article
Influence of arylalkyl amines on the formation of hybrid CsPbBr3 nanocrystals via a modified LARP method†
Ernest
Ruby
a,
Hugo
Levy-Falk
 a,
Gaëlle
Trippé-Allard
a,
Frédéric
Fossard
a,
Gaëlle
Trippé-Allard
a,
Frédéric
Fossard
 b,
Maxime
Vallet
cd,
Nicolas
Guiblin
c,
Jean-Sébastien
Lauret
 a,
Emmanuelle
Deleporte
a and
Cédric R.
Mayer
 *a
*a
aUniversité Paris-Saclay, ENS Paris-Saclay, CentraleSupélec, CNRS, LuMIn (UMR 9024), Gif-sur-Yvette, France. E-mail: cedric.mayer@ens-paris-saclay.fr
bUniversité Paris-Saclay, ONERA, CNRS, Laboratoire d'étude des Microstructures, 92322, Châtillon, France
cUniversité Paris-Saclay, CentraleSupélec, CNRS, Laboratoire SPMS (UMR8580), 91190, Gif-sur-Yvette, France
dUniversité Paris-Saclay, ENS Paris-Saclay, CentraleSupélec, CNRS, LMPS – Laboratoire de Mécanique Paris-Saclay (UMR 9026), 91190, Gif-sur-Yvette, France
First published on 6th February 2024
Abstract
Perovskite nanocrystals have attracted much attention in the last ten years due to their different applications, especially in the photovoltaic domain and LED performance. In this large family of perovskite nanocrystals, CsPbBr3 nanocrystals are attractive nanomaterials because they are good candidates for obtaining green emissions and exploring new synthesis routes. In this context, controlling the nanometric scale's morphology, particularly the size and monodispersity, is fundamental for exploring their photophysical properties and final applications. Currently, the nanometric size of nanocrystals is ensured by the presence of oleic acid and oleylamine molecules, in using Hot Injection (HI) or ligand-assisted reprecipitation (LARP) methods. If oleic acid plays a fundamental role, oleylamine can be easily substituted by other amino molecules, opening the way for the functionalization of CsPbBr3 nanocrystals and the obtention of new hybrid perovskite nanocrystal families. In this article, we describe the synthesis, by soft chemistry, of a new family of hybrid organic–inorganic CsPbBr3 nanocrystals, functionalized by aryl-alkylamine (AAA) molecules, through the modified LARP method. We highlight the mechanism for cutting submicron crystals into nanocrystals, using aryl-alkylamine molecules like scissors. The impact of these amino molecules on the final nanocrystals leads to different nanocrystal morphologies (nanocubes, nanosheets, or nanorods) and structures (monoclinic, rhombohedral, or tetragonal). In addition, this modified LARP method highlights, under certain experimental conditions, an unexpected formation of PbO ribbons.
1 Introduction
Modern electronic devices, such as TVs, smartphones, and automotive screens, are increasingly oriented towards flexible supports, but inorganic semiconductors have reached a technological deadlock. Printed electronics appear to be a real alternative to solve this problem.1 A new class of nanoscale semiconductors, CsPbBr3 nanocrystals, has seen a real surge in interest because it addresses the emerging demands in optoelectronic devices, like flexible displays and organic photovoltaic systems. They can offer flexibility comparable to their all-organic counterparts while delivering performance on par with traditional inorganic semiconductors.2–4 CsPbBr3 is the most famous perovskite material,5 particularly studied under a nanometric scale for its optoelectronic properties.6–9 Nevertheless, the performance of an optimal optoelectronic flexible device requires the highest degree of uniformity in terms of nanocrystal size and shape in large-scale volumes. This homogeneous distribution is crucial to facilitate the self-assembly of these cubic nanocrystals within the active layer of optoelectronic devices. Another crucial point in a technological transfer concerns the synthesis conditions to produce these nanocrystals in large-scale volumes.Many teams are devoted to the synthesis of perovskite nanocrystals in different media or with different morphologies. Jasieniak and colleagues have reported the synthetic evolution of this class of semiconductors.10 Among these descriptions, the Hot Injection (HI) method described by Kovalenko's team, using oleic acid (OA), oleylamine (OAm), energetic conditions (with very high temperatures (140–200 °C)), and an inert atmosphere, leads to high monodispersity of CsPbBr3 nanocrystals in size and shape.11–13 Even though the HI method leads to highly calibrated nanocrystals, this method could limit a technological transfer for industrial production due to these specific conditions. An alternative way is a ligand-assisted precipitation (LARP) method. This method operates in an ambient atmosphere at room temperature.14 It consists of the precipitation of cation reagents Pb2+ and Cs+ (solubilized in a polar solvent) in an apolar solvent, leading to perovskite nanocrystals, with the help of OA and OAm, like the HI method. However, this method leads to nanocrystals with wide distributions in size and shape.15 Whatever the methods, several parameters impact the quality of the final nanocrystal solutions and their properties: the nature and molarity of amines,16,17 the ratio of Cs+ in regard to Pb2+ cations,18 the ratio of oleic acid,19–22 and the nature of polar and apolar solvents.23 Otherwise, whatever the type of inorganic nano-particles their organic functionalization is also an important point to stabilize them or to add complementary properties.24 Perovskite materials are no exception to the rule, with the use of different long-chain alkylamines,25 alkylammoniums,26,27 or alkyl or aryl carboxylic acids.28 However, with both previously cited methods (HI and LARP methods), the simple modification of one reagent can affect drastically the final nanocrystals (like the size, shape, or stability).29–31
Recently, our team reported a facile and original way to synthesize monodisperse CsPbBr3 nanocrystals in large proportion based on the modified-LARP (MLARP) method, using phenylethylamine (PEA) molecules.32 Our method showed that PEA acted as scissors to cut big CsPbBr3 nanocrystals into smaller high-calibrated nanocrystals. PEA is commonly used as a second amine with OAm to functionalize nanocrystals,33–35 for synthesizing 2D–3D perovskite film, and for solar cells and light-emitting devices.36–39 We highlighted the fundamental role of amino groups in this method. We demonstrated that PEA was the reagent responsible for cutting preformed particles into highly calibrated nanocrystals. In this protocol, similar optical properties of the nanocrystals in solution or drop-cast films on quartz substrates have been observed and it has been suggested that some homogeneous thin films of these nanoparticles could be made, without degrading the optical performances of the nanocrystals while keeping them stable.
MLARP opens a new way toward a large panel of hybrid organic–inorganic perovskite CsPbBr3 nanocrystals. So, since phenylethylamine (PEA) has proved to be a promising molecule for MLARP, other molecules of this family, such as aryl alkyl-amines (so-called AAA), have to be tested to generalize this new method. The AAA molecules open the way to the functionalization of perovskite nanocrystals and to organic conjugated molecules with optical or electronic properties.
This work extends the modified-LARP method (MLARP) to a large panel of aryl alkyl-amine (AAA) molecules with a general formula of R–Ph–R′–NH2. The main aim of this study is to understand the effect of the nature of AAA on the formation of CsPbBr3 nanocrystals. In this context, we highlight the influence of the length of the alkyl chain through R′, the steric hindrance of R, and the use of amino acids on the final nature of nanocrystals (form, size, and polydispersity). For a large part of them, this method allows reaching very high monodisperse nanocrystals under soft chemistry conditions, without the need for several centrifugation steps and high temperature. We show that the chemical structure of AAA molecules has a real impact on the morphology, stability, calibration, and performance of photoluminescence quantum yields (PLQYs) of these functionalized CsPbBr3 nanocrystals.
2 Results and discussion
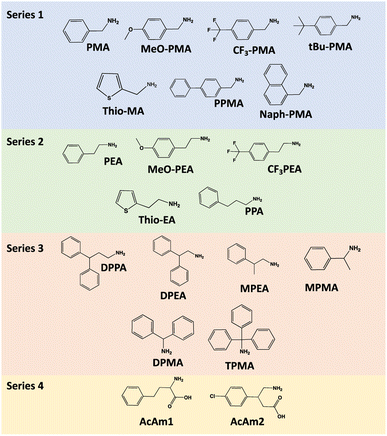
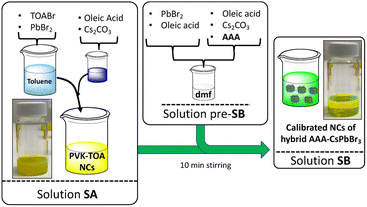
As stated in the introduction section, CsPbBr3 nanocrystals are highly promising semiconductors in the field of organic electronics, particularly in the field of printed electronics. Therefore, they are intended to be associated with organic matrices that are also semiconductors. Thus, the functionalization of NCs with AAA is crucial for a potential good interaction between the nanocrystal and its organic matrix. However, the use of direct arylamines (such as aniline and its derivatives) leads to the complete degradation of the initial CsPbBr3 nanocrystals. Therefore, the addition of an alkyl group is necessary. On the other hand, it was interesting to evaluate the impact of chain length on the formation of nanocrystals. Regarding the aromatic part, we are interested in evaluating the influence of electron-donating groups, polyaromatic systems, and groups exhibiting steric hindrance, to fully investigate a large panel of AAA. We have shared this study in four series to cover a large panel of AAA (R–Ph–R′–NH2). We have focused our attention on three alkyl linkers (methylene –CH2–, ethylene –C2H4– and propylene –C3H6– groups), with different R–Ph groups (particularly with methylene and ethylene linkers). We have also studied two amino acids, AmAc1 and AmAc2, to control the influence of the carboxylate group close to the amine function (Scheme 1) because this organic function can also functionalize perovskite surfaces. Series 1 is dedicated to methylene linkers, series 2 to ethylene and propylene linkers, series 3 to molecules with steric hindrance, and the last series to two amino acids (Scheme 1).The synthesis method is similar to our previous work.32 However, the ratio of AAA/Pb2+ has been optimized following the nature of AAA to get better stability and calibration of the functionalized nanocrystals. This ratio ranges between 0.4 and 1 (see Table SI-1†). To recall this process, the synthesis method is illustrated in Scheme 2.
Afterward, to clarify the text, as all perovskites are based on CsPbBr3, we will call the CsPbBr3 nanocrystals obtained after cutting by AAA, AAA-NCs. So, AAA-NCs will stand for CsPbBr3 nanocrystals functionalized by the AAA molecule (Scheme 2).
2.1 Evidence of the functionalization of nanocrystals by AAA
The aim of this study is to highlight the functionalization of perovskite nanocrystals by organic molecules. To do this, we used two markers, one containing a –CF3 group to detect the presence of fluorine atoms, and the second one, a baclofen molecule, which contains a chlorine atom. CF3–PEA has been used to check the presence of AAA on the nanocrystal surface and the functionalization of nanocrystals by the AAA molecules. By EDS in HAADF-STEM, fluoride atoms (Fig. 1d) are detected with a similar level and at the same place as nanocrystals (Fig. 1b) or other elements, Pb (Fig. 1c), Cs (Fig. 1f) and Br (Fig. 1e) atoms, confirming the passivation of nanocrystals by AAA (Fig. 1).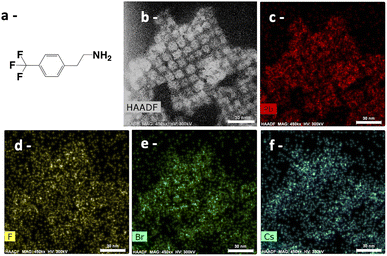 | ||
| Fig. 1 HAADF-STEM analysis of CF3PEA-NCs (scale bar: 30 nm): (a) scheme of the molecule; (b) in HAADF and by EDS to visualize (c) Pb element; (d) F element; (e) Br element; and (f) Cs element. | ||
A similar result has been obtained with baclofen, AmAc2-NCs: EDS analysis (Fig. SI-40†) highlights the presence of chlorine atoms on the surface of nanocrystals, in parallel with the detection of lead, cesium, and bromine atoms (Fig. SI-40†), indicating the presence of AmAc2 on the nanocrystal surface.
2.2 Influence of AAA molecules on the nature, morphology, and ordering of nanocrystals
The influence of AAA molecules on the nature and morphology of nanocrystals has been analyzed with the same protocol. For each series of samples, the AAA-NCs were analyzed by optical spectroscopy and in addition, we simultaneously prepared a film on a glass substrate and a TEM grid. The films are obtained by drying a drop of solution (∼200 µL) at room temperature and are used for X-ray diffraction characterization. The TEM grids are prepared by dropping a small amount of solution (∼1 µL) on the copper grid and then sucking the solvent with absorbent paper. This process limits the concentration of nanocrystals on the copper grid. All samples were compared with the PVK-TOA nanocrystals (starting with the larger CsPbBr3 nanocrystals) used to prepare them, for reference purposes. Using this protocol, a correspondence can be applied between the optical spectroscopy, TEM, and XRD analysis for each sample.The sizes of the corresponding nanocrystals have been analyzed by TEM on more than 2000 nanocrystals (up to 3900) for each one, yielding an average size of approximately 10.3 nm ± 3.7 nm (Table 1) for PMA-NCs, tBuPMA-NCs, MeOPMA-NCs, and CF3PMA-NCs and a narrow size distribution of nanocrystals around 12 nm ± 3.4 nm for NaphPMA-NCs, PPMA-NCs, and ThioMA-NCs as shown in Table 1 (Table SI-3†). For PMA-NCs, tBuPMA-NCs, and MeOPMA-NCs solutions, their stability remains for over two weeks (without flocculation or aggregation of nanocrystals). For ThioMA-NCs, PPMA-NCs, NaphPMA-NCs, and CF3PMA-NCs, the solutions become orange in a few days (Table 1) and a precipitate is observed. This difference in stability is certainly due to the formation of nanocrystal aggregates as those observed by TEM.
| Samples-NCs | λ (em) | FWMH (nm) | QY | τ (ampl) | Stabilityb | Shapec | Average size (nm) |
|---|---|---|---|---|---|---|---|
| a Measured after the synthesis. b +++: very stable for several weeks, ++: stable for one week, +: stable for 1–2 days, —: unstable. c NCs: nanocubes, NRs: nanorods, NWs: nanowires, PD: polydisperse. d nd: undetermined. | |||||||
| PVK TOA | 517 | 18 | 11% | 11.05 | + | PD | 38 |
| PMA | 516.5 | 18 | 64% | 17.25 | +++ | NCs | 11.83 |
| MeO–PMA | 516.5 | 18 | 78% | 18.15 | +++ | NCs | 9.91 |
| TBu–PMA | 516 | 18 | 81% | 18.52 | +++ | NCs | 12.4 |
| CF3–PMA | 516 | 18 | 56% | 22.3 | + | NCs | 9.4 |
| Thio–MA | 515 | 18 | 42% | 12.64 | + | NCs | 13.2 |
| 4-PPMA | 517 | 18 | 59% | 14.53 | ++ | NCs | 9.74 |
| Naph–PMA | 518 | 18 | 62% | 17.4 | ++ | NCs | 11 |
| PEA | 516 | 18 | 61% | 13.96 | +++ | NCs | 10.1 |
| CF3–PEA | 516.5 | 18 | 70% | 12.94 | ++ | NCs | 13.7 |
| MeO–PEA | 516 | 18 | 70% | 16.55 | +++ | NCs | 9.87 |
| Thio–EA | 516 | 18 | 55% | 17.32 | + | NCs | ndd |
| PPA | 516 | 18 | 80% | 14.5 | +++ | NCs | 8.14 |
| MPMA | 521 | >19 | 41% | 17.53 | + | NCs | 14.02 |
| MPEA | 516 | 18 | 64% | 16.91 | ++ | NCs | 11.04 |
| DPEA | 518 | 18 | 45% | 22.36 | + | NRs | 17.4 |
| DPPA | 515 | 18 | 71% | 17.4 | ++ | NCs | 11.9 |
| TPMA | 522 | >19 | 5% | nd | — | nd | nd |
| DPMA | 521 | >19 | 8% | nd | — | nd | nd |
| AA2 | 519 | >19 | 40% | 24.89 | — | PD | 11.7 |
| AA1 | 520 | >19 | 19% | 37.8 | — | NWs | nd |
TEM analyses also highlight with PMA-NCs (Fig. 2a), tBuPMA-NCs (Fig. 2b), and MeOPMA-NCs (Fig. 2c) some crystals' ordered arrangement in a 2D superlattice on the copper grid.
 | ||
| Fig. 2 TEM (200 kV) images (scale bar: 200 nm) of (a) PMA-NCs; (b) tBuPMA-NCs; (c) MeOPMA-NCs; (d) NaphPMA-NCs; and (e) ThioMA-NCs. | ||
With NaphPMA-NCs (Fig. 2d), PPMA-NCs (Fig. SI-7†), and ThioMA-NCs (Fig. 2e), some 3D-assemblies, like super-crystal structures (Scheme 3), are observed on the copper grid.40–42
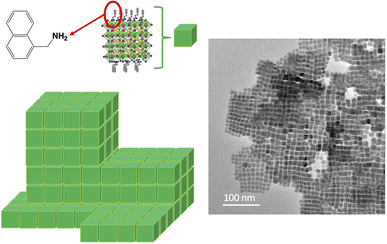 | ||
| Scheme 3 Schematic representation of the starting 3D-superlattice of Naph–PMA nanocrystals and the corresponding TEM pictures. | ||
This ordering leads to the formation of columns of highly calibrated nanocrystals, like a stack of Lego® bricks (Scheme 3).
With CF3PMA-NCs and with a diluted drop, linear arrangements of nanocrystals are observed (Fig. 3). The other AAA-NCs do not show this type of linear arrangement under similar conditions of observation and drop dilution.
This series, based on methylene as a linker, shows that the MLARP synthesis is efficient in obtaining highly calibrated nanocrystals with an apparent cubic form. The impact of the functional group of the molecule plays a role in the stability of the solution. When the functional group is a heterocycle like a thiophene or an extended aromatic group like the 4-phenylbenzylamine (PPMA) or the naphthalene group, these groups promote aggregation of NCs certainly due to the nature of the aromatic group leading to some kinds of π-stacking interactions between nanocrystals and also the size of NCs being slightly larger.
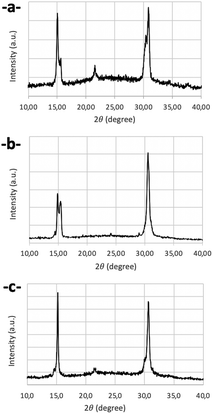
Concerning XRD analysis and optical studies, all samples have been analyzed under the same conditions, at the same delay after synthesis, and from the same initial PVK-TOA nanocrystals. About XRD analysis, the LARP method generally generates nanocrystals with a monoclinic structure,43–45 as is the case for our starting PVK-TOA nanocrystals (from SA solution), analyzed previously.32 Several AAA-nanocrystals, drop-cast films onto a glass slide, present XRD patterns indexed to the monoclinic structure, with the same indexation lines ((010), (100), (110), (020) and (200), reference PDF#18-0364), tBuPMA-NCs (Fig. 4a), MeOPMA-NCs (Fig. 4b), and PhPMA-NCs (Fig. 4c). So, these patterns look similar to PVK structures obtained by J. J. Jasieniak et al. with PVKs so-called TOL-LARP (toluene-LARP) or EA-LARP (ethyl acetate-LARP).43,44 But, in the literature, other synthesis methods of CsPbBr3 nanocrystal structures can also be indexed to an orthorhombic structure.13,46,47 Nevertheless, it can be difficult to distinguish both structures due to the close indexation of different peaks, particularly when the lines are not well-defined. Thus, for CF3PMA-NCs, the pattern is closer to an orthorhombic structure, with the same indexation lines ((002), (110), (004), and (220), reference PDF#97851). This conversion of structure, from monoclinic to orthorhombic, is certainly due to the action of these AAA molecules on the nanocrystal surface, which induces some crystallographic constraints and structural modifications.48 We can observe for PMA-NCs and MeOPMA-NCs that there are two small additional lines at 12.72° and 25.54° ((102) and (204) planes respectively), due to the presence of Cs4PbBr6 structures on glass plates (PDF#73-2478).45,49–53 This structure has not been observed during the TEM analysis. This secondary structure appears during the sample XRD preparation and more particularly during the evaporation of the solvent, which induced a transformation of the CsPbBr3 nanocrystal (detailed in Section 2.4).
Concerning optical studies, all the nanocrystals exhibit green emission peaks centered around 516 nm (EPLmax = 2.41 eV, Fig. SI-3†) with a narrow full width at half maximum (FWHM <18 nm). This result reflects the good monodispersity of the nanocrystals. Another impact of organic molecules on nanocrystals is their PL quantum yield (PLQY, Tables SI-2† and 1). For this series, we obtained a very high PLQY of around 80% for tBuPMA-NCs, 78% for MeOPMA-NCs, and for the others around 60%, except for ThioMA-NCs (only 45%). This lower value aligns with the limited stability of the solution, suggesting the presence of aggregates already present in the solution.
Regarding the calibration of nanocrystals, CF3PEA-NCs (Fig. SI-20†) and MeOPEA-NCs are highly calibrated with a narrow size of 11 nm ± 2.6 nm and stable (unaggregated) over 7 days (Fig. SI-23†). ThioEA-NCs (Fig. 5) have a particular behavior. ThioEA-NCs are also well calibrated but these nanocrystals appear by TEM, on a copper grid, like an aggregated porous network and the solution becomes orange after a few hours, to finally fully precipitate after a couple of days. In this particular case, the linker between the thiophene moiety and the amino group plays a role in the state of nanocrystal assemblies on a copper grid. The –CH2– (methylene linker group between aryl part and –NH2 function) group forces the aromatic part to be almost parallel to the nanocrystal surface, leading to some well 3D assembly. On the other hand, with an ethylenic group, the ethylene part gives more flexibility to aromatic moieties, and the groups can be more disordered on the surface and induce a disorder in the assembly, leading to a porous network.
In addition, PPA has been tested to study the influence of complementary –CH2– compared to the ethylene group. TEM analysis shows a good calibration of nanocrystals with a smaller size distribution centered at 8 nm ± 4.1 nm (on 1553 nanocrystals) (Fig. SI-26†). The solution of PPA-NCs is very stable for several weeks.
XRD analysis, like with the first series, depending on the AAA molecules, shows monoclinic (PEA and PPA) and orthorhombic structures (MeOPEA-NCs, ThioEA-NCs, and CF3PEA-NCs).
In photoluminescence, when the solutions are observed just after the synthesis, the nanocrystals exhibit green emission peaks centered around 516 nm (EPLmax = 2.41 eV, Fig. SI-5†) with narrow full width at half maximum (FWHM ≈18 nm), even for ThioEA-NCs. For this last one, this result shows that nanocrystals are well-calibrated. However, for ThioEA-NCs, the emission decreases after a few hours with the aggregation of NCs in the solution.
About PLQY, the minor modifications to the synthesis compared with our previous work have allowed us to achieve better stability and calibration of nanocrystals, and consequently a higher PLQY, with PEA-NCs (61%) and a great value with PPA-NCs (80%). For MeOPEA-NCs and CF3PEA-NCs, the same PLQY value is obtained (70%). Similar to ThioMA-NCs, ThioEA-NCs also exhibit a lower value, at 55%, certainly due to the presence of smaller aggregates in the solution (Tables 1 and SI-2†).
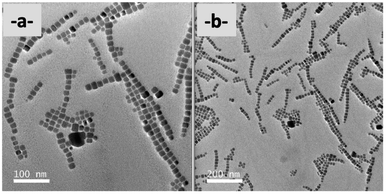
For DPPA-NCs, DPEA-NCs, MPEA-NCs, and MPMA-NCs, the solutions are stable for only a couple of days. The solutions became yellow-orange to orange and precipitated after seven days. However interesting results appear concerning the shape of the nanocrystals. A noticeable difference between the first four MPMA, MPEA, DPEA, and DPPA nanocrystals can be observed in TEM. MPEA (Fig. SI-28†) and DPPA (Fig. SI-34†) are very highly calibrated nanocrystals, but smaller with MPEA (8.9 nm ± 3.8 nm over 1559 particles, Fig. SI-29†) compared to DPPA (11.9 nm ± 3.5 nm over 2000 particles, Fig. SI-35).† With the MPMA molecule (Fig. SI-37),† the nanocrystals tend towards a higher calibration but the cutting process is not completed. The most surprising result concerns nanocrystals based on DPEA that exhibit two types of nanostructures coexisting in the solution: long rods, having a size of around 200 nm by 10 nm, stacked following their lengths (Fig. 6a) (both in Fig. SI-31†) presenting a certain polydispersity in length, and small nanorods, of size 20 × 10 nm, that are well-calibrated (Fig. 6b). The growing axe direction is along the (100) superlattice for both types of nanorods.54–56
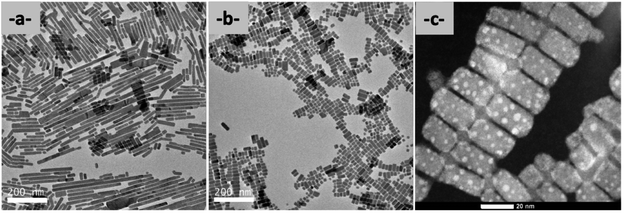 | ||
| Fig. 6 TEM analysis of DPEA-NCs (a) by TEM (200 kV, scale bar 200 nm) of long rods; (b) by TEM (200 kV, scale bar 200 nm) of small rods, and (c) by HAADF-STEM of these small rods (scale bar 20 nm). | ||
The nanorods are linked together on the side corresponding to the (010) plane. We observe also long rods, particularly along the (010) planes. However, they are not well-calibrated in form, with unregular growth (Fig. 7c). Using HAADF-STEM these nanorods are assembled like bunches of grapes (Fig. 8c). It's the same for long nanorods, linked together following their length by undefined structures (Fig. SI-31c and d†). So, the action of DPEA molecules leads to unexpected results in the final structures and highlights the role of organic molecules during this MLARP process.57–59 This particularity is certainly due to the geometry of the DPEA molecules and its specific hindrance that induces a preferential surface affinity for nanocrystals leading to the formation of rods. The exact driving force behind the formation of nanowires is the partial steric hindrance of the two biphenyl groups close to the nanoparticle surface and an affinity of this molecule to attack a preferential face of the starting nanocrystal that induces the formation of the nanorods. Indeed, we see that with DPPA, which contains an additional methylene group (propyl group DPPA molecule) between the biphenyl part and the amine, the nanocrystals are cubic type like the others, while with one methylene group (methyl group, DPMA molecule), there is no cutting of the starting nanocrystals and the solution is totally unstable.
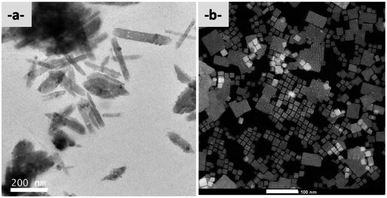 | ||
| Fig. 7 (a) TEM (200 kV) pictures of AcAm1 (scale bar 200 nm) and (b) HRSTEM in HAADF of AcAm2 nanocrystals (scale bar 100 nm). | ||
The second time, the hindrance around the amino group is increased with the two last TPMA and DPMA molecules. In both molecules, the amino function is hindered without being directly linked to the aromatic group. In both cases, when the pre-SB solution containing TPMA and DPMA molecules is dropped into SA solution, the SB solution is first yellow transparent, turns orange after a few seconds, then turbid in a few minutes before precipitation occurs after a few hours. TEM copper grids have been prepared during the first few minutes of the reactions. For DPMA (Fig. SI-36†), we observe the formation of nanorods but they are larger than those observed with DPEA, along with some unchanged PVK-TOA nanocrystals. For TPMA (Fig. SI-37†), the nanocrystals remained unchanged from the starting solution. So, with these two molecules, we reach the limit of our process in terms of the nature of AAA molecules. The steric hindrance around the amine function has a negative impact and with higher hindrance like with TPMA molecules, the starting PVK-TOA-NCs remain unchanged and no cutting process is detectable.
In XRD analysis, all nanocrystals obtained with this series exhibit monoclinic structures (Fig. SI-27† for MPMA-NCs, SI-28 for MPEA, SI-30 for DPEA-NCs, SI-34 for DPPA-NCs, SI-36 for DPMA and SI-37† for TPMA). Concerning the photoluminescence studies, DPMA, TPMA, and MPMA (Fig. SI-4†) show a slight red shift to 522 nm and a large FWMH (FWHM >19 nm), due to the presence of aggregates and the lack of stability in solution. The presence of these aggregates is also confirmed with the measurement of PLQY. TPMA-NCs and DPMA-NCs have the worst values, at 5% and 8% respectively, whereas MPMA-NCs and DPEA-NCs show values of 41% and 45%, respectively. On the other hand, the DPPA-NCs and MPEA-NCs, their more stable solutions just after the synthesis, exhibit good PLQY values of 70% and 64%, respectively.
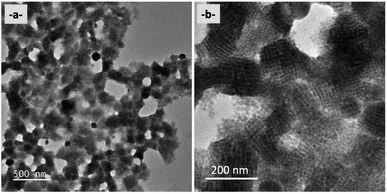
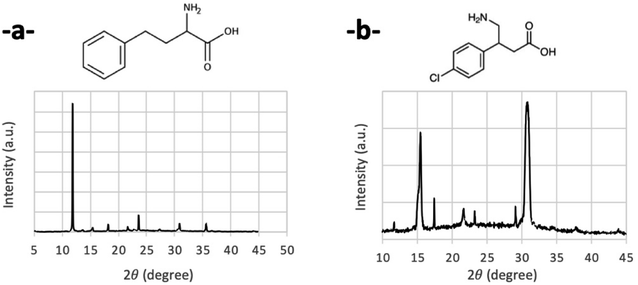
When pre-SB contains AmAc1, TEM observations show for the final SA solution a modification of the starting materials with the formation of nanosheet structures similar to the tetragonal phase of CsPb2Br5 nanosheets (Fig. 7a).60,61 When AmAc2 is used, TEM observation highlights the cutting of PVK-TOA as for other AAA molecules. But, in HAADF-STEM, we showed areas still in the slicing process (Fig. 7b), with larger original nanocrystals not completely cut.
For AmAc1-NCs, the XRD pattern exhibits the tetragonal phase structure of CsPb2Br5 nanosheets (Fig. 8a), with the main line at 11.72° and secondary line at 23.48° (respectively (002) and (210) planes, reference PDF#25-0211),45,50,60,62–64 while AmAc2-NCs exhibit an orthorhombic structure (Fig. 8b).
Regarding the photoluminescence studies, like the previous series a similar redshift is observed, 517 nm for AmAc2-NCs (FWHM ≈18 nm) and 519 nm for AmAc1-NCs (FWHM >19 nm). PLQYs are in agreement with these values, with a poor value for AmAc1-NCs, only 19%, and 40% for AmAc2-NCs. For AmAc1-NCs, this result is certainly due to the modification of the morphology of the nanocrystals to yield pallet structures and its lower stability and the aggregation of these pallets in solution. We could expect a better result with AmAc2-NCs because we obtained apparent nanocubes like other nanocrystals and also a better functionalization of the surface with a –COOH and –NH2 group. However, this low value reflects probably the presence of aggregates in the solution, as well as poor nanocrystal cutting as observed in HAADF-STEM.
Thus, the proximity of the –COOH group to the NH2 function in AmAc1-NCs has a real impact on the topology of the final nanocrystals. This result is certainly caused by a better complexation of the AmAc1 molecule with the lead(II) cation, compared to the AmAc2 molecule, leading to a complete structural modification of the final nanocrystals. For the AmAc2 molecule, this complexation appears to be inoperative, and unlike other AAAs, the presence of the –COOH group seems to be a disadvantage for the cutting process. But, in both cases, in contrast to previous methods reported in the literature which employed the hot injection method with amino acids, resulting in nanocrystals with excellent stability and high PLQY values, we emphasize here that neither of the AmAc molecules used in our study is suitable for the MLARP process.65,66
2.3 Highlighting the PbO structure and Pb° nanoparticles during the MLARP process
TEM observations show, for a large number of samples, the formation of Pb° nanoparticles (Pb°-NPs) onto the surface of the nanocrystal. They are commonly observed in the literature for CsPbBr3 nanocrystals. Several contradictory explanations have been given for the presence of these Pb° NPs, in particular their formation during the TEM observation with the electronic beam.67,68 In our case, with our STEM, a contrary observation has been observed: the disappearance of Pb° NPs with an electronic beam (see Fig. SI-41†). Recently, Lee and colleagues reported an interesting explanation for the presence of lead nanoparticles during the synthesis of perovskites.69 For them, the defects in the surface and core within CsPbBr3 nanocrystals can distort the perovskite structure, resulting in the intrinsic instability of perovskite nanocrystals. The defects carry a small negative or positive charge, which induces the oxidation (forming PbO2) or reduction (forming Pb°) of oppositely charge atoms due to charge neutrality under ambient conditions.70 The oxidation and reduction reactions predominantly occur in the surface and core regions of the perovskite nanocrystals, respectively.In our case, we observe the presence of Pb° NPs on the nanocrystal's surfaces (Fig. 9a), but in some cases, we observe also the presence of PbO ribbons (Fig. 9b). We can attest to their presence by the perfect matching between our ribbons and the crystal structure of PbO (Fig. SI-42 and SI-43†).71 As previously described, the reduction of Pb2+ within CsPbBr3-NCs in Pb° nanoparticles is due to halide vacancies acting as electron traps, which can facilitate their reduction.49 In our study, this reduction process and the formation of PbO structures under ribbon form are visible after the cutting process and not every time.
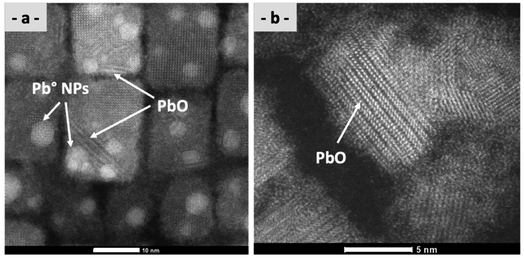 | ||
| Fig. 9 HAADF-STEM analysis of DPPA to highlight (a) Pb°-NP and PbO nanoribbon structures (scale bar 10 nm) and (b) assembly of PbO nanoribbon structures (scale bar 5 nm). | ||
These PbO structures are certainly due to the liberation of the Pb2+ cation in solution during the cutting process and the presence of oxygen in solution. These structures had not previously been described in the literature, since synthesis took place in a glovebox without the presence of dioxygen. Interestingly, the reduction phenomena are limited when the nanocrystals are very well calibrated, particularly with AAA having a methylene group instead of an ethylene group-like linker between the amine function and the phenyl group. So, it seems that the formation of Pb°-NPs and PbO ribbons is dependent on the reactivity of AAAs with the starting nanocrystals (PVK TOA). If the reactivity is very efficient, their formation is reduced, but if the reactivity of AAA is less efficient, combined with the synthesis conditions, the formation of Pb°-NPs and PbO ribbons is more visible. This hypothesis is corroborated by our TEM observations and at the experimental level with the samples giving very stable and non-aggregated nanocrystals such as tBuPMA-NCs, MeOPMA-NCs, or PMA-NCs.
Hence, our procedure can be carried out under standard temperature conditions without the need for a glovebox, but enhancements can be achieved by using a high-quality anhydrous solvent to avoid the presence of PbO structures. However, even these PbO ribbons are not expected; to our knowledge, such nanostructures have not been described in the literature.
2.4 Impact of the AAA/Pb2+ ratio in solution and on glass plates
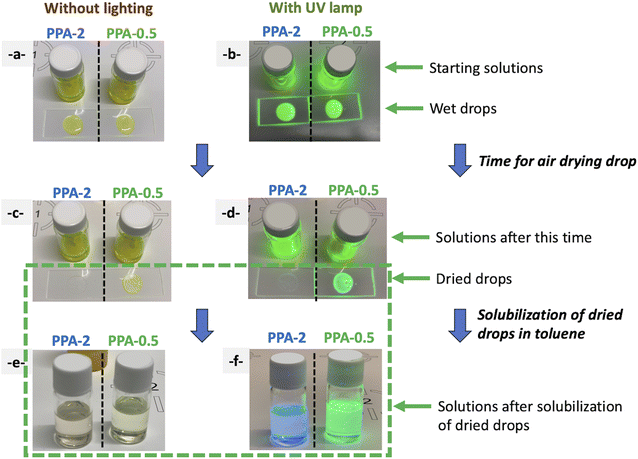
For a couple of samples, under similar synthesis conditions, we observed that during the preparation of the XRD sample and the drying process on the glass plate, the drop became colorless and not emissive. On the other hand, this was the case with all AAA molecules when AAA was added with a ratio of AAA/Pb2+ greater than 1. So, following these observations and to analyze the effect of the AAA/Pb2+ ratio on the final nanocrystals, we used PPA molecules as a probe to understand the influence of AAA molecules on this MLARP process.Two sets of PPA–SB solutions have been prepared, one with a ratio of PPA/Pb2+ = 2 (PPA-2) and a second at 0.5 (sample PPA-0.5). Both yellow solutions have a similar appearance and present a green emission under UV light (Fig. 11a and b). Then both solutions are dropped on two different glass plates. The two drops from PPA-2-NCs and PPA-0.5-NCs solutions present a green emission under UV light before their drying (Fig. 10a and b).
Although both solutions remain unchanged during the drying time of both drops with a green emission for both of them, the dried drop from sample PPA-2-NCs is colorless (with a slight blue emission) while the dried drop sample from PPA-0.5-NCs remains yellow with a green emission (Fig. 10c and d).
Then, the two residues from the PPA-2-NCs dried drop and the PPA-0.5-NCs dried drop are re-solubilized in toluene. The resulting solution presents a blue emission for sample PPA-2-NCs while PPA-0.5-NCs exhibit a green emission (Fig. 10f).
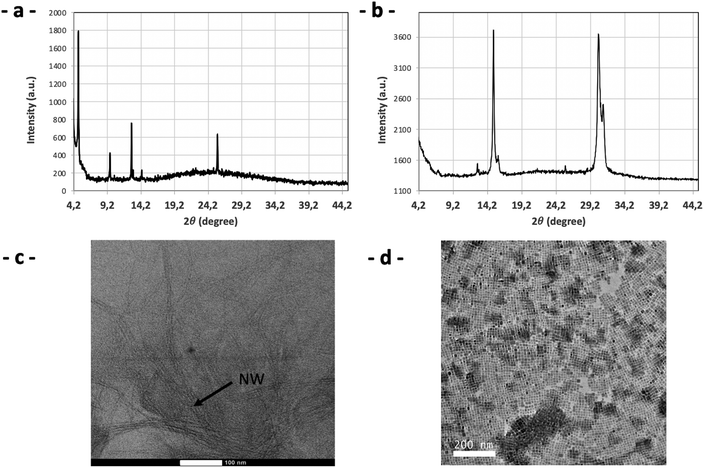
The XRD analysis for PPA-2-NCs (dry sample, PPA/Pb2+ = 2) could be assimilated to nanowire structures like RP structures with a main line at 4.83° (Fig. 11a). This result is corroborated in TEM with the presence of nanowires (Fig. 11c). These two analyses are in agreement with nanowire structures already observed previously by Kostopoulou et al. and look like hair.72
For PPA-0.5-NCs (ratio of PPA/Pb2+ = 0.5), XRD analysis (Fig. 11b) and TEM (Fig. 11d) are in agreement with previous PPA-nanocrystals. So, for a lower ratio of PPA/Pb2+ ≈0.5, the drying of the drop doesn't induce structural modification of nanocrystals. A higher ratio modifies drastically the structure of nanocrystals during the drying of the drop. The cutting process by PPA molecules continues to act during drying, due to the excess of PPA molecules and its increasing concentration in the final drop.
The formation of these nanowires has also been observed with a higher ratio of AAA/Pb2+ (≥2). For example, with a ratio of PEA/Pb2+ = 4, similar nanowires have been observed by HAADF-STEM (Fig. 12a). As another example, with DPPA-NCs, by HAADF-STEM, for a ratio of DPPA/Pb2+ = 2, undefined nanocrystals without Cs+ cations (scale bar = 5 nm) with Pb° nanoparticles are observed (Fig. 12b). These last undefined structures with cubic like appearance seem to be intermediate structures between the well-defined nanocrystals of CsPbBr3 and the ultimate broken structure, the nanowires.
Through EDS, we can observe that this type of structure is composed solely of lead and bromine atoms and contains very few cesium cations (Fig. 13).
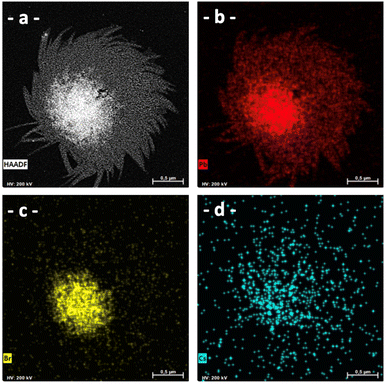 | ||
| Fig. 13 HAADF-STEM analysis of PEA (ratio of PEA/Pb2+ = 4) (a) in HAADF and by EDS to visualize (b) Pb element; (c) Br element; and (d) Cs element. | ||
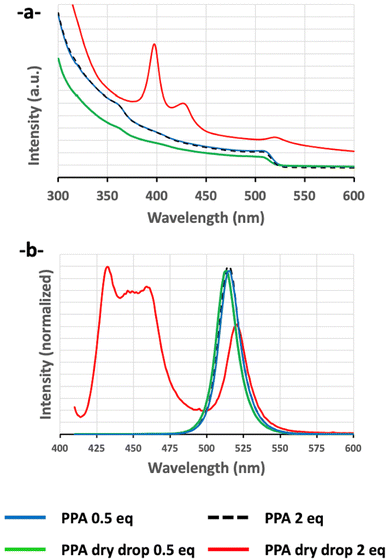
These results are confirmed by optical spectroscopy. The absorption and the emission bands of PPA-0.5-NCs (ratio of PPA/Pb2+ = 0.5) are similar before and after drying (Fig. 14). This result confirms a structural conservation of nanocrystals during the drying process. Meanwhile, for PPA-2-NCs (ratio of PPA/Pb2+ = 2), the optical results drastically changed before and after the drying process. Indeed, before the drying process, PPA-2-NCs (ratio of PPA/Pb2+ = 2) present an absorption and emission similar to PPA-0.5-NCs (ratio of PPA/Pb2+ = 0.5). However, after drying, the absorption band confirms the structural modification of nanocrystals in different structures, with an absorption band characteristic of Ruddlesden–Popper structures (n = 2, 400 nm, and n = 3, 430 nm) and CsPbBr3 nanocrystals (Fig. 14). The emission bands reflect the absorption spectroscopy, with two emission zones, one between 420 and 460 nm73–75 (for RP structures) and one at 520 nm (for CsPbBr3 nanocrystals) (Fig. 14).
Thus, a weaker ratio (ratio of PPA/Pb2+ = 0.5) avoids an alteration of nanocrystals during the drying process while a stronger ratio (ratio of PPA/Pb2+ = 2) induces a structural modification of the nanocrystals. So, with an excess of AAA, the previous PVK-TOA-NCs are cut in nanocrystals first and the process is extended to the formation of RP structures, until the final degradation of nanocrystals, during this drying process, helped by the increase of AAA molecule concentration.
In conclusion, the ratio of AAA/Pb2+ has to be controlled to ensure a good cutting of previous PVK-TOA-NCs in solution, without affecting these final nanocrystals during their drying for their observations by XRD analysis. However, even if we have seen for PPA-NCs a ratio close to 0.5 is enough for a good cutting, for others AAA molecules, this ratio could be not sufficient to get it. Thus, the compromising ratio between 0.5 and 1, depending on AAA molecules, is adequate. Beyond this ratio, the cutting process continues to occur and can take place either directly in the solution or during the solution drying (as for XRD analyses), where the amine concentration increases and this cutting process continues.
2.5 Effect of AAA molecules on the mechanism occurring within the MLARP process
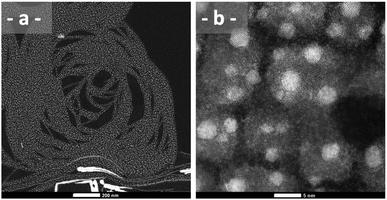
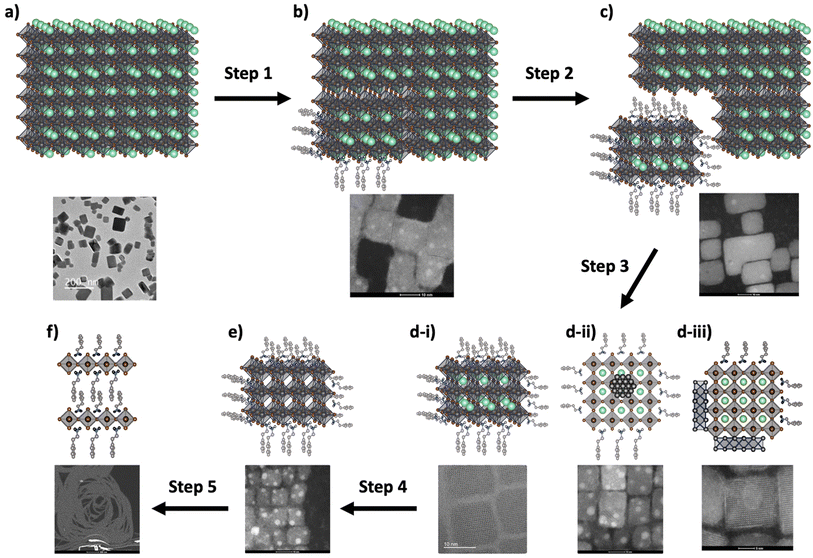
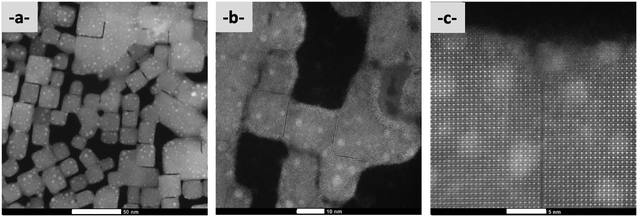
The effect of AAA molecules on the mechanism occurring within the MLARP process has been followed by HR-STEM and by experimental compilation of all TEM results. This study shows that AAA plays a fundamental role in the breakdown of PVK-TOA-NCs, as depicted in Schemes 4a and b. This modification is due to AAA's coordination with lead(II) surface cations, resulting in the production of smaller and highly calibrated nanocrystals, as shown in Schemes 4(b)–(d-i).Fig. 15 depicts the initial moments of the organic molecule cutting of the starting PVK-TOA-NCs, with the observation of the cutting zones. The side of the crystals is also less well-structurally defined, showing a kind of cloud of lightweight atoms such as carbon, indicating the presence of organic matter. However, it is important to note that during this process, certainly due to the inherent characteristics of the nanocrystal surface defects, some additional structures appear in the solution, including Pb° nanoparticles (Scheme 4d-ii) and PbO ribbon structures (Scheme 4d-iii). Moreover, this process can continue to progress with an excess of AAA, ultimately leading to the formation of a cubic structure devoid of Cs+ cations, as illustrated in Scheme 4e. Finally, under these conditions, nanowires composed of lead resembling RP structures are observed, as shown in Scheme 4f.
The action of AAA molecules does not only limit the cutting of the initial nanocrystals but also influences their nature, their stability in solution, and their tendencies to aggregate. Thus, even if most of the AAA molecules tend to form highly calibrated cubic nanocrystals, some rods can be designed depending on the hindrance of AAA molecules, with DPEA or some nanosheets like with AmAc1. But if this hindrance is too much this process doesn't occur, as with TPMA and DPMA molecules. Independently of the calibration of the final nanocrystals, the nature and particularly the topology of the molecule play a fundamental role in their stability in solution.
3 Conclusion
Recently, based on the modified LARP method, we have designed high-calibrated nanocrystals of CsPbBr3 by soft chemistry, in an easy process, with the help of phenylethylamine (PEA) molecules. Similarly to hybrid 2D-perovskites,78 and to perovskite films79 in which the organic molecules can play a great role in the chemical structures and the optical properties of these hybrid materials, the study of the influence of organic molecules on the functionalization of CsPbBr3 nanocrystals by AAA molecules was interesting to investigate for potential uses in OLEDs or photovoltaic devices.To our knowledge, only a few AAA molecules have been studied but by HI method, like PEA or recently DPPA.80 In this paper, we have investigated a large topology of these AAA molecules by this new modified LARP method, that occurs by soft chemistry.
We highlight a specific mechanism for cutting submicron crystals into nanocrystals. Thanks to HAADF-STEM and optical spectroscopy, we have followed this mechanism during this new MLARP process for all types of aryl-alkylamine molecules. The different steps of this mechanism have been proposed. It has been shown that this process can be controlled by the amine concentration. A ratio between 0.5 and 1, dependent on AAA, is a good compromise to get stable nanocrystals and analyze them without damage. Ultimately, with a higher ratio (AAA/Pb2+ >1), helped with a higher concentration, the complete degradation of the initial submicron crystals in a structure similar to Ruddlesden–Popper structures can be achieved.
We have shown the presence of AAA molecules on the nanocrystal surface, and the efficient functionalization of nanocrystals with the probe molecules, through CF3–PEA or baclofen molecules. We have seen that only the methylene group is sufficient to properly functionalize the CsPbBr3 nanocrystals' surface and to highly calibrate them. We showed that the nature of aryl-alkylamine has a real impact on the size calibration, structure (monoclinic, rhombohedral, or tetragonal), shapes (cubes, nanorods, nanosheets) of nanocrystals and on their stability in solution. This stability is also deducible by photoluminescence studies and the PLQY values. When the nanocrystals are stable in solution and present a high calibration, without the presence of micro-aggregates in solution, the PL presents a low FWMH with a good PLQY.
Thus, the photoluminescence of the samples is directly correlated with the stability or aggregation state of the nanocrystals in solution, which has an impact on the quantum yield of the sample rather than the wavelength of the sample. Within the same series, the emission wavelength is almost the same after synthesis. The quantum yields are significantly higher if the nanocrystals are well-calibrated in size and do not induce aggregation states in solution. The photoluminescence will tend towards longer wavelengths with a broader emission band and a decrease in quantum yield when the solution becomes unstable and the nanocrystals aggregate. This observation has been detected particularly with heterocyclic or polyaromatic systems. About photoluminescence lifetimes, summarized in Table 1 and developed in Table SI-2,† every sample exhibited multi-exponential decays. The decay curves can be well-fitted by a triexponential function, where α1, α2, and α3 are the relative amplitudes of each component (in %), and τ1, τ2, and τ3, with τ3 > τ2 > τ1 being the temporal components. By examination of lifetime values for every sample, we can observe quite similar values of τ1, τ2, and τ3 and a better relative amplitude for α2 and α3. These three components can be explained by different hypotheses like a distribution size not fully homogeneous or due to different defects and state surfaces. These photoluminescence lifetime results confirm also the TEM observations because nanocrystal samples exhibit a relatively similar distribution size and shape and the anchorage point from the organic molecule is similar (the –CH2–NH2 group coordinates to the NC surface). Only AmAc1 exhibits two exponential decays in agreement with a different structure compared to other samples.
Finally, this work promotes the new modified-LARP method to obtain highly calibrated functionalized CsPbBr3 nanocrystals with large panels of AAA. These AAA-NCs are potentially promising for OLED applications because we can obtain well-calibrated NCs by soft chemistry and an easy way compared to other methods and also particularly with aryl molecules having a donor group like MeO–PMA or tBu–PMA molecules, that presented a high PLQY of 78 and 81% respectively (Tables 1 and SI-2†). So, this high calibration of functionalized perovskite nanocrystals is a promising result for inkjet printer applications because they can self-assemble automatically during their deposit as we can observe on a copper grid where the surface is fully covered by NCs.
In conclusion, this new modified LARP method opens the way for the use of optically active π-conjugated organic molecules and enlarging to other CsPbX3-type nanocrystals.
4 Experimental details
4.1 Materials
Lead(II) bromide (PbBr2, 99.99%), cesium carbonate (Cs2CO3, 99.99%), oleic acid (OA, 90%), dimethylformamide (DMF, 99.8% anhydrous), toluene (≥99.9%), tetra-octylammonium bromide (TOABr, 98%), 1-naphthylmethylamine (Naph–PMA, C11H11N, 97%), 4-phenylbenzylamine (PPMA, C13H13N, >97%), and 4-tert-butylbenzylamine (tBu–PMA, C11H7N, >98%) were sourced from Sigma-Aldrich. Phenylethylamine (PEA, C8H11N, ≤100%), benzylamine (PMA, C7H9N, 99%), 4-methoxybenzylamine (MeO–PMA, C8H11NO, 98%), 4-(trifluoromethyl)benzylamine (CF3–PMA, C8H8F3N, >98%), 3-phenylpropylamine (PPA, C9H13N, >97%), 3,3-diphenylpropylamine (DPPA, C15H17N, >98%), 2,2-diphenylethylamine (DPEA, C14H15N, >98%), 2-methyl-2-phenethylamine (MPEA, C9H13N, >98%), homophenylalanine (AmAc1, C10H13NO2, >98%), baclofen (AmAc2, C10H12ClNO2, >98%), 2-(4-methoxyphenyl)ethylamine (MeO-PEA, C9H13NO, >98%), 2-(4-trifluoromethylphenyl)ethylamine (CF3–PEA, C9H10F3N, >98%), 2-(aminomethyl)thiophene (ThioMA, C5H7NS, >98%), 2-(2-aminoethyl)thiophene (Thio–EA, C6H9NS, >98%), triphenylmethylamine (TPMA, C19H17N, >95%), benzhydrylamine (DPMA, C13H13N, >97%) and 1-phenylethylamine (MPMA, C8H11N, >98%) were sourced from TCI-Chemicals.4.2 Synthesis
In the MLARP method, a fresh toluene solution containing larger preformed CsPbBr3 nanocrystals stabilized by tetraoctylammonium salt (TOA+) and free of AAA is prepared. This solution called SA is prepared by mixing Cs2CO3 in oleic acid (leading to the formation of cesium oleate (CsOA)) with a toluene solution of lead bromide and TOABr.76,77 This last one plays the role of transfer agent for the PbBr2 salt in toluene (formation of [PbBr4]2(TOA)2) and contributes to CsPbBr3 nanocrystal stabilization in toluene. To improve the quality of the final nanocrystals the mixture of [PbBr4]2(TOA)2 in toluene is cooled at 0 °C. When CsOA in OA is added to [PbBr4]2(TOA)2 in toluene, the solution becomes yellow-green and this transparent mixture becomes a turbid yellow-green. Then, PVK-TOA nanocrystals were recovered after centrifugation at 10![[thin space (1/6-em)]](https://www.rsc.org/images/entities/char_2009.gif) 000 rpm for 20 min, at 5 °C, and redispersed in toluene (10 mL, solution SA).
000 rpm for 20 min, at 5 °C, and redispersed in toluene (10 mL, solution SA).
In parallel, a pre-SB solution is synthesized with the help of two mixtures. The first is a solution of PbBr2 and OA (with the ratio of OA/Pb2+ ≈4) in DMF, at room temperature (0.1 M in Pb2+). The second one contains Cs2CO3 and OA in DMF (OA/Pb2+≈4, Cs+/Pb2+≈0.5). The two mixtures were stirred at 35 °C for at least 10 min to ensure the complete dissolution of all materials. We use the same ratio between these reagents to keep the stochiometric ratio unchanged between Pb2+, OA, and Cs2CO3 in pre-SB compared to SA. Just before mixing pre-SB and SA, AAA is added last in pre-SB. The amount of AAA is adjusted depending on the reactivity of the molecule used to get the better stability of the final SA solution (see Table SI-1†). Then, the final pre-SB (2.5% in volume of SA) is dropped to SA at room temperature to give a clear transparent solution of the final monodisperse perovskite-nanocrystals (SB solutions, Scheme 2), without other treatments.
4.3 Characterization
Nanocrystals were observed and analyzed by transmission electron microscopy with a JEM 2100 Plus microscope (JEOL) and an accelerating voltage of 200 kV. High-resolution TEM (HRTEM) and high-angle annular dark field scanning TEM (HAADF-STEM) images, and energy dispersive X-ray spectroscopy (EDS) measurements were taken with a Titan G2 80-300 microscope (ThermoFisher Scientific) operating at 300 kV. The XRD experiments were performed on a Malvern Panalytical Aeris Research Edition, with a sample changer of 6 positions and a PIXcel 1D detector. The working power is 300 W (30 kV–10 mA). The used radiation is copper Kalpha1 + 2 (approx. 1.5406 angstrom). Samples were placed on a Si (510) sample holder to reduce background. Data were measured from 2 to 60° in 2θ with a total scan time of 10 min per scan with a rotation of the sample during acquisition. The UV–vis absorption spectra of nanocrystals were recorded using a UV–vis spectrometer (PerkinElmer LAMBDA 950 UV/vis/NIR spectrophotometer) in the wavelength range from 300 to 700 nm. Emission and decay time-based measurements were registered using an Edinburgh Instruments FS5 spectrofluorometer on the principle of the steady-state mode and the time-correlated single-photon counting (TCSPC) mode, respectively. The lifetime decay was measured with the module EDEDEPL-405 (405 nm (±5 nm) picosecond pulsed diode laser, typical pulse width: 60 ps @ 10 MHz, rep rate: 20 kHz–20 MHz) coupled with an FS5 spectrofluorometer. The internal quantum efficiencies of nanocrystals were quantitatively determined using an integrating sphere-equipped spectrofluorometer (FS5, Edinburgh). Fluorescence excitation and emission spectra, and quantum yield values were obtained using an Edinburgh Instrument FS5 fluorescence spectrometer. The spectra were recorded in right angle mode using quartz cuvettes with a 1 cm path length. The fluorescence quantum yield values were obtained using the integrating sphere sample cassette available for the FS5 spectrometer. The Fluoracle software was used to calculate the absolute quantum yield values by comparing the blank and the sample spectra.5 Author contributions
C. R. Mayer: conceptualization; methodology; supervision; investigation; writing – original draft/review/editing/funding acquisition; H. Levy-Falk: investigation; G. Trippé-Allard: investigation; N. Guiblin: XRD investigations; F. Fossard: investigation by HR-TEM and EDS; M. Vallet: investigation by TEM; Jean-Sébastien Lauret: review/funding acquisition and Emmanuelle Deleporte: review/funding acquisition.6 Conflicts of interest
There are no conflicts to declare.Acknowledgements
The authors acknowledge financial support from the LABEX Charmmmat (University Paris-Saclay), Agence Nationale de la Recherche: EMIPERO Project ANR-18-CE24-0016 and 2D-HYPE: ANR-21-CE30-0059. The work of H. Levy-Falk is supported by Agence de l'Innovation de Défense. The HAADF-STEM study was carried out within the MATMECA consortium, supported by the ANR-10-EQPX-37 contract, and has benefited from the facilities of the Laboratory MSSMat (UMR CNRS 8579), CentraleSupélec.References
- Q. J. Huang and Y. Zhu, Adv. Mater. Technol., 2019, 4, 1800546 CrossRef.
- Q. Zhang, Q. Shang, R. Su, T. Thu Ha Do and Q. Xiong, Nano Lett., 2021, 21, 1903–1914 CrossRef CAS PubMed.
- Y. Wang, L. Song, Y. Chen and W. Huang, ACS Photonics, 2020, 7, 10–28 CrossRef CAS.
- W. Shen, J. Chen, J. Wu, X. Li and H. Zeng, ACS Photonics, 2021, 8, 113–124 CrossRef CAS.
- E. Mohammed, S. Al-Qaisi, Z. A. Alrowaili, M. Alzaid, E. Maskar, A. Es-Smairi, T. V. Vu and D. P. Rai, Sci. Rep., 2021, 11, 20622 CrossRef PubMed.
- S. Wang, A. A. Yousefi Amin, L. Wu, M. Cao, Q. Zhang and T. Ameri, Small Struct., 2021, 2, 2000124 CrossRef CAS.
- X.-K. Liu, W. Xu, S. Bai, Y. Jin, J. Wang, R. H. Friend and F. Gao, Nat. Mater., 2021, 20, 10–21 CrossRef CAS PubMed.
- L. N. Quan, B. P. Rand, R. H. Friend, S. G. Mhaisalkar, T.-W. Lee and E. H. Sargent, Chem. Rev., 2019, 119, 7444–7477 CrossRef CAS PubMed.
- A. Ren, H. Wang, W. Zhang, J. Wu, Z. Wang, R. V. Penty and I. H. White, Nat. Electron., 2021, 4, 559–572 CrossRef.
- C. K. Ng, C. Wang and J. J. Jasieniak, Langmuir, 2019, 35(36), 11609–11628 CrossRef CAS PubMed.
- Y. Bekenstein, B. A. Koscher, S. W. Eaton, P. Yang and A. P. Alivisatos, J. Am. Chem. Soc., 2015, 137, 16008–16011 CrossRef CAS PubMed.
- Z.-K. Tan, R. S. Moghaddam, M. L. Lai, P. Docampo, R. Higler, F. Deschler, M. Price, A. Sadhanala, L. M. Pazos, D. Credgington, F. Hanusch, T. Bein, H. J. Snaith and R. H. Friend, Nat. Nanotechnol., 2014, 9, 687–692 CrossRef CAS PubMed.
- G. L. Protesescu, S. Yakunin, M. I. Bodnarchuk, F. Krieg, R. Caputo, C. H. Hendon, R. X. Yang, A. Walsh and M. V. Kovalenko, Nano Lett., 2015, 15, 3692–3696 CrossRef PubMed.
- C. K. Ng, C. Wang and J. J. Jasieniak, Langmuir, 2019, 35, 11609–11628 CrossRef CAS PubMed.
- J. Shamsi, A. S. Urban, M. Imran, L. De Trizio and L. Manna, Chem. Rev., 2019, 119, 3296–3348 CrossRef CAS PubMed.
- G. Almeida, L. Goldoni, Q. Akkerman, Z. Dang, A. H. Khan, S. Marras, I. Moreels and L. Manna, ACS Nano, 2018, 12, 1704–1711 CrossRef CAS PubMed.
- H. Pan, X. Li, X. Zhang, J. Liu, X. Chen, H. Zhang, A. Huang and Z. Xiao, Langmuir, 2020, 36, 13663–13669 CrossRef CAS PubMed.
- R. Grisorio, D. Conelli, R. Giannelli, E. Fanizza, M. Striccoli, D. Altamura, C. Giannini, I. Allegretta, R. Terzano and G. P. Suranna, Nanoscale, 2020, 12, 17053–17063 RSC.
- S. Seth and A. Samanta, Sci. Rep., 2016, 6, 37693 CrossRef CAS PubMed.
- C. Lu, M. W. Wright, X. Ma, H. Li, D. S. Itanze, J. A. Carter, C. A. Hewitt, G. L. Donati, D. L. Carroll, P. M. Lundin and S. M. Geyer, Chem. Mater., 2019, 31, 62–67 CrossRef CAS.
- L. Hu, C. Wang, R. M. Kennedy, L. D. Marks and K. R. Inorg, . Chem., 2015, 54, 740–745 CAS.
- J. C. Sadighian, M. L. Crawford, T. W. Suder and C. Y. Wong, J. Mater. Chem. C, 2020, 8, 7041–7050 RSC.
- A. Chakrabarty, S. Satija, U. Gangwar and S. Sapra, Chem. Mater., 2020, 32, 721–733 CrossRef CAS.
- J. C. Sadighian, M. L. Crawford, T. W. Suder and C. Y. Wong, J. Mater. Chem. C, 2020, 8, 7041–7050 RSC.
- H. Lee, J. W. Jeong, M. G. So, G. Y. Jung and C.-L. Lee, Adv. Mater., 2021, 33, 2007855 CrossRef CAS PubMed.
- K. Hills-Kimball, H. Yang, T. Cai, J. Wang and O. Chen, Adv. Sci., 2021, 8, 2100214 CrossRef CAS PubMed.
- Y. Ding, Z. Zhang, S. Toso, I. Gushchina, V. Trepalin, K. Shi, J. W. Peng and M. Kuno, J. Am. Chem. Soc., 2023, 145, 6362–6370 CrossRef CAS PubMed.
- J. Qiu, W. Xue, W. Wang and Y. Li, Dyes Pigm., 2022, 198, 109806 CrossRef CAS.
- J. Shamsi, A. S. Urban, M. Imran, L. De Trizio and L. Manna, Chem. Rev., 2019, 119, 3296–3348 CrossRef CAS PubMed.
- M. Imran, P. Ijaz, D. Baranov, L. Goldoni, U. Petralanda, Q. Akkerman, A. L. Abdelhady, M. Prato, P. Bianchini, I. Infante and L. Manna, Nano Lett., 2018, 18, 7822–7831 CrossRef CAS PubMed.
- S. Xing, Y. Lian, R. Lai, X. Cao, M. Yu, G. Zhang, B. Zhao and D. Di, J. Phys. Chem. Lett., 2022, 13, 704–710 CrossRef CAS PubMed.
- C. R. Mayer, H. Levy-Falk, M. Rémond, G. Trippé-Allard, F. Fossard, M. Vallet, M. Lepeltier, N. Guiblin, J.-S. Lauret, D. Garrot and E. Deleporte, Chem. Commun., 2022, 58, 5960–5963 RSC.
- J. H. Warby, B. Wenger, A. J. Ramadan, R. D. J. Oliver, H. C. Sansom, A. R. Marshall and H. J. Snaith, ACS Nano, 2020, 14, 8855–8865 CrossRef CAS PubMed.
- Y. Yan, S. Yu, A. Honarfar, T. Pullerits, K. Zheng and Z. Liang, Adv. Sci., 2019, 6, 1900548 CrossRef PubMed.
- Y. F. Ng, B. Febriansyah, N. F. Jamaludin, D. Giovanni, N. Yantara, X. Y. Chin, Y. B. Tay, T. C. Sum, S. Mhaisalkar and N. Mathews, Chem. Mater., 2020, 32, 8097–8105 CrossRef CAS.
- (a) P. Pang, G. Jin, C. Liang, B. Wang, W. Xiang, D. Zhang, J. Xu, W. Hong, Z. Xiao, L. Wang, G. Xing, J. Chen and D. Ma, ACS Nano, 2020, 14, 11420–11430 CrossRef CAS PubMed; (b) G. Delport, G. Chehade, F. Lédée, H. Diab, C. Milesi-Brault, G. Trippé-Allard, J. Even, J. S. Lauret, E. Deleporte and D. Garrot, J. Phys. Chem. Letter, 2019, 10, 5153–5159 CrossRef CAS PubMed.
- A. De, N. Mondal and A. Samanta, J. Phys. Chem. C, 2018, 122, 13617–13623 CrossRef CAS.
- Y. Gao, Z. Wei, S.-N. Hsu, B. W. Boudouris and L. Dou, Mater. Chem. Front., 2020, 4, 3400–3418 RSC.
- M. C. Gélvez-Rueda, W. T. M. Van Gompel, R. Herckens, L. Lutsen, D. Vanderzande and F. C. Grozema, J. Phys. Chem. Lett., 2020, 11, 824–830 CrossRef PubMed.
- S. Toso, D. Baranov, C. Giannini, S. Marras and L. Manna, ACS Mater. Lett., 2019, 1, 272–276 CrossRef CAS PubMed.
- J. Liu, X. Zheng, O. F. Mohammed and O. M. Bakr, Acc. Chem. Res., 2022, 55, 262–274 CrossRef CAS PubMed.
- F. Bertolotti, A. Vivani, F. Ferri, P. Anzini, A. Cervellino, M. I. Bodnarchuk, G. Nedelcu, C. Bernasconi, M. V. Kovalenko, N. Masciocchi and A. Guagliardi, Chem. Mater., 2022, 34(2), 594–608 CrossRef CAS.
- C. K. Ng, W. Yin, H. Li and J. J. Jasieniak, Nanoscale, 2020, 12, 4859–4867 RSC.
- J. Song, J. Li, L. Xu, J. Li, F. Zhang, B. Han, Q. Shan and H. Zeng, Adv. Mater., 2018, 30, 1800764 CrossRef PubMed.
- S. Akhil, V. G. Vasavi Dutt, R. Singh and N. Mishra, J. Phys. Chem. C, 2022, 126, 10742–10751 CrossRef CAS.
- Y. Wang, F. Yang, X. Li, F. Ru, P. Liu, L. Wang, W. Ji, J. Xia and X. Meng, Adv. Funct. Mater., 2019, 29, 1904913 CrossRef CAS.
- J.-R. Wen, F. A. R. Ortiz, A. Champ and M. T. Sheldon, ACS Nano, 2022, 16, 8318–8328 CrossRef CAS PubMed.
- T. Wu, Y. Wang, Z. Dai, D. Cui, T. Wang, X. Meng, E. Bi, X. Yang and L. Han, Adv. Mater., 2019, 31, 1900605 CrossRef PubMed.
- Y. Wei, Z. Cheng and J. Lin, Chem. Soc. Rev., 2019, 48, 310 RSC.
- J. Zhu, Q. Di, X. Zhao, X. Wu, X. Fan, Q. Li, W. Song and Z. Quan, Inorg. Chem., 2018, 57, 6206–6209 CrossRef CAS PubMed.
- Q. Sun, C. Ni, Y. Yu, S. Attique, S. Wei, Z. Ci, J. Wang and S. Yang, J. Mater. Chem. C, 2018, 6, 12484–12492 RSC.
- L. Yang, T. Wang, Q. Min, B. Liu, Z. Liu, X. Fan, J. Qiu, X. Xu, J. Yu and X. Yu, ACS Omega, 2019, 4, 6084–6091 CrossRef CAS.
- J. Yin, H. Yang, K. Song, A. M. El-Zohry, Y. Han, O. M. Bakr, J.-L. Brédas and O. F. Mohammed, J. Phys. Chem. Lett., 2018, 9, 5490–5495 CrossRef CAS PubMed.
- B. Hudait, S. K. Dutta, S. Bera and N. Pradhan, Nano Lett., 2021, 21, 5277–5284 CrossRef CAS PubMed.
- J. Cui, F. Xu, Q. Dong, J. Jia, L. Liu, S. Liu, F. Yang and X. Ye, Mater. Res. Bull., 2020, 124, 110731 CrossRef CAS.
- S. K. Dutta, S. Bera, R. K. Behera, B. Hudait and N. Pradhan, ACS Nano, 2021, 15, 16183–16193 CrossRef CAS PubMed.
- M. Li, X. Zhang, T. Dong, P. Wang, K. Matras-Postolek and P. Yang, J. Phys. Chem. C, 2018, 122, 28968–28976 CrossRef CAS.
- J. Liu, K. Song, X. Zheng, J. Yin, K. X. Yao, C. Chen, H. Yang, M. N. Hedhili, W. Zhang, P. Han, O. F. Mohammed, Y. Han and O. M. Bakr, J. Phys. Chem. Lett., 2021, 12, 10402–10409 CrossRef CAS PubMed.
- S. Wei, Y. Yang, X. Kang, L. Wang, L. Huang and D. Pan, Inorg. Chem., 2017, 56, 2596–2601 CrossRef CAS PubMed.
- L. Ruan, W. Shen, A. Wang, A. Xiang and Z. Deng, J. Phys. Chem. Lett., 2017, 8, 3853–3860 CrossRef CAS PubMed.
- A. Dutta, R. K. Behera, S. K. Dutta, S. Das Adhikari and N. Pradhan, J. Phys. Chem. Lett., 2018, 9, 6599–6604 CrossRef CAS PubMed.
- X. Tang, S. Han, Z. Zu, W. Hu, D. Zhou, J. Du, Z. Hu, S. Li and Z. Zang, Front. Phys., 2018, 5(69), 1–7 Search PubMed.
- L. Ruan, J. Lin, W. Shen and Z. Deng, Nanoscale, 2018, 10, 7658–7665 RSC.
- K.-H. Wang, L. Wu, L. Li, H.-B. Yao, H.-S. Qian and S.-H. Yu, Angew. Chem., Int. Ed., 2016, 55, 8328–8332 CrossRef CAS PubMed.
- J. Zhao, S. Cao, Z. Li and N. Ma, Chem. Mater., 2018, 30, 6737–6743 CrossRef CAS.
- Y.-L. Hu, Q.-L. Wen, Z.-F. Pu, A.-Y. Liu, J. Wang, J. Ling, X.-G. Xie and Q.-E. Cao, RSC Adv., 2020, 10, 34215 RSC.
- T. Udayabhaskararao, M. Kazes, L. Houben, H. Lin and D. Oron, Chem. Mater., 2017, 29, 1302–1308 CrossRef CAS.
- Z. Dang, J. Shamsi, F. Palazon, M. Imran, Q. A. Akkerman, S. Park, G. Bertoni, M. Prato, R. Brescia and L. Manna, ACS Nano, 2017, 11, 2124–2132 CrossRef CAS PubMed.
- H. Lee, J. W. Jeong, M. G. So, G. Y. Jung and C.-L. Lee, Adv. Mater., 2021, 33, 2007855 CrossRef CAS PubMed.
- X.-K. Liu, W. Xu, S. Bai, Y. Jin, J. Wang, R. H. Friend and F. Gao, Nat. Mater., 2021, 20, 10 CrossRef CAS PubMed.
- R. J. Hill, Acta Crystallogr., 1985, 41, 1281–1284 Search PubMed.
- A. Kostopoulou, M. Sygletou, K. Brintakis, A. Lappas and E. Stratakis, Nanoscale, 2017, 9, 18202–18207 RSC.
- J. Xing, Y. Zhao, M. Askerka, L. N. Quan, X. Gong, W. Zhao, J. Zhao, H. Tan, G. Long, L. Gao, Z. Yang, O. Voznyy, J. Tang, Z.-H. Lu, Q. Xiong and E. H. Sargent, Nat. Commun., 2018, 9, 3541 CrossRef PubMed.
- Y. Li, J. V. Milić, A. Ummadisingu, J.-Y. Seo, J.-H. Im, H.-S. Kim, Y. Liu, M. I. Dar, S. M. Zakeeruddin, P. Wang, A. Hagfeldt and M. Grätzel, Nano Lett., 2019, 19(1), 150–157 CrossRef CAS PubMed.
- L. Mao, C. C. Stoumpos and M. G. Kanatzidis, J. Am. Chem. Soc., 2019, 141, 1171–1190 CrossRef CAS PubMed.
- Q. Jing, Y. Xu, Y. Su, X. Xing and Z. Lu, Nanoscale, 2019, 11, 1784–1789 RSC.
- J. H. Park, A.-Y. Lee, J. C. Yu, Y. S. Nam, Y. Choi, J. Park and M. H. Song, ACS Appl. Mater. Interfaces, 2019, 11, 8428–8435 CrossRef CAS PubMed.
- X. Li, J. M. Hoffman and M. G. Kanatzidis, Chem. Rev., 2021, 121(4), 2230–2291 CrossRef CAS PubMed.
- J. Y. Lee, S. Y. Kim and H. J. Yoon, Adv. Opt. Mater., 2022, 10, 2101361 CrossRef CAS.
- H. Song, J. Yang, W. H. Jeong, J. Lee, T. H. Lee, J. W. Yoon, H. Lee, A. J. Ramadan, R. D. J. Oliver, S. C. Cho, S. G. Lim, J. W. Jang, Z. Yu, J. T. Oh, E. D. Jung, M. H. Song, S. H. Park, J. R. Durrant, H. J. Snaith, S. U. Lee, B. R. Lee and H. Choi, Adv. Mater., 2023, 35, 2209486 CrossRef CAS PubMed.
- M. D. Smith, B. A. Connor and H. I. Karunadasa, Chem. Rev., 2019, 119, 3104–3139 CrossRef CAS PubMed.
- C. Lee, Y. Shin, A. Villanueva-Antolí, S. Das Adhikari, J. Rodriguez-Pereira, J. M. Macak, C. A. Mesa, S. Giménez, S. J. Yoon, A. F. Gualdrón-Reyes and I. Mora-Seró, Chem. Mater., 2021, 33(22), 8745–8757 CrossRef CAS.
Footnote |
| † Electronic supplementary information (ESI) available: Synthesis and characterization details; PL lifetime-decay curves, UV-vis light irradiation, time-resolved photoluminescence (TRPL) decay curve, XRD patterns, and TEM image; size distribution histogram of AAA-CsPbBr3 nanocrystals. See DOI: https://doi.org/10.1039/d3na01105d |
| This journal is © The Royal Society of Chemistry 2024 |

