 Open Access Article
Study on the preparation of ascorbic acid reduced ultrafine copper powders in the presence of different protectants and the properties of copper powders based on methionine protection†
Xin
Ke
abc,
Bingqing
Xie
abc,
Jingguo
Zhang
*abd,
Jianwei
Wang
*ae,
Weiying
Li
b,
Liqing
Ban
ab,
Qiang
Hu
ab,
Huijun
He
ab,
Limin
Wang
ab and
Zhong
Wang
 *ab
*ab
aMetal Powder Materials Industrial Technology Research Institute of China GRINM, Beijing 101407, China. E-mail: wangjianwei@grinm.com; wzwz99@126.com
bGRIPM Advanced Materials Co. Ltd, Beijing 101407, China. E-mail: zjg@gripm.com
cGeneral Research Institute for Nonferrous Metals, Beijing 100088, China
dChina Gricy Advanced Materials Co., Ltd, Chongqing 401431, China
eGRINM NEXUSX Advanced Materials (Beijing) Co. Ltd, Beijing 101407, China
First published on 15th January 2024
Abstract
High-purity, monodisperse, and low-oxygen submicron copper powder particles with particle sizes in the range of 100–600 nm were synthesized under alkaline conditions using ascorbic acid (C6H8O6) as a reductant and copper chloride (CuCl2·2H2O) as a copper source. The redox potential of the Cu–Cl–H2O system was obtained by calculations and plotted on pH–E diagrams, and a one-step secondary reduction process (Cu(II) → CuCl(I) → Cu2O(I) → Cu(0)) was proposed to slow down the reaction rate. The commonalities and differences in the nucleation and growth process of copper powders under methionine (Met), hexadecyl trimethyl ammonium bromide (CTAB), and sodium citrate dihydrate (SSC) as protectants and without the addition of protectants are compared, and the reaction mechanism is discussed. Among them, methionine (Met) showed excellent properties and the Cu2O(I) → Cu(0) process was further observed by in situ XRD. The synthesized copper powder particles have higher particle size controllability, dispersibility, antioxidant properties, and stability, and can be decomposed at lower temperatures (<280 °C). The resistivity can reach 21.4 μΩ cm when sintered at a temperature of 325 °C for 30 min. This green and simple synthesis process facilitates industrialization and storage, and the performance meets the requirements of electronic pastes.
1. Introduction
Ultrafine copper powder particles, mainly in nano (<100 nm) and sub-micron (<1 μm) scales, can be made into electronic pastes due to their high electrical and thermal conductivity, low electrochemical mobility behavior, and strong solderability, as well as low price and easy availability of raw materials.1–5 Further conductive patterns with high uniformity and high electrical conductivity can be realized by printed electronics, which is considered to be the most promising alternative to silver in the future and has received widespread attention.6–9 However, the smaller particle sizes, narrower distribution, higher activity, and easy oxidization pose inevitable limitations on the preparation and storage of the ultrafine copper powder particles.10 Although various methods exist for preparing ultrafine copper powder particles including physical and chemical methods, wet chemical synthesis is considered to be the more desirable method for industrial applications due to its strong controllability of particle size morphology. It utilizes the redox mechanism to change the nucleation and growth process, and thus regulate the size and morphology by modulating the parameters of a reductant, copper source, protectant, concentration, reaction temperature, and pH.11,12Reductants and protectants are crucial in wet chemical synthesis. As the basis of the redox process, the reductant reduces divalent copper salt ions to the zero-valent state and further induces their nucleation and growth. The protectant is often used to functionalize the wet chemical synthesis of ultrafine copper powders, adsorbing on the surface of copper particles to reduce the surface energy to control growth, prevent aggregation, and hinder oxidation.13 In most cases, ascorbic acid is the most commonly used reductant in the synthesis of ultrafine copper powder particles, and the moderate reduction rate ensures strong controllability.14 Polyvinyl pyrrolidinium (PVP),15 cetyltrimethylammonium bromide (CTAB),16 alkyl amines (cetyl, octadecyl),17 and other macromolecular long carbon chain surfactants are chosen as protectants to improve dispersion and regulate the growth to avoid aggregation and oxidation. Additionally, complexing agents and small organic ligands may be used as protectants sparingly. Y. Shun et al.18 synthesized nanoscale (Cu NPs) and micrometer-sized Cu particles (Cu MPs) with narrow size distributions using ascorbic acid as a reductant and citric acid as a complexing agent and discussed their growth mechanisms; N. Kumar et al.19 synthesized copper nanoparticles in aqueous media using L-cysteine as a capping and functionalizing agent; H. J. Pereira et al.20 used L-alanine as a capping layer and stabilizer for the aqueous synthesis of submicron-sized copper metal particles under ambient conditions and found the nature of complex formation between L-alanine and the copper(II) precursor and demonstrated that L-alanine acted as an effective barrier on the surface of the copper particles conferring good thermal stability and delaying the onset of oxidation.
However, preparing size-controllable, homogeneous, and long-term stable copper nanomaterials in a simple reaction system is still challenging. The mechanism for its nucleation and growth process is not precise, and more importantly, the accessible oxidization properties of copper are the main problem that hinders its functional application.21 Therefore, to obtain a convenient, economical, and green aqueous phase synthesis method to realize monodisperse, easily detachable, and oxidation-resistant ultrafine copper powder particles, we focus on ascorbic acid and amino acids as the reductant and protectant, which, as a kind of naturally occurring vitamin, exists in large quantities in nature and has a very good reducing and antioxidant ability; and amino acids, which have NH3+ and COO−, which can have good coordination adsorption ability with copper, thus regulating the size and morphology of the formed copper powder particles and hindering the erosion of oxygen.22
In this study, to address the problems of difficulty to control, poor dispersion, and easy oxidation of ultrafine copper powder particles during the preparation process, the redox potential of the Cu–Cl–H2O system was obtained by calculation and the pH–E diagram was plotted to guide the synthesis process, and a one-step secondary reduction method was further proposed to regulate the reaction rate and to control the process of nucleation and growth of the ultrafine copper powder particles. High-purity, monodisperse, and low-oxygen ultrafine copper powder particles were synthesized with a 100–600 nm particle size. The commonalities and differences of the nucleation and growth processes under the effect of different protectants were compared by controlling the pH, and the reaction mechanism was discussed. It was found that the ultrafine copper powder particles prepared with methionine as the protectant were more controllable, with better dispersion and antioxidant ability.
2. Experimental section
2.1 Materials
Copper(II) chloride dihydrate (CuCl2·2H2O, 99%, Aladdin), cuprous oxide (Cu2O, 99%, Aladdin), L-methionine (C5H11NO2S, Met, 99%, Aladdin), hexadecyl trimethyl ammonium bromide (C16H33(CH3)3NBr, CTAB, 99%, Aladdin), sodium citrate dihydrate (C6H9Na3O9·2H2O, SSC, 99%, Aladdin), L-ascorbic acid (C6H8O6, 99%, Aladdin), sodium hydroxide (NaOH, 99%, Aladdin), and absolute ethanol (CH3CH2OH, 99%, Sinopharm) were used. The remaining chemicals used were of analytical grade without any further treatment. Deionized water was prepared using the Nanjing Yipu Yida Plus-E2 ultra-pure water mechanism throughout the research.2.2 Synthesis of nano copper powder
Firstly, the solution required for the experiment was configured under magnetic stirring conditions, and the copper salt was dissolved in 25 mL of deionized water to produce an aqueous solution of copper chloride (CuCl2·2H2O) with a concentration of 1.0 mol L−1. Subsequently, a certain amount of protectant (Met, CTAB, SSC) was dissolved in the copper chloride solution to obtain a mixed Cu2+–protectant solution, in which the concentration of protectant was 0.2 mol L−1. C6H8O6 was dissolved in 25 mL of deionized water and stirred thoroughly to get an aqueous ascorbic acid solution with a concentration of 1.2 mol L−1 which was poured into the Cu2+–protectant mixture. Aqueous NaOH solution of 2.0 mol L−1 was added to the mixed solution to adjust the pH of the solution to 11.0–12.0. The temperature of the solution was then raised to 80 °C for 1 h using a magnetic stirring heating jacket, during which the color of the solution changed to milky white → green → blue → orange → brown → reddish brown. After the reaction, the flask was submerged in ice-cold water to quench the reaction. Then, the solution was transferred to a centrifuge tube for 3 min at 10![[thin space (1/6-em)]](https://www.rsc.org/images/entities/char_2009.gif) 000 rpm and washed with anhydrous ethanol and deionized water 3 times until neutral.
000 rpm and washed with anhydrous ethanol and deionized water 3 times until neutral.
The entire reaction was carried out in a three-neck flask, and a thermometer with a rubber stopper was inserted into the mixed solution under stirring to monitor the reaction temperature. A Mettler Toledo model FE28 pH meter was used to reflect the solution pH in real time. In each experiment, the pH values of NaOH, C6H8O6, and the protectant were monitored and recorded before and after the addition of the solution. The corresponding experimental conditions and the state and pH of the solution at different stages are shown in Table 1.
| Sample | Protectant | pH | pH of Cu solution | pH and color after adding protectant | pH and color after the addition of ascorbic acid | pH and color after adding NaOH |
|---|---|---|---|---|---|---|
| Met-11.0 | Met | 11.0 | 1.60 | 0.57, brownish-black | −0.38, milky white | 11.0, orange |
| CTAB-11.0 | CTAB | 11.0 | 1.55 | 1.61, brownish-yellow viscous | −0.41, milky white | 11.0, orange |
| SSC-11.0 | SSC | 11.0 | 1.52 | 1.31, bright green | −0.29, milky white | 11.0, orange |
| Met-11.5 | Met | 11.5 | 1.63 | 0.61, brownish-black | −0.37, milky white | 11.5, orange |
| CTAB-11.5 | CTAB | 11.5 | 1.55 | 1.60, brownish-yellow viscous | −0.47, milky white | 11.5, orange |
| SSC-11.5 | SSC | 11.5 | 1.52 | 1.29, bright green | −0.34, milky white | 11.5, orange |
| None-12.0 | — | 12.0 | 1.53 | — | −0.47, milky white | 12.0, orange |
| Met-12.0 | Met | 12.0 | 1.57 | 0.62, brownish-black | −0.38, milky white | 12.0, orange |
| CTAB-12.0 | CTAB | 12.0 | 1.51 | 1.62, brownish-yellow viscous | −0.56, milky white | 12.0, orange |
| SSC-12.0 | SSC | 12.0 | 1.53 | 1.39, bright green | −0.23, milky white | 12.0, orange |
2.3 In situ observation of phase transition behavior during the liquid phase reduction of ultrafine copper powders
To realize the real-time observation of the liquid-phase reduction process of ultrafine copper powders, synchrotron radiation in situ XRD experiments were carried out at the Shanghai Synchrotron Radiation Facility (SSRF) BL14B1. A glass capillary tube with 4 cm × Φ1 mm was filled with the reaction solution and sealed at both ends, which was set into a rotating tube shaft and heated from room temperature to 80 °C at a rate of 10 °C min−1 to simulate the experimental process, while in situ XRD tests were performed. In the in situ test, the incident X-rays were precisely tuned to the center of the heating jacket and the capillary wall, and the detector collected high-resolution X-ray diffraction data every 5 °C during the warming phase.2.4 Low-temperature sintering of copper powder particles
In order to test the resistivity of copper powder particles prepared with Met as a protectant, the washed and dried copper powder particles were mixed with ethylene glycol to obtain a copper paste with a solid content of 85%. The copper paste was screen-printed on a glass sheet as a circular sheet (Φ12.7 mm × δ0.3 mm), and then sintered in a tube furnace at low temperature without pressure, with a sintering atmosphere of 95% N2–5% H2. The sintering process involves raising the room temperature to 130 °C and holding it for 5 minutes, and then increasing the temperature to the sintering temperature (225 °C, 250 °C, 275 °C, 300 °C, 325 °C) and holding it for 30 min with a temperature increase rate of 5 °C min−1.2.5 Characterization
A scanning electron microscope (SEM, Japan Electronics, JSM-7900F) was used to observe the particle size, morphology, and dispersion of nano copper powder, and Image J image analysis software was used to estimate the size distribution and average particle size of copper nanoparticles. A transmission electron microscope (TEM, Japan Electronics, JEM-2010) was used to observe the morphology, electron diffraction pattern (SAED), and elemental distribution of copper nanoparticles and the surface organic matter coverage, where the carrier mesh as a powder specimen is Mo mesh; X-ray diffraction (XRD, Japan Science, Smart-lab, CuKα as the radiation source, diffraction angle 2θ range 10–90°) provided the physical phase, and structural information of nano copper powder, and grain size, crystallinity, and microstrain could be examined; XPS was used to analyze the data on elemental composition, molecular structure, and atomic valence on the surface of nano copper powder.3. Results and discussion
3.1 Reaction process for the reduction of copper chloride by ascorbic acid
In redox reactions, the electrode potentials of oxidation and reduction reactions determine the feasibility and rate of redox reactions, which in turn affect the nucleation and growth process of copper nanoparticles. When copper ions or complexes are reduced to copper metal particles, the reaction process strongly depends on the driving force of the redox reaction in aqueous solution,23 which is the potential difference between C6H8O6 and Cu2+ in this study.The redox half-reaction equation for the reduction of Cu2+ with ascorbic acid as the reductant can be expressed by eqn (1) and (2):
| C6H8O6 − 2e− = C6H6O6 + 2H+ | (1) |
| Cu2+ + 2e− = Cu | (2) |
The standard electrode potential of Cu2+ as the oxidizing agent in this redox reaction is Eθ(Cu2+/Cu) = +0.342 V, and the standard electrode potential of ascorbic acid (C6H8O6) as the reducing agent is Eθ(C6H8O6/C6H6O6) = +0.08 V. The electrode potential of ascorbic acid (C6H8O6) is much lower than the electrode potential of Cu2+, causing a large potential difference, and theoretically it can be used as a reductant for Cu2+ to reduce it to Cu0.
The redox potential of ascorbic acid was calculated from the Nernst equation in eqn (3):
 | (3) |
In an aqueous system with CuCl2·2H2O as the copper source and C6H8O6 as the reductant, a Cu2+ concentration of 1.0 mol L−1 was used as a reference, the stability of copper and its compounds in different pH environments at room temperature of 25 °C was considered, and the pH–E diagram was calculated as shown in Fig. 1. Cu2+ can only be stabilized under acidic conditions at pH below 3.2, whereas with the addition of C6H8O6 the ligand reaction occurs between Cl− and Cu2+. That means Cu no longer exists in the free ionic state and a series of complexes are formed such as CuCl+, CuCl2·3Cu(OH)2, and CuCl. When copper is in the highly oxidized state of Cu(II), the thermodynamically more stable complexes formed with Cl− are more favorable for its oxidation, resulting in a lower and constant standard potential value within a certain acidic range, a decrease in the potential difference with C6H8O6, and a slowing down of both the redox reaction drive and reaction rate. When the pH in the solution increased to near 6, Cu(I) no longer existed in the form of the Cl− complex but began to transform into the more stable Cu2O, whose potential decreased linearly with the gradual increase of pH, but as the potential of ascorbic acid showed the same trend since the initial state, it made the potential difference between it and Cu2O larger than that with CuCl, and the reaction was easier to carry out, and finally complete reduction to Cu(0) occurred.
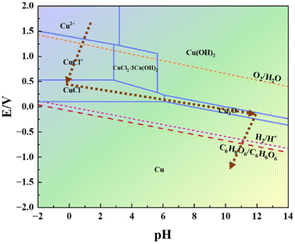 | ||
| Fig. 1 pH–E plot of copper chloride at a concentration of 1.0 mol L−1 in an aqueous ascorbic acid system at 25 °C. | ||
The XRD profiles of the products at different stages of the reaction in the presence of each protectant (None, Met, CTAB, SSC) at pH = 12.00 were determined by X-ray diffraction (XRD) as shown in Fig. 2. Fig. 2(a) shows the XRD pattern of the white precipitate formed after the addition of C6H8O6, and all the diffraction peaks correspond to the diffraction peaks of the standard CuCl (PDF#77-2383), which indicates that the white product during the reaction is CuCl. The samples are tested using the same amount, and among them, the diffraction peaks of the crystalline surface of (111) are all the strongest, and the peak intensity of different samples (None > SSC > CTAB > Met) is greatly different: the diffraction peak intensity of the (111) crystal plane without adding the protectant (sample None-12.0) is the highest, indicating that the crystallization degree of the CuCl formed is better, the grain is larger than other samples, and the growth of the crystal plane is more orderly. A trace amount of CuClO4 (PDF#38-0594) was also found in the product with CTAB as the protectant (sample CTAB-12.0). This is a result of the CTAB as a kind of cationic surfactant, which can act as a cross-linking agent in an aqueous solution to form complexes with a variety of compounds. Fig. 2(b) shows the XRD pattern of the orange-yellow precipitate formed when the pH was adjusted to 12.0 by the addition of NaOH, and the physical phase analysis showed that its diffraction peaks corresponded to those of the standard Cu2O (PDF#99-0041). The absence of the protectant (sample None-12.0) makes it difficult to fully react under these conditions due to the high degree of crystallization, ordered (111) crystal surface growth, and an untransformed CuCl phase in the product. The XRD pattern of the reddish-brown product after the final complete reduction is shown in Fig. 2(c), and the diffraction peaks correspond to those of the standard Cu (PDF#85-1326), indicating that all of them have been completely reduced to Cu(0) and that the number of (111) crystalline surfaces is greater. The amplification of the diffraction peaks of the (111) grain surface at 2θ = 43.316° reveals that the FWHM with Met as the protectant (sample Met-12.0) is significantly narrowed compared to the other conditions, which is analyzed in conjunction with the information on grain size and microscopic strain in Table 2 as the narrowing of the diffraction peaks due to the coarsening of the grains and weakening of the microscopic strain. It was further found that the diffraction peaks of Cu powder prepared with Met as the protectant (sample Met-12.0) were finer, higher, and sharper, indicating a higher degree of crystallinity. The results showed that the ultrafine Cu powders obtained by using C6H8O6 as the reductant and CuCl2·2H2O as the copper source underwent the reduction process of Cu2+(II) → CuCl(I) → Cu2O(I) → Cu(0) shown by the brown dashed line in Fig. 1. The accuracy of the pH–E diagram was demonstrated by combining the solution pH measured during the sampling phase (Table 1) with the stabilization zones of the substances in the corresponding solution environments in Fig. 1. Based on the above observations, the following secondary reduction reaction process is proposed to conform to the following reaction equation scheme at pH = 11.0–12.0:
| Cu2+(II) + Cl− + C6H8O6 → CuCl(I) + C6H7O6 + H+ | (4) |
| 2CuCl(I) + OH− → Cu2O(I) + 2Cl− + H2O | (5) |
| Cu2O(I) + 2C6H7O6 → 2Cu(0) + 2C6H6O6 + H2O | (6) |
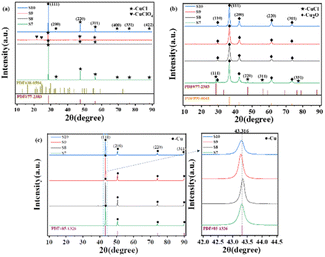 | ||
| Fig. 2 XRD patterns of the products at different stages of the reaction at pH = 12: (a) after the addition of ascorbic acid; (b) after the addition of NaOH; (c) at the end of the reaction. | ||
| Sample | Crystallinity/% | Grain size/Å | Microstrain/% | FWHM/rad |
|---|---|---|---|---|
| Met-11.0 | 27.74 | 420 | 0.067 | 0.239 |
| CTAB-11.0 | 26.99 | 486 | 0.119 | 0.212 |
| SSC-11.0 | 22.27 | 315 | 0.296 | 0.286 |
| Met-11.5 | 27.39 | 538 | 0.104 | 0.193 |
| CTAB-11.5 | 27.98 | 492 | 0.146 | 0.199 |
| SSC-11.5 | 22.84 | 349 | 0.260 | 0.290 |
| None-12.0 | 22.19 | 405 | 0.227 | 0.233 |
| Met-12.0 | 26.20 | 619 | 0.128 | 0.179 |
| CTAB-12.0 | 25.48 | 518 | 0.155 | 0.254 |
| SSC-12.0 | 22.89 | 388 | 0.223 | 0.236 |
3.2 Comparison of the properties of ultrafine copper powders synthesized with different protectants
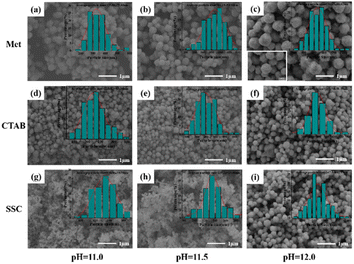
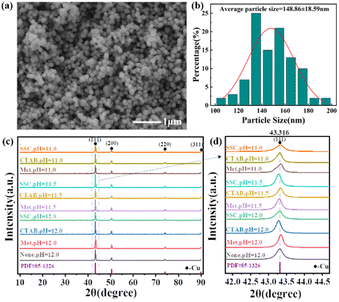
The morphological particle size and dispersibility information of copper powders under different conditions were investigated using SEM as shown in Fig. 3, and the particle size distribution was plotted and the average particle size was statistically determined based on the SEM images. We found that the particle size of ultrafine Cu powders prepared with different protectants increased with pH, and the dispersion and homogeneity improved significantly, even though the difference in the particle size of Cu powders under the same reaction conditions was large (Met > CTAB > SSC). Especially at pH = 12.0, a significant jump in particle size and dispersion properties occurred, and the average particle size of the copper powder (Fig. 3(c)) with Met as the protectant reached 536.63 ± 88.62 nm, which was much larger than the average particle size of the copper powder prepared with CTAB (293.76 ± 58.29 nm) (Fig. 3(f)) and SSC (267.34 ± 41.93 nm) (Fig. 3(i)), and the particles were separated from each other with clear boundaries, and no agglomeration was found. The morphology, particle size, and dispersion of the copper powder with Met as the protectant were also superior to those of the copper powder with the other two protectants at pH = 11.0 and 11.5. This indicated that during the formation of Cu powder particles, the reaction pH and protectant have a significant effect on the nucleation growth and particle dispersion of Cu; especially Met as a nonpolar amino acid different from surfactants showed stronger controllability.As a comparison, the SEM and particle size distribution of Cu powder obtained by direct reduction without adding any protectant under the same reaction conditions are shown in Fig. 4(a) and (b). We found that the particles of Cu powder without protectant are also separated from each other unbonded, which indicated that ascorbic acid itself has a good dispersing ability, in addition to the homogeneous morphology and size, and the average particle size (148.86 ± 18.59 nm) is much smaller than that of the Cu powder with the additive of protectant under the same conditions. This conclusion is also supported by the SEM plots and particle size changes of copper powder particles (Fig. S1–S15†) obtained by using different protectants prepared under different reaction conditions in the ESI.† The preparation of Cu powder under different conditions was analyzed by XRD as shown in Fig. 4(c), and X-ray diffraction peaks appeared at 2θ of 43.3°, 50.4°, 74.1°, and 89.9°, which corresponded to the (111), (200), (220), and (311) crystal planes of the standard Cu (PDF#85-1326), respectively, where the sharp diffraction peak of the (111) crystal plane reveals the high crystallinity of Cu powder particles. Local enlargement of the crystal surface of (111) at 2θ = 43.316° (Fig. 4(d)) revealed that the diffraction peak intensities and half-height widths are altered to varying degrees after the addition of the protectant, indicating that there are microscopic strains within the Cu powder particles, which in turn lead to distortion of the crystal surface and make the diffraction peaks deformed. The finer and higher (111) diffraction peaks of the Cu powders prepared with Met as a protectant indicated good crystallinity, while their microstrain was smaller and grain size was larger, indicating lower lattice defects.24
The grain size of the Cu powder particles calculated by the Scherrer formula (Table 2) also had a good correspondence with the SEM image. However, its grain size is much smaller than that of the particle size in SEM, indicating that the copper powder has undergone a secondary aggregate growth after a primary nucleation growth. In particular, the surface of the copper powder particles in Fig. 3(c) still has small particles that are not fully aggregated, which can be considered to be the second aggregation of the process of growth left behind, which is also consistent with Park et al. who proposed the “outbreak of nucleation–aggregation of the growth” of the two-stage growth model.25 The increase in pH promotes the secondary dissociation of ascorbic acid, while the addition of the protectant alters the surface free energy of Cu atoms, which in turn controls the rate of nucleation and the rate of reaction such that a higher critical free energy is required to reach the critical nucleation radius.
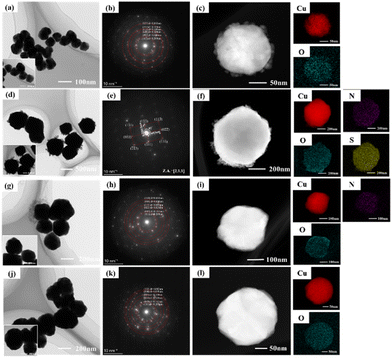
The TEM images, SAED images, and EDS elemental distributions are shown in Fig. 5, the particle size and dispersion properties of the Cu powder particles added with different protectants exhibit obvious differences, in which the Cu powder particles (about 500 nm) with Met as the protectant are much larger than the others, and at the same time the boundaries between the particles are clear and without agglomeration. The SAED results show that the copper powder particles prepared with Met as the protectant are more characterized by single crystals. In contrast, the copper powder particles prepared with other protectants are polycrystalline diffraction rings. This indicates that the growth behavior of using Met as a protectant is dominated by crystalline growth, while other protectants are dominated by aggregation growth. The corresponding element distribution diagrams confirm that the particles are Cu, with oxygen on the surface, which copper tends to adsorb. The EDS diagrams in Fig. 5(f) and (i) also confirm the characteristic elements of the corresponding protectant: N and S in Met and N in CTAB, indicating the participation of the protectants in the preparation process of the Cu powder and the source of differences between the copper powder particles. In addition, the brighter and more tightly packed Cu element with Met as the protectant indicated that it has higher Cu content and lower oxygen adsorption; subsequent XPS confirmed this conclusion, indicating that Met as a non-polar amino acid shows excellent properties different from conventional surfactants.26
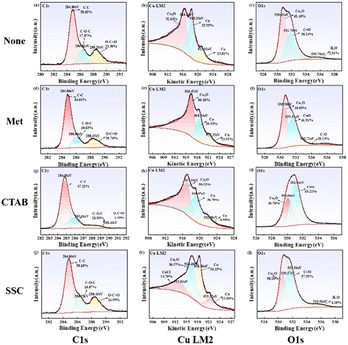
The XPS data demonstrated the elemental content in the ultrafine copper particles synthesized with different protectants. The specific elements and their contents are shown in Table 3; the synthesized copper powders all have C, Cu, O, and uncleaned Cl and Na. Through the full spectrum analysis, it was found that there were differences in the purity and oxidation degree of the copper powders prepared with different protectants, among which the copper powders prepared with Met as the protectant had the highest purity of 92.81% and the lowest oxygen content of only 3.37%. The other main detection elements also corresponded to the pharmaceutical elements used in the experimental procedure and the elements analyzed by EDS energy spectroscopy.
| Sample | Element | Peak position/eV | FWHM/eV | Area/eV | Weight/% |
|---|---|---|---|---|---|
| None-12.0 | Cu2p3 | 932.76 | 2.99 | 5![[thin space (1/6-em)]](https://www.rsc.org/images/entities/char_2009.gif) 153 153![[thin space (1/6-em)]](https://www.rsc.org/images/entities/char_2009.gif) 613.10 613.10 |
92.66 |
| O1s | 531.20 | 3.33 | 1![[thin space (1/6-em)]](https://www.rsc.org/images/entities/char_2009.gif) 240 240![[thin space (1/6-em)]](https://www.rsc.org/images/entities/char_2009.gif) 929.57 929.57 |
4.13 | |
| Na1s | 1071.69 | 2.89 | 245![[thin space (1/6-em)]](https://www.rsc.org/images/entities/char_2009.gif) 633.72 633.72 |
1.88 | |
| C1s | 285.14 | 3.54 | 460![[thin space (1/6-em)]](https://www.rsc.org/images/entities/char_2009.gif) 643.40 643.40 |
1.02 | |
| Cl2p | 199.93 | 5.32 | 49![[thin space (1/6-em)]](https://www.rsc.org/images/entities/char_2009.gif) 352.76 352.76 |
0.31 | |
| Met-12.0 | Cu2p3 | 932.66 | 2.99 | 4![[thin space (1/6-em)]](https://www.rsc.org/images/entities/char_2009.gif) 762 762![[thin space (1/6-em)]](https://www.rsc.org/images/entities/char_2009.gif) 361.73 361.73 |
92.81 |
| O1s | 531.02 | 3.21 | 9![[thin space (1/6-em)]](https://www.rsc.org/images/entities/char_2009.gif) 333 333![[thin space (1/6-em)]](https://www.rsc.org/images/entities/char_2009.gif) 932.86 932.86 |
3.37 | |
| Na1s | 1071.22 | 2.97 | 227![[thin space (1/6-em)]](https://www.rsc.org/images/entities/char_2009.gif) 132.63 132.63 |
1.88 | |
| C1s | 285.05 | 3.28 | 362![[thin space (1/6-em)]](https://www.rsc.org/images/entities/char_2009.gif) 220.37 220.37 |
0.87 | |
| S2p | 163.11 | 3.07 | 93![[thin space (1/6-em)]](https://www.rsc.org/images/entities/char_2009.gif) 372.08 372.08 |
0.57 | |
| Cl2p | 199.00 | 3.94 | 60![[thin space (1/6-em)]](https://www.rsc.org/images/entities/char_2009.gif) 165.73 165.73 |
0.41 | |
| N1s | 399.98 | 3.31 | 31![[thin space (1/6-em)]](https://www.rsc.org/images/entities/char_2009.gif) 461.91 461.91 |
0.09 | |
| CTAB-12.0 | Cu2p3 | 932.14 | 3.29 | 1![[thin space (1/6-em)]](https://www.rsc.org/images/entities/char_2009.gif) 990 990![[thin space (1/6-em)]](https://www.rsc.org/images/entities/char_2009.gif) 271.08 271.08 |
85.61 |
| O1s | 530.74 | 3.36 | 911![[thin space (1/6-em)]](https://www.rsc.org/images/entities/char_2009.gif) 282.09 282.09 |
7.26 | |
| C1s | 284.96 | 3.14 | 884![[thin space (1/6-em)]](https://www.rsc.org/images/entities/char_2009.gif) 416.06 416.06 |
4.67 | |
| Na1s | 1070.99 | 3.17 | 63![[thin space (1/6-em)]](https://www.rsc.org/images/entities/char_2009.gif) 153.83 153.83 |
1.16 | |
| Cl2p | 198.37 | 3.82 | 57![[thin space (1/6-em)]](https://www.rsc.org/images/entities/char_2009.gif) 024.77 024.77 |
0.86 | |
| N1s | 402.38 | 3.49 | 69![[thin space (1/6-em)]](https://www.rsc.org/images/entities/char_2009.gif) 319.46 319.46 |
0.45 | |
| SSC-12.0 | Cu2p3 | 932.63 | 3.03 | 4![[thin space (1/6-em)]](https://www.rsc.org/images/entities/char_2009.gif) 088 088![[thin space (1/6-em)]](https://www.rsc.org/images/entities/char_2009.gif) 104.21 104.21 |
90.36 |
| O1s | 531.16 | 3.36 | 1![[thin space (1/6-em)]](https://www.rsc.org/images/entities/char_2009.gif) 025 025![[thin space (1/6-em)]](https://www.rsc.org/images/entities/char_2009.gif) 950.51 950.51 |
4.20 | |
| Na1s | 1071.29 | 3.07 | 416![[thin space (1/6-em)]](https://www.rsc.org/images/entities/char_2009.gif) 265.68 265.68 |
3.91 | |
| C1s | 285.12 | 3.65 | 412![[thin space (1/6-em)]](https://www.rsc.org/images/entities/char_2009.gif) 560.43 560.43 |
1.12 | |
| Cl2p | 199.18 | 3.68 | 52![[thin space (1/6-em)]](https://www.rsc.org/images/entities/char_2009.gif) 932.52 932.52 |
0.41 |
In order to analyze the surface elemental valence and oxidation degree of the ultrafine copper powders in detail, Fig. 6 demonstrates the XPS spectra and Auger spectra of the micro- and nano-copper powders synthesized with different protectants at pH = 12.0. The binding energy of the C–C bond is used for charge correction based on 284.80 eV. Since the chemical composition and compositional content of Cu and Cu2O were differentiated by Cu LM2 spectra, the Cu and Cu2O peak positions in the Cu2p spectral line were very close to each other and indistinguishable. The C1s spectra of Fig. 6(a), (d), (h) and (k) revealed that the peaks of C all appeared at 284.80 eV, 286.00 ± 0.5 eV, and 288.40 ± 0.05 eV, which were attributed to C–C, C–O–C, and O–C![[double bond, length as m-dash]](https://www.rsc.org/images/entities/char_e001.gif) O, respectively, and may originate from the fact that the o-dihydroxyl group on the five-membered ring structure of C6H8O6 undergoes dehydrogenation and oxidation to generate the neighboring diketone structure, and the C–O bond is converted to C
O, respectively, and may originate from the fact that the o-dihydroxyl group on the five-membered ring structure of C6H8O6 undergoes dehydrogenation and oxidation to generate the neighboring diketone structure, and the C–O bond is converted to C![[double bond, length as m-dash]](https://www.rsc.org/images/entities/char_e001.gif) O and adsorbed on the surface of the generated ultrafine copper powders.27 The Cu LM2 spectra of Fig. 6(b), (e), (i) and (l) revealed that the more pronounced peak at 916.80 ± 0.5 eV was caused by unreduced Cu2O, and the characteristic peaks of Cu appeared as the main peak at 918.50 ± 0.5 eV and the satellite peak at 921.50 ± 0.5 eV.28 It is noteworthy that the characteristic peak of residual CuCl also appears at 913.61 eV in Fig. 6(l), but none of the peaks of CuO (917.7 eV) appear. The O on the surface of copper powders was analyzed to determine the degree of oxidation. It is seen from Fig. 6(c), (f), (j) and (m) that O is mainly derived from incompletely reduced Cu2O (530.50 ± 0.5 eV) and C
O and adsorbed on the surface of the generated ultrafine copper powders.27 The Cu LM2 spectra of Fig. 6(b), (e), (i) and (l) revealed that the more pronounced peak at 916.80 ± 0.5 eV was caused by unreduced Cu2O, and the characteristic peaks of Cu appeared as the main peak at 918.50 ± 0.5 eV and the satellite peak at 921.50 ± 0.5 eV.28 It is noteworthy that the characteristic peak of residual CuCl also appears at 913.61 eV in Fig. 6(l), but none of the peaks of CuO (917.7 eV) appear. The O on the surface of copper powders was analyzed to determine the degree of oxidation. It is seen from Fig. 6(c), (f), (j) and (m) that O is mainly derived from incompletely reduced Cu2O (530.50 ± 0.5 eV) and C![[double bond, length as m-dash]](https://www.rsc.org/images/entities/char_e001.gif) O in ascorbic acid (531.50 ± 0.5 eV). Among them, adsorbed water was also detected near 535.60 ± 0.20 eV in the copper powders without protectants and with SSC as a protectant, while it was absent from the surfaces of the copper powders with Met and CTAB as protectants, which was attributed to the methylthio group (CH3S–) in Met and the hydrophobic functional group (HO–) in CTAB as a hydrophobic functional group that hinders the adsorption of water, and further slows down the oxygen erosion.29 However, there is a weak peak attributed to C–O at 532.71 eV in Fig. 6(f), which is provided by a small amount of unoxidized hydroxyl oxygen in C6H8O6. A comprehensive evaluation of several protectants revealed that Met as a protectant resulted in the lowest level of oxidation.
O in ascorbic acid (531.50 ± 0.5 eV). Among them, adsorbed water was also detected near 535.60 ± 0.20 eV in the copper powders without protectants and with SSC as a protectant, while it was absent from the surfaces of the copper powders with Met and CTAB as protectants, which was attributed to the methylthio group (CH3S–) in Met and the hydrophobic functional group (HO–) in CTAB as a hydrophobic functional group that hinders the adsorption of water, and further slows down the oxygen erosion.29 However, there is a weak peak attributed to C–O at 532.71 eV in Fig. 6(f), which is provided by a small amount of unoxidized hydroxyl oxygen in C6H8O6. A comprehensive evaluation of several protectants revealed that Met as a protectant resulted in the lowest level of oxidation.
3.3 Characterization of the properties of ultrafine copper powders synthesized using Met as a protectant
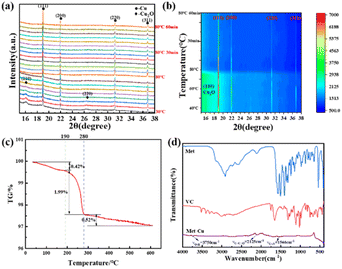
Based on the above results further in situ XRD observations, TG, and FT-IR analyses were carried out on the ultrafine copper powder particles prepared using Met as a protectant to study the growth transformation behavior of the ultrafine copper powder particles during the warming process. The in situ XRD and contour plots of the Cu reduction process are shown in Fig. 7(a) and (b). Due to the delayed nature of the in situ XRD observation of the experimental solution transfer, there is a lag in the observation of the process compared to the actual reaction, and thus the (111), (200), (220), and (311) diffraction peaks of the monatomic Cu, as well as the (110) and (200) diffraction peaks of the Cu2O, were observed in the initial stage after the adjustment of pH to 12.0. As the reaction temperature increased, the diffraction peak of Cu2O gradually disappeared, and only Cu2O(I) → Cu(0) transition was observed throughout the reaction, indicating that no other reactions occurred at this stage, further validating the accuracy of the pH–E diagram and the two-step reduction reaction.The thermal stability of Met-coated copper powder particles was investigated using thermogravimetric analysis in an N2 atmosphere as shown in Fig. 7(c). With the gradual increase in temperature, the surface of the copper powder particles gradually decomposed leading to weight loss, and the weight loss can be divided into three stages: 35–190 °C, 190–280 °C and 280–600 °C. Among them, the mass loss of copper powder particles in the stage below 190 °C can be attributed to the evaporation of adsorbed and residual water on the powder surface, with a weight loss of only 0.42%. The weight loss was most pronounced at the 190–280 °C stage, reaching 1.99%, considering that the organic matter covered on the surface is mainly the rapid decomposition of Met. The mass loss at the 280–600 °C stage is also largely insignificant at only 0.52%, which may be related to the slow decomposition of the residual organic matter (Met and C6H8O6) and trace amounts of Cu2O. The organic matter in the surface layer was verified by the FT-IR pattern of Fig. 7(d), where more pronounced absorption peaks were found at 3750 cm−1, 2125 cm−1, and 1546 cm−1, which corresponded to the O–H, C![[double bond, length as m-dash]](https://www.rsc.org/images/entities/char_e001.gif) C
C![[double bond, length as m-dash]](https://www.rsc.org/images/entities/char_e001.gif) O, and C
O, and C![[double bond, length as m-dash]](https://www.rsc.org/images/entities/char_e001.gif) N stretching vibrations. It is indicated that both C6H8O6 as the reducing agent and Met as the protectant are adsorbed on the surface of the ultrafine copper powder particles to different degrees, which also corresponds to the EDS energy spectra and TG results. The variability in particle size, morphology, and degree of oxidation can only originate from Met as a protectant since the same reductant and copper source were used.
N stretching vibrations. It is indicated that both C6H8O6 as the reducing agent and Met as the protectant are adsorbed on the surface of the ultrafine copper powder particles to different degrees, which also corresponds to the EDS energy spectra and TG results. The variability in particle size, morphology, and degree of oxidation can only originate from Met as a protectant since the same reductant and copper source were used.
The variation of resistivity of copper powder particles with sintering temperature after low-temperature sintering is shown in Fig. 8. The results show that the resistivity tends to decrease with the increase of sintering temperature. The resistivity is basically unchanged at 250 °C, being 52.0 ± 0.6 μΩ cm. When the sintering temperature is increased to 275 °C and above, the resistivity decreases dramatically, and it is only 21.4 μΩ cm at 325 °C. This is due to the increase of sintering temperature, which leads to the gradual decomposition of the organic matter on the surface of the copper powder particles, and the bare copper atoms with higher activity are more likely to diffuse to form a sintered neck, which in turn forms a continuous conductive pathway to make the resistivity drop, and the SEM images (Fig. S16†) of the sintered tissues support this result very well.
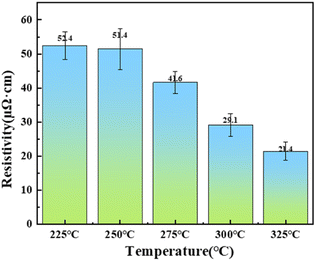 | ||
| Fig. 8 Variation of resistivity of copper powder sintered samples with sintering temperature (225 °C, 250 °C, 275 °C, 300 °C, 325 °C). | ||
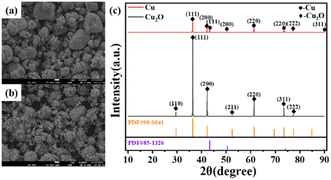
In order to discuss the influence of Cu2O as an intermediate product on the reduction process of Cu, we prepared ultrafine Cu powder particles by reduction under the same process conditions using purchased Cu2O with essentially the same particle size as the intermediate Cu2O product as the raw material; the morphology and phase composition before and after the comparative reduction are shown in Fig. 9. Fig. 9(a) is the SEM image of the purchased Cu2O particles, which is indicated as pure Cu2O powder by the XRD pattern in Fig. 9(c), corresponding to the diffraction peaks of the standard Cu2O (PDF#99-0041), and no other impurity phases were found. The morphology is irregular and the particle size is extremely heterogeneous with particle sizes in the range of <1–10 μm. Fig. 9(b) shows the SEM image after reduction, which shows the similarity of the morphology with that of Cu2O as the raw material, indicating that the reduction reaction has a certain morphology inheritance, and the difference lies in the small spherical particles of about 200 nm bonded on the surface of the irregular large particles. The XRD pattern in Fig. 9(c) shows that the reduction is incomplete, and diffraction peaks of the Cu2O physical phase are still found at 2θ angles of 36.36°, 42.24°, 61.32°, and 77.32°, which correspond to the (111), (200), (220), and (222) crystallographic planes of standard Cu2O (PDF#99-0041), respectively. Diffraction peaks corresponding to the (111), (200), (220), and (311) crystal faces of the standard Cu (PDF#85-1326) were also found at 2θ angles of 43.24°, 50.44°, 73.40° and 89.90°. Using the same process to compare the purchase of Cu2O and CuCl2·2H2O as raw materials for the preparation of copper powder experiments (Fig. 2). Indeed, Cu2O has a key role in regulating the reduction rate during the nucleation growth process.30 However, incomplete reduction occurs with Cu2O as the raw material, which suggests CuCl, the reduction product of the first stage product, plays a relatively important role in the process. This indicates further that CuCl also has a facilitating role in regulating the reduction rate, ensuring a moderate reaction rate, which leads to a more controllable morphology and higher homogeneity of the morphology of the ultrafine Cu powder particles.
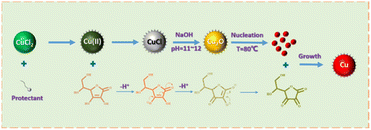
Based on the above results, the formation mechanism of the ultrafine Cu powder particles synthesized by the one-step secondary reduction method was hypothesized as shown in Fig. 10. More specifically, three key steps are involved, starting with CuCl2·H2O as the copper source and the addition of an organophilic ligand as a protectant to form a complex with Cu(II) and accompanying redox reactions throughout. When ascorbic acid (C6H8O6) with a conjugated structure is further added, one of the hydroxyl groups (–OH) in the o-dihydroxyl group on the ring structure ionizes, removing H+ and transferring a charge to the outer layer of the oxygen atom to form a ketone structure (C![[double bond, length as m-dash]](https://www.rsc.org/images/entities/char_e001.gif) O) with the carbon atom, resulting in the formation of semi-dehydroascorbic acid (C6H7O6).31 The reduction drive from the transfer of charge initially reduces Cu(II) to form CuCl as a refractory white product, which provides an initial reduction driving force for the reduction of Cu(II) to Cu(I) as the first reduction of a one-step secondary reduction process, and in addition, CuCl also serves as a solid precursor for the subsequent redox reaction that can gradually release Cu(II) ions to measure the rate of the reaction. Meanwhile, the organic ligand protector adsorbed on the surface of CuCl acting on Cu(I) causes it to exhibit an electrostatic effect and limits agglomeration.32 Afterward, with the addition of large amounts of NaOH to make the environment of the reaction solution change from strongly acidic to strongly alkaline quickly, CuCl cannot exist and combine with OH− to undergo a proton reaction so that it is transformed into Cu2O. As the redox reaction proceeds, one of the remaining hydroxyl groups (–OH) in the semi-dehydroascorbic acid (C6H7O6) also ionizes prompting further reduction of the highly reactive Cu2O(I) to form Cu(0). The monomer concentration of Cu(0) atoms gradually increases to reach the threshold of supersaturated concentration and it will undergo nucleation to form Cu nano fine crystals, and the formed dehydroascorbic acid (C6H6O6) is also adsorbed on Cu(0) through ligand bonding to avoid oxidization, and after that, the reduced Cu(0) atoms will undergo ordered growth based on Cu nano fine crystals. Electrostatic interactions between carbon chains with different organic ligands as protectants and Cu(0) lead to differences in the surface state of Cu particles exhibiting different particle size morphology and dispersion, followed by secondary aggregation growth of residual Cu(0) atoms through Oswald ripening. The reaction continues until the Cu(0) atoms are completely consumed and no more Cu in any other valence state remains, wherein the formation of bidentate complexes with strong complexation between Met as a protectant and Cu(II) ions can significantly modulate the nucleation and growth process of Cu particles as well as the degree of antioxidant resistance.
O) with the carbon atom, resulting in the formation of semi-dehydroascorbic acid (C6H7O6).31 The reduction drive from the transfer of charge initially reduces Cu(II) to form CuCl as a refractory white product, which provides an initial reduction driving force for the reduction of Cu(II) to Cu(I) as the first reduction of a one-step secondary reduction process, and in addition, CuCl also serves as a solid precursor for the subsequent redox reaction that can gradually release Cu(II) ions to measure the rate of the reaction. Meanwhile, the organic ligand protector adsorbed on the surface of CuCl acting on Cu(I) causes it to exhibit an electrostatic effect and limits agglomeration.32 Afterward, with the addition of large amounts of NaOH to make the environment of the reaction solution change from strongly acidic to strongly alkaline quickly, CuCl cannot exist and combine with OH− to undergo a proton reaction so that it is transformed into Cu2O. As the redox reaction proceeds, one of the remaining hydroxyl groups (–OH) in the semi-dehydroascorbic acid (C6H7O6) also ionizes prompting further reduction of the highly reactive Cu2O(I) to form Cu(0). The monomer concentration of Cu(0) atoms gradually increases to reach the threshold of supersaturated concentration and it will undergo nucleation to form Cu nano fine crystals, and the formed dehydroascorbic acid (C6H6O6) is also adsorbed on Cu(0) through ligand bonding to avoid oxidization, and after that, the reduced Cu(0) atoms will undergo ordered growth based on Cu nano fine crystals. Electrostatic interactions between carbon chains with different organic ligands as protectants and Cu(0) lead to differences in the surface state of Cu particles exhibiting different particle size morphology and dispersion, followed by secondary aggregation growth of residual Cu(0) atoms through Oswald ripening. The reaction continues until the Cu(0) atoms are completely consumed and no more Cu in any other valence state remains, wherein the formation of bidentate complexes with strong complexation between Met as a protectant and Cu(II) ions can significantly modulate the nucleation and growth process of Cu particles as well as the degree of antioxidant resistance.
4. Conclusions
In summary, we take an economical and simple green aqueous phase chemical reduction method for the synthesis of ultrafine copper powder particles through the use of ascorbic acid as a reductant and CuCl2·H2O as a copper source. Ultrafine copper particles with particle sizes ranging from 100 nm to 500 nm were successfully prepared. The pH–E diagrams under the Cu–Cl–H2O system were plotted by calculating the redox potentials in different pH environments, which clearly indicated the physical phase transition process of Cu(II) → Cu(0) in the presence of Cl ions, and provided a guide to the preparation process of ultrafine copper powders. For the above system, the one-step secondary reduction mechanism of the synthesis process was proposed, i.e., Cu(II) → CuCl(I) → Cu2O(I) → Cu(0), being revealed by means of pH–E plots, in situ XRD, and XPS. In addition, the Cu2O(I) → Cu(0) process of copper powder particles prepared with Met as a protectant was further observed by in situ XRD, and it was found that it did not involve any other physical phases and transformations, while it had higher particle size controllability, dispersibility, and antioxidant properties. The adsorbed Met and C6H8O6 molecules on the surface help to ensure the long-term stability of the copper powder particles and can be decomposed at lower temperatures (<280 °C), which theoretically does not affect the electron transport after low-temperature sintering. The resistivity can reach 21.4 μΩ cm when sintered at a temperature of 325 °C for 30 min. This green synthesis process facilitates the industrial scale-up and storage of ultrafine copper powders and that can be further applied in the field of copper-based electronic pastes.Author contributions
Z. W., J. G. Z. and X. K. conceived and designed the experiments; X. K. and B. Q. X. performed the SEM, TEM, and XRD experiments; X. K., B. Q. X., J. G. Z., and Z. W. analyzed the experimental data; X. K. wrote the paper; W. Y. L., Z. W., and J. W. W. revised the manuscript; the remaining authors contributed to refining the ideas, carrying out additional analyses, and finalizing this paper.Conflicts of interest
There are no conflicts to declare.Acknowledgements
This study was funded by the Special Key Project for Technological Innovation and Application Development in Chongqing (CSTB2022TIAD-KPX0027) and the National Key Research and Development Program of the Ministry of Science and Technology (2023YFB3812102, 2018YFE0204600), and we thank the Shanghai Light Source BL14B1 for its help with the in situ XRD experiments.References
- L. D. Carro, A. A. Zinn, P. Ruch, F. Bouville, A. R. Studart and T. Brunschwiler, J. Electron. Mater., 2019, 48, 6823–6834 CrossRef.
- S. J. Deng, X. Zhang, G. W. Xiao, K. Zhang, X. W. He, S. H. Xi, X. L. Liu, A. H. Zhong and Y. Chai, Nanotechnology, 2021, 32(31), 315710 CrossRef CAS PubMed.
- Y. B. Xiao, Y. Gao, Z. Q. Liu, R. Sun and Y. Liu, J. Mater. Sci.: Mater. Electron., 2022, 33, 12604–12614 CrossRef CAS.
- Q. Jiang, J. Yu, A. Li, T. Liu, Q. C. Jia, L. Z. Zhang and H. D. Zeng, Chem. Mater., 2023, 35, 6283–6293 CrossRef CAS.
- X. Ke, B. Q. Xie, Z. Wang, J. G. Zhang, J. W. Wang, Z. R. Li, H. J. He and L. M. Wang, J. Inorg. Mater., 2024, 39, 17–31 CrossRef.
- B. Abbas, Y. Mohammad, E. Jewell and J. Searle, J. Mater. Sci.: Mater. Electron., 2019, 30, 19917–19927 CrossRef CAS.
- D. Choi, S. Bae, H. Han, H. Park, M. Sim, Y. Kang, D. Kim, S. H. Kim and H. S. Lee, Sol. Energy Mater. Sol. Cells, 2023, 253, 112213 CrossRef CAS.
- J. Son, D. Y. Yu, Y. C. Kim, D. j. Byun and J. Bang, J. Electron. Mater., 2022, 51, 7326–7336 CrossRef CAS.
- W. Liu, H. Wang, K. S. Huan, C. M. Wang and A. T. Wu, J. Taiwan Inst. Chem. Eng., 2021, 125, 394–401 CrossRef CAS.
- H. O. Lee III, A. M. Vallejos, J. M. Rimsza, C. D. W. Chin, M. Ringgold, J. R. Nicholas and L. J. Treadwell, J. Mater. Sci., 2022, 57, 6167–6181 CrossRef CAS.
- A. Thacharon, W. S. Jang, J. Kim, J. Kang, Y. M. Kim and S. W. Kim, Adv. Sci., 2022, 9(26), 2201756 CrossRef CAS PubMed.
- C. Chen, S. Y. Cheng, T. L. Shi, Y. Zhong, Y. Y. Huang, J. J. Li, G. L. Liao and Z. R. Tang, Inorg. Chem., 2019, 58, 2533–2542 CrossRef CAS PubMed.
- M. F. E. Berry, S. A. Sadeek, A. M. Abdalla and M. Y. Nassar, Inorg. Nano-Met. Chem., 2020, 51, 1418–1430 CrossRef.
- Y. Zhang, C. Q. Cui, B. Yang, K. Zhang, P. L. Zhu, G. Li, R. Sun and C. P. Wong, J. Mater. Sci., 2018, 53, 12988–12995 CrossRef CAS.
- G. Granata, A. Onoguchi and C. Tokoro, Chem. Eng. Sci., 2019, 209, 115210 CrossRef CAS.
- H. W. Wang, S. H. Wu, Z. J. Peng, X. L. Wang, J. H. Lai and P. Qiu, ACS Sustain. Chem. Eng., 2023, 11, 9194–9205 CrossRef CAS.
- T. Zhang, W. Y. Hsieh, F. Daneshvar, C. Liu, S. P. Rwei and H. J. Sue, Nanoscale, 2020, 12, 17437–17449 RSC.
- Y. Shun, M. Kenichi, T. Hideyuki and K. Tohji, J. Mater. Chem. C, 2016, 4, 7494–7500 RSC.
- N. Kumar and L. S. B. Upadhyay, Appl. Surf. Sci., 2016, 385, 225–233 CrossRef CAS.
- H. J. Pereira, C. E. Killalea and D. B. Amabilino, ACS Appl. Electron. Mater., 2022, 4, 2502–2515 CrossRef CAS PubMed.
- T. Kato, Y. Takada, H. Okawa and K. Sugawara, J. Chem. Eng. Jpn., 2021, 54, 103–109 CrossRef CAS.
- L. S. B. Upadhyay and N. Verma, Bioprocess Biosyst. Eng., 2014, 37, 2139–2148 CrossRef CAS PubMed.
- Y. Shun, T. Hideyuki, I. Takashi, K. Motomiyaa and K. Tohji, Adv. Powder Technol., 2014, 25, 999–1006 CrossRef.
- J. Sun, J. J Zang, H. Li, X. M. Feng and Y. F. Shen, Mater. Chem. Phys., 2021, 259, 124017 CrossRef CAS.
- J. Park, V. Privman and E. Matijevic, J. Phys. Chem. B, 2001, 105, 11630–11635 CrossRef CAS.
- Z. Z. Tasic, M. B. P. Mihajlovic, M. B. Radovanovic and M. M. Antonijevic, Chem. Pap., 2019, 73(9), 2103–2132 CrossRef CAS.
- J. Xiong, Y. Wang, Q. J. Xue and X. D. Wu, Green Chem., 2011, 13(4), 900–904 RSC.
- S. Yokoyama, H. Takahashi, T. Itoh, K. Motomiya and K. Tohji, Appl. Surf. Sci., 2013, 264, 664–669 CrossRef CAS.
- T. Yang, W. G. Chen, X. Li, J. L. Song, L. L. Dong and Y. Q. Fu, Mater. Today Commun., 2021, 29, 102826 CrossRef CAS.
- X. Y. Hu, G. Li, P. L. Zhu, J. N. Tan, R. Sun and C. P. Wong, Nanotechnology, 2019, 30, 355601 CrossRef CAS PubMed.
- Y. Zhang, P. L. Zhu, G. Li, T. Zhao, X. Z. Fu, R. Sun, F. Zhou and C. P. Wong, ACS Appl. Mater. Interfaces, 2013, 6, 560–567 CrossRef PubMed.
- S. Yokoyama, K. Motomiya, H. Takahashi and K. Tohji, J. Mater. Chem. C, 2016, 4(31), 7494–7500 RSC.
Footnote |
| † Electronic supplementary information (ESI) available: The SEM plots and particle size changes of copper powder particles obtained by using different protectants prepared under different reaction conditions (PDF). See DOI: https://doi.org/10.1039/d3na01146a |
| This journal is © The Royal Society of Chemistry 2024 |

