DOI:
10.1039/D4NA00050A
(Paper)
Nanoscale Adv., 2024,
6, 2968-2979
First-principles study of a SiC nanosheet as an effective material for nitrosourea and carmustine anti-cancer drug delivery†
Received
18th January 2024
, Accepted 21st April 2024
First published on 22nd April 2024
Abstract
The development of novel nanosheet-based drug delivery systems requires a systematic understanding of the interactions between the drug and the nanosheet carrier under various physiological environments. In this work, we investigated electronic and quantum molecular descriptors of a SiC monolayer adsorbed with the anticancer drugs nitrosourea (NU) and carmustine (BCNU) using density functional theory (DFT). Our calculations revealed negative adsorption energies for both drugs, indicating a spontaneous and energetically favorable adsorption process. Density of states and orbital population analysis studies revealed that both drugs are capable of significantly (>30%) narrowing the gap between HOMO and LUMO, depending on the configuration of the adsorption complex. Furthermore, the electronic and quantum molecular descriptors were investigated in gas and water mediums to explore the effect of the solvent on the adsorption process. Our calculations predict a higher narrowing of the HOMO–LUMO gap in the water phase compared to the gas phase. Besides, a modest reduction in global hardness and a marked increase in the global electrophilicity index were observed after the adsorption of the drug molecules by the SiC nanosheet, indicating its high reactivity towards both NU and BCNU. Changing the medium to water showed a maximum 2× increase in the global electrophilicity index of the nanosheet for NU and a maximum 7× increase for BCNU. Additionally, the thermodynamic study of the adsorption process indicates that the formation energies at high temperatures are smaller than those at low temperatures, unfolding the potential of SiC nanosheet for application in the phototherapy of these drugs.
1 Introduction
Conventional drug delivery systems suffer from impeded target specificity, poor bioavailability, and organ toxicity.1,2 Additionally, low solubility, undesired tissue distribution, and poor pharmacokinetics of certain drugs necessitate the development of new and effective drug delivery systems3 that enable the controlled release of drug molecules at the targeted sites.4 Nanotechnology has revolutionized the field of medicine with specially designed nanostructures capable of delivering controlled drugs to disease-centered cells. These nanostructures can easily cross biomembranes and biobarriers because they are smaller in size and enhance the drug's intracorporeal half-life. Furthermore, design optimization of these nanostructures can ensure that the drug molecules interact selectively with the diseased cells. Consequently, it minimizes the unwanted ramifications of the drugs on other healthy tissues and organs. This would also allow a reduced drug dosage owing to the controlled release and the longer in vivo life span.5 These enable physicians to prescribe many therapeutic drugs that would not be possible to deliver to the targeted site using conventional approaches due to their toxicities.6
Cancer kills over 10 million people each year, making it one of the world's most common lethal diseases.7 Poor cell penetration, short circulating half-life, aggregation tendency, insolubility, poor bioavailability, high toxicity, and low target specificity often limit the efficacy of anticancer drugs.8,9 With the ability to protect, transport, and release therapeutic agents in a controlled amount at the desired target sites, nanostructure-assisted drug delivery methods can significantly improve the bioavailability and pharmacological properties of operable drugs.10,11
Nitrosourea (CH3N3O2) is one of the most ubiquitous classes of anticancer drugs for a diverse range of malignancies, including leukemia and solid tumors.12 Additionally, it is used to treat other malignancies, such as brain tumors, lymphomas, and Hodgkin's disease.13 However, bone marrow suppression, pulmonary fibrosis, hepatotoxicity, nausea and vomiting, myelosuppression, nephrotoxicity, neurotoxicity, and ocular toxicity are some of the adverse effects that have limited the use of this drug.14,15 Carmustine, a derivative of NU, with the formula C5H9Cl2N3O2, is an effective chemotherapeutic for treating brain tumors.16 However, conventional delivery of this drug has adverse side effects such as pulmonary fibrosis and hepatotoxicity.16 Nanosheets have shown great promise in recent reports, overcoming the adverse effects of drug toxicity and achieving high specificity and selectivity towards diseased cells.17 The large surface-to-volume ratio of these nanostructures provides a variety of anchoring points that enable high loading capacity of the active drug molecule.18 Furthermore, the physisorption or chemisorption ability of 2D materials with the drug molecules is higher than that of organic liposomes, enabling nanostructure-based drug carriers to release the drug sustainably.19 The unique interactions between drug molecules and the diverse chemical compositions of 2D materials allow external triggers for on-demand intelligent drug releasing.20
As a third-generation wide band gap semiconductor, silicon carbide (SiC) has attracted extensive interest because of its excellent chemical inertness, high electron mobility, and high catalytic activity.21,22 SiC has been extensively used in blood-contacting implants and cardiovascular and biomedical devices due to its excellent biocompatibility.23 SiC nanosheet offers structural stability, high solubility, biocompatibility, and other excellent properties such as blood compatibility, low density, and high rigidity, which makes it a highly attractive candidate for targeted drug delivery. Other than chlormethine;24 however, not much attention has been paid to SiC nanosheet as an effective carrier for drug delivery. Therefore, the main objective of the present work is to investigate the ability of SiC nanosheets to adsorb the two common anti-cancer drugs, nitrosourea and carmustine.
In this paper, we investigated the adsorption of NU and BCNU on the surface of the SiC nanosheet. We performed ab initio calculations to investigate the adsorption ability of the SiC nanosheet towards the NU and BCNU drugs. We analyzed the adsorption energies, adsorption distances, charge transfer, electron density (ED), molecular electrostatic potential (MEP), and Conductor-like Screening Model (COSMO) solvation maps to understand better the nature of interactions between the SiC nanosheet and the drug molecules. Moreover, we calculated the work function, quantum molecular descriptors (QMD), and density of states (DOS) to obtain further perceptions of adsorption mechanisms. Additionally, we studied the effect of solvent (water) and temperature on the adsorption behavior to assess the feasibility of SiC nanosheet in targeted phototherapy applications.
2 Computational methods
We utilized spin-polarized DFT to perform the geometry optimization, charge transfer, and energy calculations both in the gas and water phases via the DMol3 module of the Materials Studio 2020 software package25 to investigate the adsorption interactions between the SiC nanosheets and the drug molecules. The exchange–correlation interaction was described using the generalized gradient approximation (GGA) method with the Perdew–Burke–Ernzerhof (PBE) functional, and Grimme dispersion corrections were employed to accurately capture the effects of van der Waals (vdW) interactions. Additionally, we used DFT semi-core pseudopotential (DSPP) core treatment and a double-numerical basis set with a polarization function (DNP) basis set with basis file 4.4 for all atoms. We chose a 0.005 hartree (Ha) Fermi smearing with a 5.0 Å global orbital cutoff for all the computations to lessen the simulation time and improve performance.26 Additionally, we investigated the impact of water as a solvent on the adsorption process using the COSMO (Conductor-like Screening Model) method.27 In this case, we used a dielectric constant of 78.54 for water.28 Besides, we analyzed the electron density and molecular electrostatic potential isosurfaces to gain insight into the interaction of the drug molecules with the SiC nanosheet.
The adsorption energy (Ead) associated with the interaction of NU and BCNU drug molecules with the SiC nanosheet was calculated using the following equation,11,29
| | | Ead = ENU/BCNU+Nanosheet − ENanosheet − ENU/BCNU, | (1) |
where,
ENU/BCNU+Nanosheet,
ENanosheet and
ENU/BCNU represent the total electronic energies of the optimized nanosheet/drug complex, isolated SiC nanosheet, and isolated NU/BCNU drug molecule, respectively.
We optimized the structures' geometry with a maximum force tolerance of 0.003 eV Å−1. We presented the adsorption energies calculated at −273.15 °C (=0 K) without zero-point energy correction and with temperature dependence, which we evaluated by calculating Gibbs energies for gas-phase and water-phase. As a part of our investigation of the electronic properties, we calculated the energies of the highest occupied molecular orbitals (HOMO) and the lowest unoccupied molecular orbitals (LUMO). The energy gap between HOMO and LUMO referred to as Eg, can serve as an important indicator for the adsorption process and was calculated according to the formula,
| | | Eg = −(EHOMO − ELUMO), | (2) |
where
EHOMO and
ELUMO are the energies of the HOMO and the LUMO, respectively.
Change in Eg reveals the electronic sensitivity of the nanosheets towards the NU and BCNU drugs and is quantified as follows,
| | | % ΔEg = [(Egf − Egi)/Egi] × 100, | (3) |
where
Egi and
Egf refer to the values of the energy gap (
Eg) of the SiC nanosheet before and after the adsorption of NU or BCNU drug, respectively.
Moreover, we calculated quantum molecular descriptors (QMDs) such as electronic chemical potential (μ), global hardness (η), global softness (S), and global electrophilicity index (ω) to investigate the chemical reactivity and stability of the SiC nanosheet after the adsorption of NU and BCNU drugs. The QMDs were calculated using the following equations,
| | | μ = (EHOMO + ELUMO)/2, | (4) |
| | | η = (ELUMO − EHOMO)/2, | (5) |
3 Results and discussion
3.1 Adsorption of NU and BCNU on SiC nanosheet
We optimized the geometries of isolated SiC nanosheet, NU, and BCNU drug molecules both in water and gas phases. The structural parameters were consistent with the previous reports.30–32 To analyze the interaction between the SiC nanosheet and the drug molecules NU and BCNU, we calculated the adsorption energies (Ead) and charge transfer (ΔQ) between the drug and nanosheet and tabulated them in Table 1. By changing the relative orientation of the drug molecule with the nanosheet, we considered six different probable initial configurations for the adsorption of the drug molecules on the SiC surface. The molecule of NU parallel to the SiC nanosheet was referred to as S1 configuration (Fig. 1(a)), while the NU molecule perpendicular to the SiC nanosheet with the O1 atom pointing towards the nanosheet was designated as S2 configuration (Fig. 1(b)) and the NU molecule perpendicular to the SiC nanosheet with the H atom of N3 towards the nanosheet was labeled as S3 configuration (Fig. 1(c)). S4, S5, and S6 configurations were similar to the S1, S2, and S3 configurations, except, in these configurations, drug molecules were symmetrically placed on both sides of the nanosheet (Fig. 1(d)–(f)). The SiC/BCNU complexes were also named similarly. However, in S2 and S3 configurations of SiC/BCNU complexes (Fig. 2(b) and (c)), the Cl2 and O2 atoms of the BCNU drug molecule perpendicularly faced the SiC nanosheet, respectively.
Table 1 The minimum adsorption distance (d) in Å, adsorption energy (Ead) in eV, and charge transfer (ΔQ) in (e) between NU/BCNU drug molecule(s) and nanosheet in both gas and water phases. Two values in the d column refer to the minimum distances between the nanosheet and drug molecules on both sides for the double-sided configurations
| Complex |
Configuration |
Gas phase |
Water phase |
|
d (Å) |
E
ad (eV) |
ΔQ (e) |
d (Å) |
E
ad (eV) |
ΔQ (e) |
| SiC/NU |
S1 |
1.985 |
−0.470 |
0.002 |
1.964 |
−0.199 |
−0.068 |
| S2 |
1.912 |
−0.982 |
−0.004 |
1.928 |
−0.463 |
−0.066 |
| S3 |
1.869 |
−0.836 |
0.117 |
1.855 |
−0.514 |
0.194 |
| S4 |
1.948, 3.178 |
−0.813 |
−0.037 |
1.969, 2.308 |
−0.011 |
−0.128 |
| S5 |
1.985, 1.852 |
−1.749 |
0.033 |
1.884, 2.012 |
−0.033 |
0.146 |
| S6 |
1.790, 1.836 |
−1.998 |
0.210 |
1.849, 1.860 |
−0.032 |
0.353 |
| SiC/BCNU |
S1 |
2.868 |
−0.799 |
−0.085 |
2.881 |
−0.553 |
−0.064 |
| S2 |
3.358 |
−0.208 |
0.008 |
3.363 |
−0.134 |
0.019 |
| S3 |
1.850 |
−0.892 |
−0.076 |
1.870 |
−0.646 |
−0.007 |
| S4 |
1.878, 3.104 |
−1.865 |
−0.303 |
1.926, 2.863 |
−1.146 |
−0.275 |
| S5 |
2.573, 3.214 |
−1.220 |
−0.035 |
1.827, 3.188 |
−0.844 |
0.051 |
| S6 |
1.855, 1.904 |
−1.828 |
−0.054 |
1.886, 1.934 |
−1.263 |
0.084 |
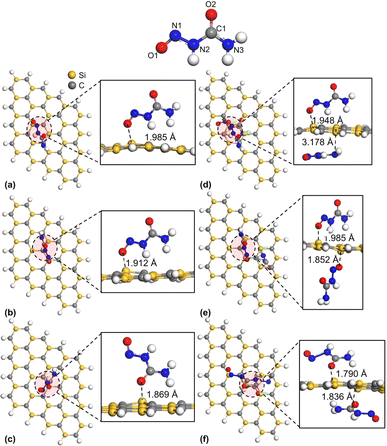 |
| | Fig. 1 Top and side views of optimized structures of (a) S1, (b) S2, (c) S3, (d) S4, (e) S5, and (f) S6 configurations of SiC/NU complexes. An annotated structure of the NU drug molecule is demonstrated on top. | |
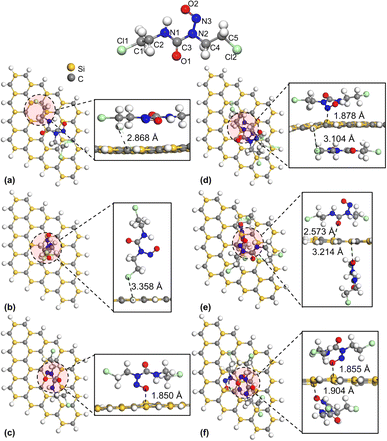 |
| | Fig. 2 Top and side views of optimized structures of (a) S1, (b) S2, (c) S3, (d) S4, (e) S5, and (f) S6 configurations of SiC/BCNU complexes. An annotated structure of the BCNU drug molecule is demonstrated on top. | |
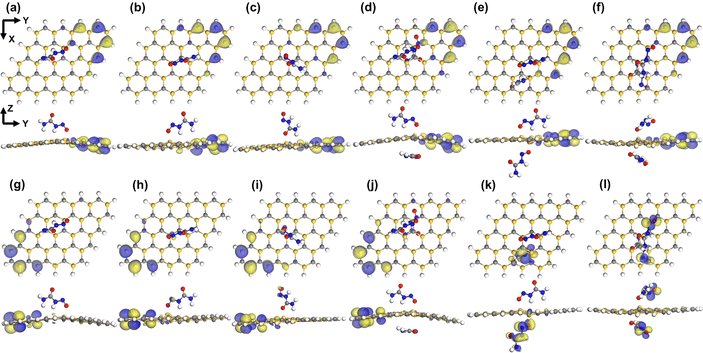 |
| | Fig. 3 Top and side views of HOMO ((a)–(f)) and LUMO ((g)–(l)) maps (isovalue = 0.3 a.u.) for S1–S6 configurations of SiC/NU complexes, respectively. | |
A positive adsorption energy indicates an endothermic reaction, while a negative adsorption energy characterizes an exothermic reaction. In our calculations for adsorption energy, we found negative Ead across all configurations of both SiC/NU and SiC/BCNU complexes, which indicates the high possibility of NU and BCNU drug adsorption in SiC. This also revealed the adsorption process's exothermic and geometrically stable nature.33. |Ead| < 1 eV indicates physical adsorption, whereas chemical adsorption is indicated by |Ead| > 1 eV.34,35 Therefore, for NU drug molecule, the configurations S2 and S3 showed strong physical adsorption, while S1 exhibited weak physisorption. Among the both-sided configurations (S4–S6), S4 showed strong physisorption, while the other adsorptions were chemisorption with Ead much higher than 1 eV. Similarly, for SiC/BCNU complexes, our studied configurations S1 and S3 showed strong physisorption, while S2 demonstrated weak physisorption. On the other hand, when the drug molecule was adsorbed on both sides (S4–S6), the adsorption energies were higher than 1 eV, indicating chemisorption.
We used Hirshfeld charge analysis to calculate the net charge transfer (ΔQ) during the interaction between the SiC nanosheet and the drug molecules using the following equation,36
| | | ΔQ = Qf(drug) − Qi(drug) | (8) |
where,
Qf(drug) and
Qi(drug) refer to the charges on the drug molecule after and before being adsorbed on the nanosheet, respectively. Prior to the adsorption process, the drug molecule was charge neutral; however, after being adsorbed, charge transfers due to the interaction between the drug molecule and the nanosheet resulted in the loss of charge neutrality. A positive net charge indicates the loss of electrons from the drug molecule to the nanosheet, while the opposite is true for a negative net charge. Our results implied that a negligible amount of negative charge was transferred to the drug molecule in the S1 and S4 configurations for NU. The other configurations acted as electron donors since they gained positive charges. Among them, S3 and S6 stood out with significant charge transfers of 0.117(
e) and 0.210(
e). For BCNU, except for S2, all other configurations gained negative charge, which means they acted as electron acceptors during adsorption. Among all the configurations, S4 stood out with a significant charge transfer of −0.303(
e).
Adsorption energy and charge transfer studies performed in the gas phase revealed very similar performance of the SiC nanosheet for both NU and BCNU drugs with average Ead of −1.141 eV and −1.135 eV, respectively, and average ΔQ of 0.053(e) and −0.091(e), respectively. This indicated that the SiC nanosheet was slightly more sensitive towards the BCNU drug in the gas medium. However, similar studies performed in the water medium reveal that for NU and BCNU, the average Ead was −0.209 eV and −0.764 eV respectively, and the average ΔQ was 0.072(e) and 0.032(e), respectively. This indicated that in the water medium, the adsorption of BCNU was much stronger than that of NU.
Additionally, the HOMO–LUMO gap was investigated as a sensitivity marker for NU and BCNU absorption in the SiC nanosheet. The energy gap between HOMO and LUMO before and after the adsorption process is reported in Table 2. The results suggested that in the gas phase, the adsorption of NU on the SiC nanosheet did not alter the HOMO significantly, as shown in Table 2. The maximum changes in HOMO and LUMO were observed in S4 and S5 configurations (around 2% change in HOMO and 5% change in LUMO). Unsurprisingly, the largest changes in the HOMO–LUMO gap also belonged to the S4 and S5 configurations. Apart from S2 and S3, all other configurations of SiC/NU showed decreased HOMO–LUMO gap. The large changes in the HOMO–LUMO gap belonged to S4, S6, and S3 configurations for the BCNU drug molecule. Among these configurations, the S4 configuration showed the largest change in both HOMO (≈7%) and LUMO (≈13%), leading to around 58% decrease in the HOMO–LUMO gap. Additionally, for SiC/BCNU complexes, apart from S1, S2, and S5, all other configurations showed a significantly narrowed HOMO–LUMO gap. However, the scenario changed dramatically in the water medium, where all SiC/NU complexes showed significant narrowing (>20%) of the HOMO–LUMO gap. For SiC/BCNU complexes, apart from S1 and S2, the other configurations demonstrated significant narrowing of the HOMO–LUMO gap.
Table 2 The energy of HOMO (EHOMO), LUMO (ELUMO) and the energy gap between HOMO–LUMO (Eg) in eV, and the change in energy gap (% ΔEg) across all configurations of SiC/NU and SiC/BCNU in both gas and water phases
| Complex |
Configuration |
Gas phase |
Water phase |
|
E
HOMO (eV) |
E
LUMO (eV) |
E
g (eV) |
% ΔEg |
E
HOMO (eV) |
E
LUMO (eV) |
E
g (eV) |
ΔEg(%) |
| SiC |
— |
−4.032 |
−3.707 |
0.325 |
— |
−4.395 |
−3.501 |
0.894 |
— |
| SiC/NU |
S1 |
−4.090 |
−3.802 |
0.288 |
−11.385 |
−4.446 |
−3.946 |
0.500 |
−44.072 |
| S2 |
−4.150 |
−3.771 |
0.379 |
16.615 |
−4.520 |
−3.983 |
0.537 |
−39.933 |
| S3 |
−4.021 |
−3.671 |
0.350 |
7.692 |
−4.417 |
−3.770 |
0.647 |
−27.629 |
| S4 |
−4.116 |
−3.852 |
0.264 |
−18.769 |
−4.435 |
−3.853 |
0.582 |
−34.899 |
| S5 |
−4.119 |
−3.911 |
0.208 |
−36.000 |
−4.564 |
−4.213 |
0.351 |
−60.738 |
| S6 |
−4.095 |
−3.792 |
0.303 |
−6.769 |
−4.527 |
−4.107 |
0.420 |
−53.020 |
| SiC/BCNU |
S1 |
−4.059 |
−3.730 |
0.329 |
1.231 |
−4.419 |
−3.611 |
0.808 |
−9.620 |
| S2 |
−4.049 |
−3.720 |
0.329 |
1.231 |
−4.392 |
−3.505 |
0.887 |
−0.783 |
| S3 |
−4.153 |
−3.901 |
0.252 |
−22.462 |
−4.526 |
−4.144 |
0.382 |
−57.271 |
| S4 |
−4.312 |
−4.176 |
0.136 |
−58.154 |
−4.717 |
−4.530 |
0.187 |
−79.083 |
| S5 |
−4.057 |
−3.702 |
0.355 |
9.231 |
−4.392 |
−3.667 |
0.725 |
−18.904 |
| S6 |
−4.187 |
−3.978 |
0.209 |
−35.692 |
−4.551 |
−4.227 |
0.324 |
−63.758 |
Generally, a lower Eg is associated with enhanced polarizability and reduced kinetic stability, leading to higher chemical reactivity.37 Moreover, this energy gap is connected to the number of conduction electrons with the following relation,38
| | | N = AT3/2exp(−Eg/2kBT), | (9) |
where
kB refers to Boltzmann's constant and
A signifies another constant. According to this equation, a change in
Eg will exponentially affect the number of electrons. Hence, as observed here, the widening of the HOMO–LUMO gap will cause a dramatic reduction in the conduction current. Hence, the change in electrical conductivity can aid in detecting the NU and BCNU drugs.
3.2 Quantum molecular descriptors
We calculated and reported the chemical potential, global hardness, global softness, and global electrophilicity index quantum molecular descriptors (QMD) in Table 3 to gain further insights into the reactivity and stability changes of SiC nanosheets after NU and BCNU drug adsorption. The electronic chemical potential, μ, characterizes the escaping tendency of an electron from equilibrium.39 Higher chemical reactivity is indicated by a more negative value of chemical potential.40 For gas medium, after the NU drug adsorption process, the chemical potential of the SiC nanosheet showed a maximum 3.74% increase in value (S5) with a mean increase of around 2%. For the BCNU drug, the S4 configuration showed a maximum 9.6% reduction in chemical potential with a mean reduction of around 3.4%. The reactivity of the SiC nanosheet was enhanced following the adsorption of the BCNU compared to its reactivity with the NU. Global hardness (η) refers to the resistance of a chemical structure to deformation under an external electric field. An increased value of global hardness is associated with enhanced chemical stability of a structure and, subsequently, a decrease in the chemical reactivity.41 While configurations S2 and S3 exhibited increased global hardness after NU adsorption, there was only a mere 8.6% average reduction in global hardness for the SiC/NU complexes, showing high stability of the adsorption process. As for the BCNU drug, configurations S3, S4, and S6 demonstrated reduced global hardness, resulting in a mean 18% reduction for SiC/BCNU complexes. This further confirmed the higher reactivity of SiC following BCNU adsorption. Global hardness and global softness are negatively correlated.42 Higher global softness coupled with lower global hardness implies higher chemical reactivity of the nanosheet towards the drug. As such, the SiC/NU S5 and SiC/BCNU S4 configurations showed enhanced reactivity of the nanosheet towards the drug molecules and, therefore, were the most suitable for adsorption. The global electrophilicity index (ω) encapsulates the electrophilic nature of the complexes, and a larger value of ω points towards enhanced reactivity of the nanosheet towards the drug molecules.43 The calculated value of ω was 46.07 for the SiC nanosheet. After the adsorption of the NU and BCNU drugs, there was a mean increase of 18.17% and 48.65%, respectively, in the global electrophilicity index. Similarly, the nanosheet's reactivity towards both drugs was enhanced when the medium was changed to water.
Table 3 Quantum molecular descriptors such as chemical potential (μ), global hardness (η), global softness (S), and global electrophilicity index (ω) of all the SiC/NU and SiC/BCNU complexes in both gas and water phases
| Complex |
Configuration |
Gas phase |
Water phase |
|
μ
|
η
|
S
|
ω
|
μ
|
η
|
S
|
ω
|
| SiC |
|
−3.870 |
0.163 |
3.077 |
46.071 |
−3.948 |
0.447 |
1.119 |
17.435 |
| SiC/NU |
S1 |
−3.946 |
0.144 |
3.472 |
54.066 |
−4.196 |
0.250 |
2.000 |
35.213 |
| S2 |
−3.961 |
0.190 |
2.639 |
41.387 |
−4.252 |
0.269 |
1.862 |
33.660 |
| S3 |
−3.846 |
0.175 |
2.857 |
42.262 |
−4.094 |
0.324 |
1.546 |
25.899 |
| S4 |
−3.984 |
0.132 |
3.788 |
60.122 |
−4.144 |
0.291 |
1.718 |
29.506 |
| S5 |
−4.015 |
0.104 |
4.808 |
77.501 |
−4.389 |
0.176 |
2.849 |
54.869 |
| S6 |
−3.944 |
0.152 |
3.300 |
51.324 |
−4.317 |
0.210 |
2.381 |
44.373 |
| SiC/BCNU |
S1 |
−3.895 |
0.165 |
3.040 |
46.101 |
−4.015 |
0.404 |
1.238 |
19.951 |
| S2 |
−3.885 |
0.165 |
3.040 |
45.864 |
−3.949 |
0.444 |
1.127 |
17.577 |
| S3 |
−4.027 |
0.126 |
3.968 |
64.352 |
−4.335 |
0.191 |
2.618 |
49.194 |
| S4 |
−4.244 |
0.068 |
7.353 |
132.438 |
−4.624 |
0.093 |
5.348 |
114.314 |
| S5 |
−3.880 |
0.178 |
2.817 |
42.396 |
−4.030 |
0.363 |
1.379 |
22.396 |
| S6 |
−4.083 |
0.105 |
4.785 |
79.745 |
−4.389 |
0.162 |
3.086 |
59.455 |
Table 4 The Fermi level energies (EF), work functions (Φ), and work function variations (% ΔΦ) for all the SiC/NU and SiC/BCNU complexes before and after the adsorption of the drug molecules, in both gas and water phases
| Complex |
Configuration |
Gas phase |
Water phase |
|
E
F (eV) |
Φ (eV) |
% ΔΦ |
E
F (eV) |
Φ (eV) |
% ΔΦ |
| SiC |
|
−3.870 |
3.870 |
— |
−3.948 |
3.948 |
— |
| SiC/NU |
S1 |
−3.946 |
3.946 |
1.977 |
−4.196 |
4.196 |
6.282 |
| S2 |
−3.961 |
3.961 |
2.352 |
−4.252 |
4.252 |
7.687 |
| S3 |
−3.846 |
3.846 |
−0.607 |
−4.094 |
4.094 |
3.685 |
| S4 |
−3.984 |
3.984 |
2.959 |
−4.144 |
4.144 |
4.965 |
| S5 |
−4.015 |
4.015 |
3.760 |
−4.389 |
4.389 |
11.158 |
| S6 |
−3.944 |
3.944 |
1.912 |
−4.317 |
4.317 |
9.347 |
| SiC/BCNU |
S1 |
−3.895 |
3.895 |
0.646 |
−4.015 |
4.015 |
1.697 |
| S2 |
−3.885 |
3.885 |
0.388 |
−3.949 |
3.949 |
0.013 |
| S3 |
−4.027 |
4.027 |
4.070 |
−4.335 |
4.335 |
9.802 |
| S4 |
−4.244 |
4.244 |
9.678 |
−4.624 |
4.624 |
17.110 |
| S5 |
−3.880 |
3.880 |
0.258 |
−4.030 |
4.030 |
2.064 |
| S6 |
−4.083 |
4.083 |
5.505 |
−4.389 |
4.389 |
11.170 |
3.3 Work function
We investigated the effect of NU and BCNU adsorption on the SiC nanosheet by observing the variation in its Fermi level and work function. The work function, Φ is the necessary energy for an electron to escape from the Fermi level to a vacuum level infinite distance away from the surface.44 The Φ can be described mathematically as follows:45where the Fermi energy is denoted with EF and Vel(+∞) is the electrostatic potential energy of an electron infinite distance away from the material's surface, which is assumed to be zero. Hence, the expression of the work function simplifies to, Φ = −EF. The change of Φ after the NU or BCNU drug adsorption can be calculated as follows:| |  | (11) |
where Φi and Φf indicate the SiC nanosheet work function values before and after the drug adsorption process, respectively.
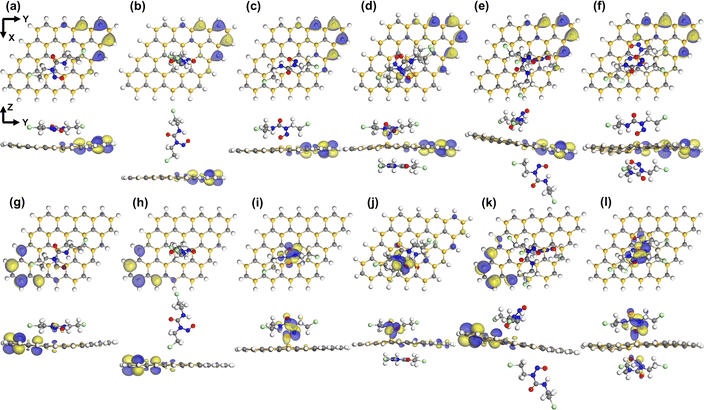 |
| | Fig. 4 Top and side views of HOMO ((a)–(f)) and LUMO ((g)–(l)) maps (isovalue = 0.3 a.u.) for S1–S6 configurations of SiC/BCNU complexes, respectively. | |
The Fermi level energies (EF), work functions (Φ), and work function variations (% ΔΦ) for all the SiC/NU and SiC/BCNU complexes before and after the adsorption of the drug molecules, in both gas and water phases are presented in Table 4. We observed that the work function changed ever so slightly due to the adsorption of NU on the SiC nanosheet, with the most favorable S5 configuration showing a mere 3.76% increase. However, for BCNU adsorption, the change in work function was more pronounced, with both S4 and S6 configurations showing 5.5% and 9.7% increases, respectively. Changing the medium to water enhanced the trend observed in the gas phase. For NU, both S5 and S6 show around 10% increase in work function, while for BCNU, the S6 configuration showed 11.17% increase, and S4 showed an increase of 17.11%. The variation of Φ and EF of the SiC nanosheet due to the adsorption of NU or BCNU will result in an alteration in its field emission properties, which can be exploited to make Φ-type sensors for the drug.46 The work function variation is illustrated in Fig. 5.
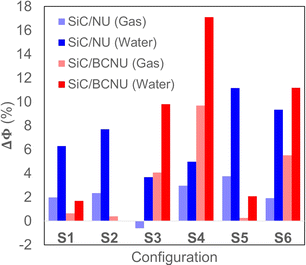 |
| | Fig. 5 Work function variation for different configurations of SiC/NU and SiC/BCNU in both gas and water phases. | |
3.4 Electron density and molecular electrostatic potential
Fig. 6 exhibits the electron density of the SiC/NU and SiC/BCNU complexes in the gas phase. For NU adsorption on the SiC nanosheet, the electron density was shared between the nanosheet and the drug molecule, indicating a strong interaction between the two. However, in the S4 configuration, only one of the drug molecules interacted with the nanosheet. For other double-sided SiC/NU complex configurations, electron density was shared with the nanosheet by both drug molecules. Among SiC/BCNU complexes, S3, S6, and S4 configurations showed strong interactions with the nanosheet. We observed no overlap in the electron densities for the rest of the SiC/BCNU complexes, indicating a weaker interaction.
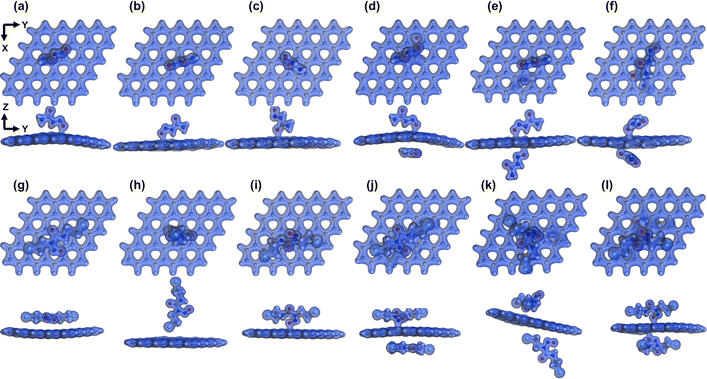 |
| | Fig. 6 Electron density isosurfaces in gas phase (isovalue = 0.3 e Å−3) for SiC/NU complexes: (a) S1, (b) S2 (c) S3 (d) S4 (e) S5 and (f) S6 and SiC/BCNU complexes: (g) S1, (h) S2 (i) S3 (j) S4 (k) S5 and (l) S6. | |
MEP plots can reveal important insights regarding the adsorption behavior of the drug molecules on the SiC nanosheet. The MEP plots provide further insights into the charge transfer phenomena besides the Hirshfeld charge analysis we reported in Section 3.1. As we can see from Fig. 7(a)–(f), the O atom of NU was highly electronegative when they were away from the nanosheet. However, for S3 and S6 complexes (Fig. 7(a) and (f)), the oxygen atoms were heavily depleted of electrons. This finding is consistent with our charge transfer analysis, where we predicted +0.117e and +0.210e on the drug molecules. For the BCNU drug molecule, as shown in Fig. 7(h) and (k), apart from the highly negative O atoms, the Cl atoms were also highly electronegative, when they were away from the SiC nanosheet. However, from Fig. 7(j), we see that both the oxygen and Cl atoms exhibited negative potential, indicating that the drug molecules had drawn electrons from the nanosheet, leading to a negative charge transfer. This also agreed with our charge transfer study, where we observed a significant −0.303e charge on the drug molecule.
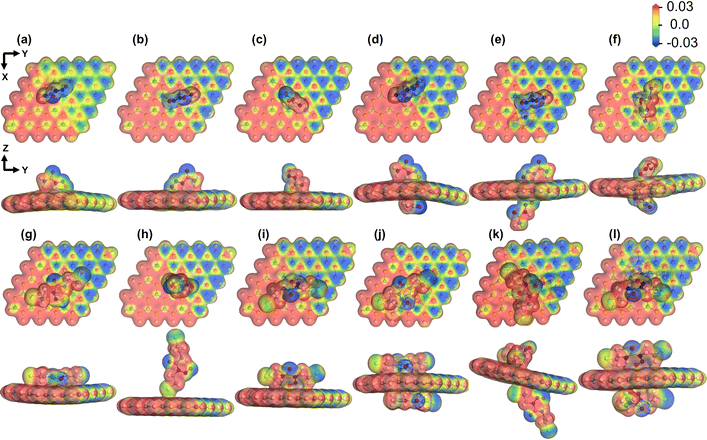 |
| | Fig. 7 Molecular electrostatic potential isosurfaces (isovalue = 0.03 a.u.) in gas phase for SiC/NU complexes (a) S1, (b) S2 (c) S3 (d) S4 (e) S5 and (f) S6, and SiC/BCNU complexes (g) S1, (h) S2 (i) S3 (j) S4 (k) S5 and (l) S6. The color red indicates a maximum potential of +0.03 a.u., and the color blue indicates a minimum potential of −0.03 a.u. | |
3.5 COSMO surface study
There is a high probability that drug/nanosheet complexes administrated into the body are surrounded by water molecules. Hence, investigating the effect of solvent media on drug adsorption behavior is vital for assessing the in vivo feasibility of nanosheet-assisted drug delivery systems. In our previous sections, the impact of the solvent (water) was discussed in the context of electronic properties like the HOMO–LUMO gap and work function. We analyzed the COSMO surfaces and observed the polarities of the complexes in order to gain further insights into the role of solvent media in the adsorption process. Fig. S1(f), (l), and (r) of ESI† illustrate the COSMO isosurfaces of the geometry-optimized nanosheet, NU, and BCNU drugs while Fig. 8 report the same for our nanosheet/drug complexes. The hydrogen bond acceptor (HBA) regions are indicated by the color red, whereas the blue segments highlight the hydrogen bond donor (HBD) regions. In both cases, the HBA regions were centered around highly electronegative atoms like oxygen and chlorine. The non-polar region on the molecules is depicted by the color yellow. As evident in Fig. 8, the drug molecule tended to settle between the positive and the negative portions of the nanosheet, denoting that the adsorption of the drug molecules did not significantly alter its polarity.
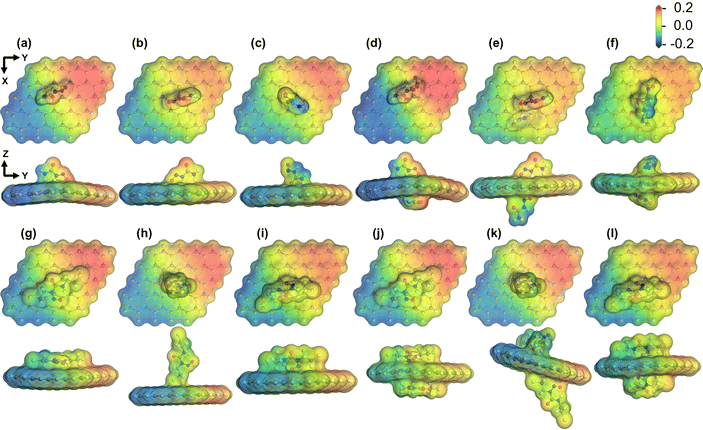 |
| | Fig. 8 COSMO surfaces (isovalue = 0.2 e Å−3) for SiC/NU complexes (a) S1, (b) S2 (c) S3 (d) S4 (e) S5 and (f) S6 and SiC/BCNU complexes (g) S1, (h) S2 (i) S3 (j) S4 (k) S5 and (l) S6. | |
3.6 Density of states
The findings in Table 2 are echoed in the density of states (DOS) plots. The adsorption of BCNU molecule did not significantly alter the HOMO energy levels. As show in Fig. 9(a), (c) and (i), there was no noticeable change in Eg of SiC/BCNU complexes S1, S2 and S5. However, complexes S3, S4 and S5 showed significant changes in Eg. For the SiC/BCNU S4 complex, we noticed new peaks right below EF, which can be attributed by the contribution of the top BCNU drug molecule to HOMO, as seen in Fig. 4(d). A shift in the HOMO peaks near EF was observed for complex S6, which can be explained by the contribution from the SiC nanosheet near the adsorption zone, as seen in Fig. 4(f). Change in LUMO peaks beyond EF were prevalent among all the complexes that exhibited narrowed Eg, and these can be attributed to the contribution of the drug molecule to the LUMO orbitals. For SiC/NU complexes, a slight widening of Eg was observed for configurations S2 and S3 (Fig. 9(d) and (f)). For the rest of the configurations, narrowing of Eg was prevalent. Similar to the case for SiC/BCNU complexes, the narrowing of Eg in SiC/NU complexes can be attributed to the contribution of the drug molecule to the LUMO orbitals. For complexes S4 and S5, there was a significant shift of HOMO peaks near EF, which can be explained by the more pronounced contribution of the SiC nanosheet to HOMO orbitals, as seen from Fig. 3(e) and (f).
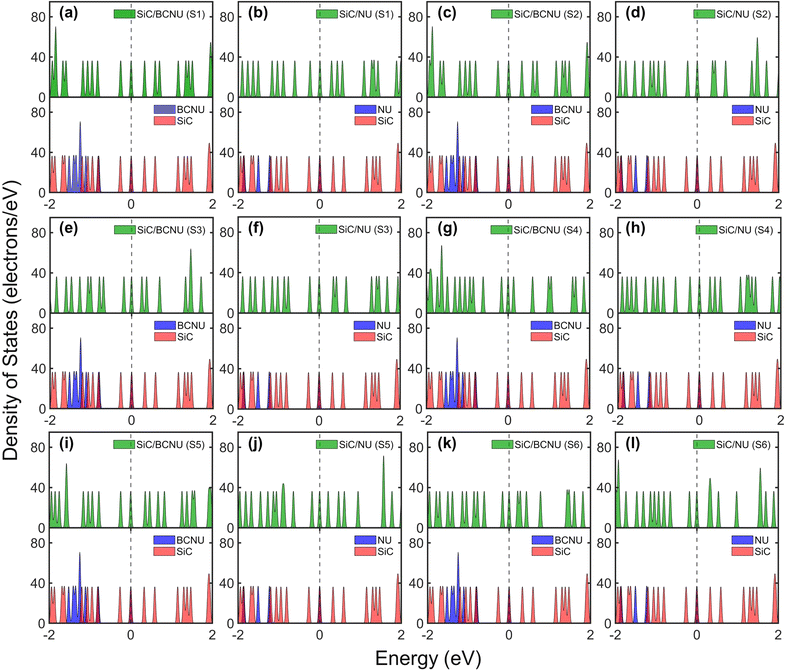 |
| | Fig. 9 Total and partial density of states for (a) SiC/BCNU S1 (b) SiC/NU S1, (c) SiC/BCNU S2 (d) SiC/NU S2, (e) SiC/BCNU S3 (f) SiC/NU S3, (g) SiC/BCNU S4 (h) SiC/NU S4, (i) SiC/BCNU S5 (j) SiC/NU S5, (k) SiC/BCNU S6 and (l) SiC/NU S6 complexes. The top panel shows the total DOS for the complex and the bottom panel shows the individual DOS of the SiC nanosheet and the drug molecule. | |
3.7 Temperature dependence of adsorption energy
An important aspect of the SiC nanosheet's feasibility as a nanocarrier for NU and BCNU drugs is its temperature-dependent adsorption behavior. The efficacy of the SiC nanosheet as a carrier for the anticancer drugs nitrosourea and carmustine depends on two factors (i) how favorably the drug molecule can be adsorbed to the nanosheet and (ii) how easily the drug molecule can be desorbed from the nanosheet in vivo. The first component can be assessed from the low-temperature behavior of the adsorption process. There is a certain temperature below which the adsorption process is spontaneous and energetically favorable, which facilitates the loading of the drug molecules into the nanosheet through physisorption or chemisorption. After the drug molecule was adsorbed into the nanosheet, photothermal therapy (application of light/heat) can temporarily raise the localized temperature above the normal human body temperature of 310 K. In order to capture these effects, we performed the temperature dependent study for a wide range of temperature starting from 100 K to 350 K. In the water phase, as depicted in Fig. 10(a), for SiC/NU complexes, the adsorption process remained spontaneous and exothermic at temperatures ranging from 100 K to 350 K for configurations S2, S3, S5, and S6. Configurations S1 and S4 demonstrated endothermic adsorption starting from around 200 K. For SiC/BCNU complexes, the adsorption process for configurations S1, S3, and S6 maintained spontaneity throughout our observed temperature range. The S1 configuration exhibited endothermic and non-spontaneous adsorption behavior across 100 K to 350 K, while the maximum temperature for spontaneous adsorption of the S5 configuration was around 275 K (Fig. 10(b)). Changing the medium to water significantly reduces the maximum temperature for spontaneous adsorption for both NU and BCNU drugs. For SiC/NU complexes, double sided configurations such as S4, S5, and S6 demonstrated endothermic adsorption behavior across the entire temperature range, while the adsorption process for single sided configurations S2 and S3 remained spontaneous until 225 K (Fig. 10(c)). Although configuration S1 showed a transition from spontaneous to non-spontaneous adsorption at around 200 K in gas phase, in water phase the adsorption process remained completely non-spontaneous. As seen in Fig. 10(d), S1 configuration of SiC/BCNU complexes demonstrated endothermic non-spontaneous adsorption across the entire temperature range. Configurations S1 and S4 transition from spontaneous to non-spontaneous adsorption at around 275 K, while for configurations S3 and S6, this temperature was around 320 K. With increasing temperature, there is a significant drop in formation energy. Consequently, it can be deduced that in thermal therapy, the release rate of the anticancer drugs will be greatly enhanced due to the reduction in formation energy at higher temperatures. The greater release rate at higher temperatures could be due to the larger thermal fluctuations occurring at those temperatures. This finding is in accordance with the experimental observations.47 These results indicate that SiC-based delivery systems can be effectively used in targeted phototherapy. Especially configurations S2 and S3 for SiC/NU complexes and S1, S3, S4 and S6 configurations for SiC/BCNU complexes are highly suited for photothermal therapy applications due to their near room–temperature transition behavior.
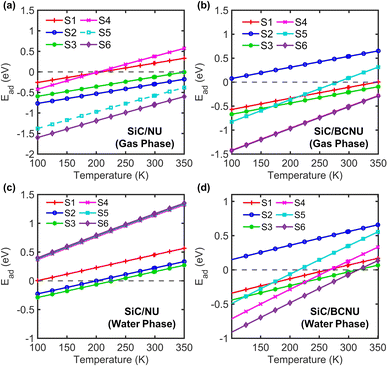 |
| | Fig. 10 Adsorption energy dependence on temperature for (a) SiC/NU and (b) SiC/BCNU in gas phase and (c) SiC/NU and (d) SiC/BCNU in water phase. | |
4 Conclusion
We studied the therapeutic potential of SiC nanosheets for anticancer drugs like nitrosourea and carmustine using DFT calculations. Favorable adsorption energies were obtained for both of these drugs. Single-sided adsorption complexes exhibited physisorption (Ead ranges from −0.208 eV to −0.982 eV) for both drugs, while double-sided complexes demonstrated chemisorption (Ead ranges from −0.813 eV to −1.998 eV). The adsorption of both drugs significantly reduced the HOMO–LUMO gap in most cases. The drug molecules caused a modest decrease in global hardness and a noticeable increase in the global electrophilicity index, showing high reactivity of the SiC nanosheet towards both NU and BCNU. The enhanced reactivity was especially noticeable in the water medium where the SiC nanosheet showed a maximum 2× increase in global electrophilicity index for NU and a maximum 7× increase for BCNU. The ED and ESP isosurface also indicated strong drug molecules and nanosheet interactions. The temperature dependence of adsorption energy revealed that in the water medium, the drug molecules can be released from the nanosheet at around 320 K. These findings will be useful in novel drug delivery systems based on SiC for phototherapy applications.
Author contributions
Abdullah Jubair Bin Iqbal: conceptualization, methodology, visualization, investigation, and writing – original draft, review & editing. Rifat Shahriar: conceptualization, investigation, formal analysis, and writing – review & editing. Ahmed Zubair: supervision, conceptualization, methodology, visualization, project administration, resources, and writing – original draft, review & editing.
Conflicts of interest
There are no conflicts to declare.
Acknowledgements
The authors thank the Bangladesh University of Engineering Technology for the computational facilities and technical support.
Notes and references
- Z. Sheng, D. Hu, M. Zheng, P. Zhao, H. Liu, D. Gao, P. Gong, G. Gao, P. Zhang, Y. Ma and L. Cai, ACS Nano, 2014, 8, 12310–12322 CrossRef CAS PubMed.
- A. Tariq, S. Nazir, A. W. Arshad, F. Nawaz, K. Ayub and J. Iqbal, RSC Adv., 2019, 9, 24325–24332 RSC.
- H. Sun, P. She, G. Lu, K. Xu, W. Zhang and Z. Liu, J. Mater. Sci., 2014, 49, 6845–6854 CrossRef CAS.
- T. M. Allen and P. R. Cullis, Science, 2004, 303, 1818–1822 CrossRef CAS PubMed.
- N. Nasongkla, E. Bey, J. Ren, H. Ai, C. Khemtong, J. S. Guthi, S.-F. Chin, A. D. Sherry, D. A. Boothman and J. Gao, Nano Lett., 2006, 6, 2427–2430 CrossRef CAS PubMed.
- J. W. Park, E. H. Chae, S. H. Kim, J. H. Lee, J. W. Kim, S. M. Yoon and J.-Y. Choi, Mater. Chem. Phys., 2006, 97, 371–378 CrossRef CAS.
- F. Bray, J. Ferlay, I. Soerjomataram, R. L. Siegel, L. A. Torre and A. Jemal, Ca-Cancer J. Clin., 2018, 68, 394–424 CrossRef PubMed.
- M. Shahabi and H. Raissi, J. Inclusion Phenom. Macrocyclic Chem., 2017, 88, 159–169 CrossRef CAS.
- A. Tariq, S. Nazir, A. W. Arshad, F. Nawaz, K. Ayub and J. Iqbal, RSC Adv., 2019, 9, 24325–24332 RSC.
- K. Kostarelos, Adv. Colloid Interface Sci., 2003, 106, 147–168 CrossRef CAS PubMed.
- K. Mahmud, T. Yashir and A. Zubair, Nanoscale Adv., 2024 10.1039/D3NA01095C.
- R. B. Weiss and B. F. Issell, Cancer Treat. Rev., 1982, 9, 313–330 CrossRef CAS PubMed.
- S. Augustine, J. Singh, M. Srivastava, M. Sharma, A. Das and B. D. Malhotra, Biomater. Sci., 2017, 5, 901–952 RSC.
- B. R. O'Driscoll, S. Kalra, H. R. Gattamaneni and A. A. Woodcock, Chest, 1995, 107, 1355–1357 CrossRef PubMed.
- B. Hoogstraten, J. A. Gottlieb, E. Caoili, W. G. Tucker, R. W. Talley and A. Haut, Cancer, 1973, 32, 38–43 CrossRef CAS PubMed.
- L. Qian, J. Zheng, K. Wang, Y. Tang, X. Zhang, H. Zhang, F. Huang, Y. Pei and Y. Jiang, Biomaterials, 2013, 34, 8968–8978 CrossRef CAS PubMed.
- Y. Chen, C. Tan, H. Zhang and L. Wang, Chem. Soc. Rev., 2015, 44, 2681–2701 RSC.
- X. Yang, G. Liu, Y. Shi, W. Huang, J. Shao and X. Dong, Nanotechnology, 2018, 29, 222001 CrossRef PubMed.
- B. Yang, J. Yin, Y. Chen, S. Pan, H. Yao, Y. Gao and J. Shi, Adv. Mater., 2018, 30, 1705611 CrossRef PubMed.
- Y. Liu, X. Ji, J. Liu, W. W. L. Tong, D. Askhatova and J. Shi, Adv. Funct. Mater., 2017, 27, 1703261 CrossRef PubMed.
- L. Sun, C. Han, N. Wu, B. Wang and Y. Wang, RSC Adv., 2018, 8, 13697–13707 RSC.
- S. Tengeler, B. Kaiser, G. Ferro, D. Chaussende and W. Jaegermann, Appl. Surf. Sci., 2018, 427, 480–485 CrossRef CAS.
- T. Sahu, B. Ghosh, S. K. Pradhan and T. Ganguly, Int. J. Electrochem., 2012, 2012, 271285 Search PubMed.
- M. M. Kadhim, S. K. Hachim, S. Alomar, T. Z. Taban, S. A. H. Abdullaha and N. Alnasoud, Silicon, 2023, 15, 4317–4323 CrossRef CAS.
- B. Delley, J. Chem. Phys., 2000, 113, 7756–7764 CrossRef CAS.
- R. Rahimi and M. Solimannejad, Appl. Surf. Sci., 2020, 525, 146577 CrossRef CAS.
- B. Delley, Mol. Simul., 2006, 32, 117–123 CrossRef CAS.
- M. Ungerer, C. van Sittert, D. van der Westhuizen and H. Krieg, Comput. Theor. Chem., 2016, 1090, 112–119 CrossRef CAS.
- D. Bahamon, M. Khalil, A. Belabbes, Y. Alwahedi, L. F. Vega and K. Polychronopoulou, RSC Adv., 2021, 11, 2947–2957 RSC.
- M. M. Kadhim, T. Z. Taban, S. A. Abdullaha, A. M. Rheima, S. K. Hachim and A. M. Abed, J. Phys. Chem. Solids, 2023, 177, 111270 CrossRef CAS.
- A. M. Sapse, E. B. Allen and L. Fugler-Domenico, Cancer Invest., 1987, 5, 559–566 CrossRef CAS PubMed.
- S. Hadidi, F. Shiri and M. Norouzibazaz, Struct. Chem., 2019, 30, 1315–1321 CrossRef CAS.
- W. L. Jorgensen and E. M. Duffy, Adv. Drug Delivery Rev., 2002, 54, 355–366 CrossRef CAS PubMed.
- J. Princy Maria, V. Nagarajan and R. Chandiramouli, Chem. Phys. Lett., 2020, 738, 136841 CrossRef CAS.
- S. Sridhar, P. L. G. Ventzek and A. Ranjan, J. Vac. Sci. Technol., A, 2020, 38, 043007 CrossRef CAS.
- R. Shahriar, K. S. Hoque, D. Tristant and A. Zubair, Appl. Surf. Sci., 2022, 600, 154053 CrossRef CAS.
- K. Fukui, Science, 1982, 218, 747–754 CrossRef CAS PubMed.
- A. Ahmadi Peyghan, N. L. Hadipour and Z. Bagheri, J. Phys. Chem. C, 2013, 117, 2427–2432 CrossRef CAS.
- U. Srimathi, V. Nagarajan and R. Chandiramouli, J. Mol. Liq., 2018, 265, 199–207 CrossRef CAS.
- M. Vatanparast and Z. Shariatinia, J. Mol. Graphics Modell., 2019, 89, 50–59 CrossRef CAS PubMed.
- A. S. Rad, S. A. Aghouzi, N. Motaghedi, S. Maleki and M. Peyravi, Mol. Simul., 2016, 42, 1519–1527 CrossRef.
- A. S. Rad, S. S. Shabestari, S. A. Jafari, M. R. Zardoost and A. Mirabi, Mol. Phys., 2016, 114, 1756–1762 CrossRef CAS.
- M. Vatanparast and Z. Shariatinia, J. Fluorine Chem., 2018, 211, 81–93 CrossRef CAS.
- A. Novikov, Solid-State Electron., 2010, 54, 8–13 CrossRef CAS.
- C. Xiao, K. Ma, G. Cai, X. Zhang and E. Vessally, J. Mol. Graphics Modell., 2020, 96, 107539 CrossRef CAS PubMed.
-
G. Korotcenkov, in Sensing Layers in Work-function-type Gas Sensors, Springer New York, New York, NY, 2013, pp. 377–388 Search PubMed.
- W. Ou, J. H. Byeon, R. K. Thapa, S. K. Ku, C. S. Yong and J. O. Kim, ACS Nano, 2018, 12, 10061–10074 CrossRef CAS PubMed.
|
| This journal is © The Royal Society of Chemistry 2024 |
Click here to see how this site uses Cookies. View our privacy policy here.  Open Access Article
 a,
Rifat
Shahriar‡
 ab and
Ahmed
Zubair
 *a
*a


