 Open Access Article
Role of polyvinylpyrrolidone in the polyol synthesis of platinum nanoparticles
Yunzi
Xin
 a,
Taku
Nagata
b,
Kunihiko
Kato
a,
Yuping
Xu
a and
Takashi
Shirai
a,
Taku
Nagata
b,
Kunihiko
Kato
a,
Yuping
Xu
a and
Takashi
Shirai
 *ab
*ab
aAdvanced Ceramics Research Center, Nagoa Institute of Technolgy, Gokiso-cho, Showa-ku, Nagoya, Aichi 466-8555, Japan. E-mail: shirai@nitech.ac.jp
bDepartment of Life Science and Applied Science, Graduate School of Engineering, Nagoya Institute of Technology, Gokiso-cho, Showa-ku, Nagoy, Aichi 466-8555, Japan
First published on 24th April 2024
Abstract
In this work, platinum (Pt) nanoparticles (NPs) were prepared via the reduction of Pt salts in an ethylene glycol induced polyol process with an altered polyvinylpyrrolidone (PVP)/Pt molar ratio. With the systematic elucidation of the hydrodynamic size in a liquid; the solid-state size and morphology, crystal structure, surface chemical state and thermal decomposition behavior of the synthesized Pt NPs; as well as the reducing dynamic of Pt cations, the role of PVP in the polyol synthesis of Pt NPs is clarified for the first time. It was found that the amount of PVP does not affect the reducing dynamic of Pt cations, but the chemical state of PVP capped on Pt NPs and the resultant particle size significantly depend on the initial PVP/Pt molar ratio in the precursor solution. Dense-packed PVP via the chemisorption of carbonyl oxygen on the surface of Pt NPs occurs in the case of a higher PVP/Pt ratio, suppressing particle growth and resulting in smaller Pt NPs. On the contrary, the chemical structure of PVP is tuned by the cleavage of the N–C bond and results in the chemisorption of the N atom on the surface of Pt NPs, which promotes the production of larger Pt NPs when a lower PVP/Pt ratio is applied.
Introduction
Metal nanoparticles (NPs) have attracted global interest in various applications, such as energy conversion, air and water purification, sensing, and medicine, owing to their extraordinary chemical and physical properties.1–7 The liquid-phase preparation of metal NPs via multivalent alcohol-carried polyol synthesis has been significantly reported considering their advantages of providing reductive intermediates at temperatures lower than the boiling point and a relatively high polarity for enabling the dissolution of simple metal salts as precursors.8–10 To prevent the aggregation and agglomeration of NPs during polyol synthesis, capping agents, such as surface stabilizers, are applied in size and structure-controlled synthesis of metal NPs. Among these capping agents, polyvinylpyrrolidone (PVP), a non-toxic and non-ionic polymer, has been widely utilized in the polyol synthesis of metal NPs. PVP exhibits several important features: (1) the highly polar amide group and hydrogen-binding available carboxyl group existing in the pyrrolidine ring of PVP can interact with solvent molecules, enabling high dispersibility in both water and many non-aqueous liquids; (2) the alkyl chain can act as a hydrophobic group, which prevents the aggregation of NPs via the repulsive forces of the steric hindrance effect; (3) PVP is also a highly stable molecule with inert physiochemical properties even under a wide range of pH.11,12 Previously, Song et al. reported the preparation of silver (Ag) nanocrystals via polyol synthesis by utilizing PVP with varied molecular weights from 8000 to 1![[thin space (1/6-em)]](https://www.rsc.org/images/entities/char_2009.gif) 300
300![[thin space (1/6-em)]](https://www.rsc.org/images/entities/char_2009.gif) 000.13 Consequently, it was found that the molecular weight plays an important role in controlling the shape and size of Ag nanocrystals. They demonstrated that the shape controlling mechanism as a sphere or rod can be attributed to the selective capping of PVP on the (100) plane of Ag, while further particle growth may be affected by the interaction between PVP and Ag+via electron transfer from carbonyl oxygen to silver cations. In addition, Rioux's group discussed the impact of the end group structure in PVP on the shape evolution of Ag nanostructures. By replacing the ending group from the alkyl terminal with a carboxylic structure, the shape of the final products can be altered in cubes, rods and fibres.14 Oezaslan's group reported the influence of PVP amount in the formation of platinum (Pt) nanotubes, with the addition of Ag+ as a structure directing agent.15 In their results, it was clarified that the configuration of PVP under varied initial concentrations used in polyol reaction can strongly modify the ligand exchange and flux of Pt ion in the liquid phase, which reduces on Pt (110) seed, resulting in generating cubic shape or irregular shape.
000.13 Consequently, it was found that the molecular weight plays an important role in controlling the shape and size of Ag nanocrystals. They demonstrated that the shape controlling mechanism as a sphere or rod can be attributed to the selective capping of PVP on the (100) plane of Ag, while further particle growth may be affected by the interaction between PVP and Ag+via electron transfer from carbonyl oxygen to silver cations. In addition, Rioux's group discussed the impact of the end group structure in PVP on the shape evolution of Ag nanostructures. By replacing the ending group from the alkyl terminal with a carboxylic structure, the shape of the final products can be altered in cubes, rods and fibres.14 Oezaslan's group reported the influence of PVP amount in the formation of platinum (Pt) nanotubes, with the addition of Ag+ as a structure directing agent.15 In their results, it was clarified that the configuration of PVP under varied initial concentrations used in polyol reaction can strongly modify the ligand exchange and flux of Pt ion in the liquid phase, which reduces on Pt (110) seed, resulting in generating cubic shape or irregular shape.
However, the influence amount of PVP on the size of observed metal NPs, as one of the most important parameters in the polyol synthesis of metal NPs, has rarely been reported for cases without any additional counter ions existing in the liquid phase due to the lack of clarification on the chemical state of PVP that passivated on metal NPs. In the present study, Pt NPs were synthesized via the reduction of Pt salts in an ethyl glycol-induced polyol process with an altered PVP/Pt molar ratio. The hydrodynamic size in liquid, the exact size in solid state, the crystal structure of Pt NPs, and the surface chemical state of PVP, as well as the correlation with the reducing dynamics of the Pt precursor in polyol synthesis, are elucidated systemically. The results of the present work provide important insights into the design and development of functional metal NPs.
Experimental
Synthesis of Pt NPs via polyol reaction
Ethylene glycol solutions consisting of 10 mM of chloroplatinic acid hexahydrate (H2PtCl6·6H2O, purchased from FUJIFILM Wako Pure Chemical Corp. Japan) and PVP (Mol wt. 10![[thin space (1/6-em)]](https://www.rsc.org/images/entities/char_2009.gif) 000, Sigma-Aldrich Co. LLC) with altered concentrations were prepared in an argon (Ar)-filled glove-box. A 10 ml precursor solution containing 1
000, Sigma-Aldrich Co. LLC) with altered concentrations were prepared in an argon (Ar)-filled glove-box. A 10 ml precursor solution containing 1![[thin space (1/6-em)]](https://www.rsc.org/images/entities/char_2009.gif) :
:![[thin space (1/6-em)]](https://www.rsc.org/images/entities/char_2009.gif) 1 ethylene glycol solution (PVP/Pt molar ratio: 0.344, 0.1, 0.03, 0.01, 0.005) was then transferred into a PTFE three-neck flask and heated by a commercial oil-bath system under continuous argon gas flow. The target temperatures for the polyol reaction were altered to 120, 130, 140, 150, and 160 °C, while the holding time was zero minute. For the synthesis of Pt NPs via different PVP/Pt molar ratios, the target temperature was fixed to 160 °C, while the altered temperatures at 120–160 °C were utilized for the synthesis of Pt NPs with tracking of detailed reaction dynamics for PVP/Pt = 0, 0.03 and 0.344 cases. After the target temperature was achieved, the oil bath was removed and the reaction solution was cooled naturally.
1 ethylene glycol solution (PVP/Pt molar ratio: 0.344, 0.1, 0.03, 0.01, 0.005) was then transferred into a PTFE three-neck flask and heated by a commercial oil-bath system under continuous argon gas flow. The target temperatures for the polyol reaction were altered to 120, 130, 140, 150, and 160 °C, while the holding time was zero minute. For the synthesis of Pt NPs via different PVP/Pt molar ratios, the target temperature was fixed to 160 °C, while the altered temperatures at 120–160 °C were utilized for the synthesis of Pt NPs with tracking of detailed reaction dynamics for PVP/Pt = 0, 0.03 and 0.344 cases. After the target temperature was achieved, the oil bath was removed and the reaction solution was cooled naturally.
Characterizations
The hydrodynamic size distribution of synthesized Pt NPs was estimated using commercial dynamic light scattering equipment (Zetasizer NanoZS, Malvern Panalytical Ltd.). The crystallinity of the obtained Pt NPs was characterized using a powder X-ray diffraction spectrometer (PXRD: Ultima IV, Rigaku Corp.). A Cu Kα line was utilized with an applied voltage and current of 40 mV and 40 mA. The morphology of the synthesized Pt NPs was observed using atomic high-resolution transmission electron microscopy (HR-TEM, JEM-ARM200, JEOL Ltd.). To prepare PXRD and TEM samples, the Pt NPs were liberated by 3 times repeated high-speed centrifugation (15![[thin space (1/6-em)]](https://www.rsc.org/images/entities/char_2009.gif) 000 G, 20 minutes) of solvent/antisolvent system, that is, 21 ml acetone/7 ml reacted with ethylene glycol solution containing Pt NPs. During this process, the excess PVP was removed, and the liberated Pt NPs were re-dispersed in ethanol, which was drop-casted on a zero-diffraction Si sample holder or TEM grid for PXRD or TEM analysis. The UV-vis absorption spectra of the Pt NP solutions were recorded using a UV-vis spectrometer (V-750, JASCO Corp.). The chemical structure of surface-capped PVP on Pt NPs was analysed by Fourier transform infrared spectroscopy (FT/IR: V6000, JASCO Corp.). The adsorption and thermal decomposition behaviours of PVP on the Pt NPs were investigated using a thermogravimeter-differential thermal analyser (TG/DTA: DTG-60, Shimadzu Corp.). The target temperature was settled at 550 °C at a heating rate of 10 °C min−1. Meanwhile, nitrogen gas flowing at 200 ml min−1 was applied during TG/DTA analysis.
000 G, 20 minutes) of solvent/antisolvent system, that is, 21 ml acetone/7 ml reacted with ethylene glycol solution containing Pt NPs. During this process, the excess PVP was removed, and the liberated Pt NPs were re-dispersed in ethanol, which was drop-casted on a zero-diffraction Si sample holder or TEM grid for PXRD or TEM analysis. The UV-vis absorption spectra of the Pt NP solutions were recorded using a UV-vis spectrometer (V-750, JASCO Corp.). The chemical structure of surface-capped PVP on Pt NPs was analysed by Fourier transform infrared spectroscopy (FT/IR: V6000, JASCO Corp.). The adsorption and thermal decomposition behaviours of PVP on the Pt NPs were investigated using a thermogravimeter-differential thermal analyser (TG/DTA: DTG-60, Shimadzu Corp.). The target temperature was settled at 550 °C at a heating rate of 10 °C min−1. Meanwhile, nitrogen gas flowing at 200 ml min−1 was applied during TG/DTA analysis.
Results and discussion
Fig. 1(a) and (b) displays the DLS size distribution of Pt NPs via polyol synthesis under an altered PVP/Pt ratio. The hydrodynamic size of Pt NPs existing in ethylene glycol directly after the polyol reaction is illustrated in Fig. 1(a), while Fig. 1(b) illustrates the hydrodynamic size of Pt NPs dispersed in ethanol. Along with the average size summarized in Fig. 1(c), the hydrodynamic size of synthesized Pt NPs decreases significantly from 450 nm to 10 nm as the concertation of PVP increases, in the case of ethylene glycol dispersion. The decrease in particle size also reaches a limitation at a PVP/Pt ratio of 0.03. It has been reported that PVP can be capped on metal NPs with the chemical bond associations of both the carboxyl group and/or amide group.16 With the steric repulse of the hydrophobic chain on PVP, the dispersibility of NPs can be promoted. Thus, we suggest that particle growth can be inhibited by the surface-passivated PVP on Pt NPs, resulting in reduced particle size with an increased amount of PVP/Pt during polyol synthesis. In addition, it can be also demonstrated that the size of liberated Pt NPs tuned in a narrower range from 100 nm to ∼10 nm after being redispersed in ethanol. In particular, the size of Pt NPs at a lower PVP/Pt ratio was significantly reduced when dispersed in ethanol. Due to the difference in the dipole moment of ethylene glycol and ethanol, it can be suggested that a distinguished surface state was established at a lower PVP/Pt ratio, which enabled the obtained Pt NPs to be more easily dispersed in liquids with higher polarity, such as ethanol.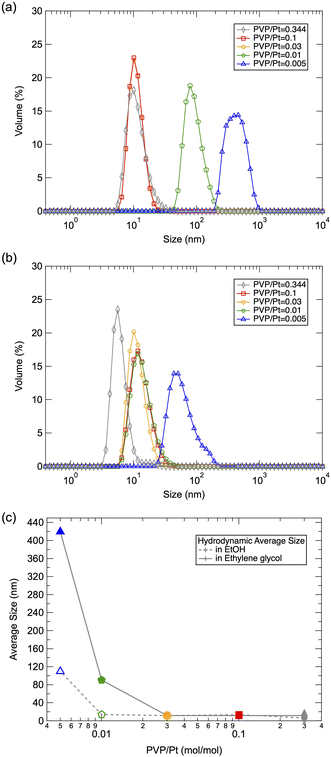 | ||
| Fig. 1 DLS results of the prepared Pt NPs in (a) ethyl glycol and (b) ethanol, and corresponding (c) average size as a function of the PVP/Pt molar ratio. | ||
Fig. 2(a) illustrates the PXRD patterns of solid-state Pt NPs synthesized via polyol synthesis under an altered PVP/Pt ratio. A face-cantered cubic (fcc) phase10 of Pt was observed for all samples, while the FWHM changed under altered PVP concentrations. The average crystalline size for different crystal planes was then calculated based on Scherer's equation, and the results were plotted in Fig. 2(b)–(d). Furthermore, the calculated results via different Scherrer constants (K = 0.94, 0.89 and 1.0747) were compared because these constants have been numerously utilized for a sphere-shaped NP with cubic symmetry.17,18 As demonstrated in Fig. 2(b)–(d), it can be clarified that the crystalline size decreases as the PVP concentration increases. In good agreement with the tendency of the DLS results, the crystalline size decreases as the PVP amount increases. On the contrary, the crystalline size also varies for higher PVP concertation (PVP/Pt = 0.03, 0.1 and 0.344) while the dynamic size remained constant near 10 nm in DLS analysis. For Pt NPs synthesized under lower PVP concentrations as PVP/Pt = 0.01 and 0.005, the crystalline size is quite smaller than the hydrodynamic size observed in DLS, which reveals that the aggregation and agglomeration of Pt NPs occur due to the insufficient PVP amount. In addition, by comparing the crystallite sizes of the different planes, it can be concluded that the size of the (111) plane is slightly larger than that of the (110) and (220) planes. The origin of such a phenomenon can be attributed to the predominated crystal growth of the (111) plane due to the lower surface energy of the (111) plane than the (110) and (220) planes.2 Although the crystal should appear as a typical octahedral or tetrahedral shape, truncated octahedrons (known as Wulff polyhedrons) enclosed by a mix of (100) and (111) facets with a nearly spherical shape turn to be the final profile to reduce the total surface area and total interfacial energy.2,19
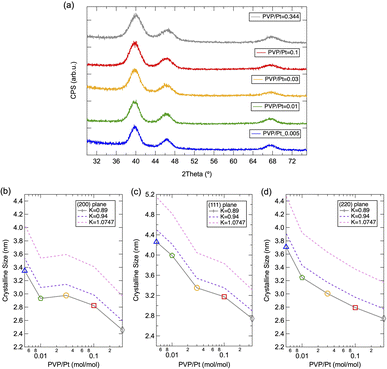 | ||
| Fig. 2 (a) PXRD patterns of the prepared Pt NPs and (b–d) corresponding calculated crystalline size for (111), (200) and (220) planes. | ||
The HR-TEM observation was also conducted to confirm the morphology and crystallinity of the synthesized Pt NPs. Fig. 3 shows the observed HR-TEM images of Pt NPs synthesized under different PVP/Pt molar ratios. The observed Pt NPs exhibit a nearly spherical shape, which agrees well with the crystalline size estimation from PXRD, as demonstrated above. Thus, we suggest that the amount of PVP does not affect the shape of the synthesized Pt NPs in the present system, whose results show good agreement with Wei's work.20 They demonstrate that the interaction between PVP, and Pt precursors significantly affects the morphology of resultant Pt NPs by showing the nucleation pathways via an in situ combined quick-XAFS and UV-vis spectroscopy. With regard to the results of size distribution, as estimated from >50 NPs in the HR-TEM images, the size of synthesized Pt NPs decreases as the PVP/Pt ratio increases. The average sizes of Pt NPs for PVP/Pt = 0.005, 0.01, 0.03, 0.1, and 0.344 are calculated as 3.97 ± 0.73, 3.20 ± 0.59, 3.30 ± 0.63, 2.51 ± 0.41, and 1.89 ± 0.48 nm, respectively. Different from the hydrodynamic sizes monitored in ethylene glycol or ethanol dispersion as analysed in the DLS measurement, the solid-state size observed in HR-TEM shows good agreement with the crystalline size obtained from PXRD patterns. These results demonstrate that the PVP-capped Pt NPs exhibit a distinguished size in the liquid and solid states, especially in less PVP cases. The size of agglomerated Pt NPs vigilantly increases up to ∼500 nm and 100 nm in ethylene glycol and ethanol, respectively, for a trace PVP amount, such as PVP/Pt = 0.005.
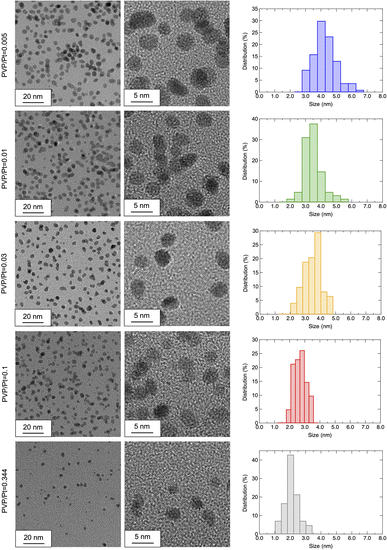 | ||
| Fig. 3 HR-TEM images observed under altered magnification and estimated size distributions of the prepared Pt NPs (from top to bottom: PVP/Pt = 0.005/0.01/0.03/0.1/0.344). | ||
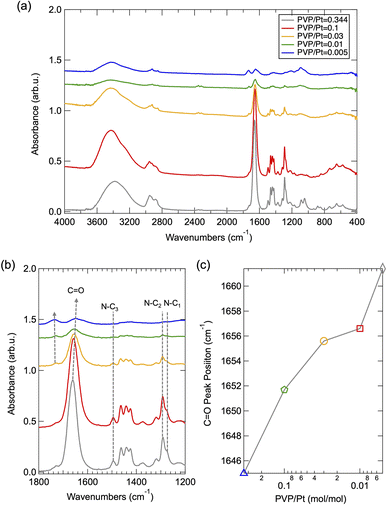
To understand the size-tuning mechanism with altered PVP amount, the chemical state of surface-passivated PVP was further investigated via FT/IR spectroscopy. Fig. 4(a) depicts the FT/IR spectra of the synthesized Pt NPs under different PVP concentrations. The peaks around 2900–3000 cm−1 and 1382–1425 cm−1 can be assigned as the vibration mode of C–H in CH2, while the peak of 3400 cm−1 corresponds to the stretching N–H.15 As demonstrated in Fig. 4(b), the expended FT-IR spectra of (a), the vibration band of C![[double bond, length as m-dash]](https://www.rsc.org/images/entities/char_e001.gif) O can be clearly observed at 1640–1660 cm−1, whose peak position has been significantly blue shifted upon altered PVP amounts. As summarized in Fig. 4(c), this illustrates that the C
O can be clearly observed at 1640–1660 cm−1, whose peak position has been significantly blue shifted upon altered PVP amounts. As summarized in Fig. 4(c), this illustrates that the C![[double bond, length as m-dash]](https://www.rsc.org/images/entities/char_e001.gif) O band shifted to a lower wavenumber with a decreased PVP/Pt molar ratio. It has been previously reported that such a shift can be attributed to the band dissociation of C
O band shifted to a lower wavenumber with a decreased PVP/Pt molar ratio. It has been previously reported that such a shift can be attributed to the band dissociation of C![[double bond, length as m-dash]](https://www.rsc.org/images/entities/char_e001.gif) O and resultant chemisorption of PVP on nanoparticles as the polyol reaction progressed.15 Such phenomenon can also be confirmed by the side peak that appears around 1750 cm−1 (as indicated by a short dashed grey line and arrow),21 which became more obvious as the PVP decreased below 0.03. Thus, we suggest that the peak position of the C
O and resultant chemisorption of PVP on nanoparticles as the polyol reaction progressed.15 Such phenomenon can also be confirmed by the side peak that appears around 1750 cm−1 (as indicated by a short dashed grey line and arrow),21 which became more obvious as the PVP decreased below 0.03. Thus, we suggest that the peak position of the C![[double bond, length as m-dash]](https://www.rsc.org/images/entities/char_e001.gif) O band shifting to higher wavenumbers probably originates from the excess amount of PVP existing in the reaction solution. In addition, the vibration band of N–C1,2,3 around 1276/1295/1483 cm−1,22 as shown in Fig. 4, disappeared in a reduced amount of PVP especially when the PVP/Pt molar ratio is less than 0.03, which demonstrates the chemisorption of N centre on Pt NPs and band resultant dissociation of N–C in N–C
O band shifting to higher wavenumbers probably originates from the excess amount of PVP existing in the reaction solution. In addition, the vibration band of N–C1,2,3 around 1276/1295/1483 cm−1,22 as shown in Fig. 4, disappeared in a reduced amount of PVP especially when the PVP/Pt molar ratio is less than 0.03, which demonstrates the chemisorption of N centre on Pt NPs and band resultant dissociation of N–C in N–C![[double bond, length as m-dash]](https://www.rsc.org/images/entities/char_e001.gif) O and N–C–C after polyol reaction. To correlate with the results of HR-TEM and PXRD, we can also conclude that the surface passivation via the chemisorption of the dissociated C
O and N–C–C after polyol reaction. To correlate with the results of HR-TEM and PXRD, we can also conclude that the surface passivation via the chemisorption of the dissociated C![[double bond, length as m-dash]](https://www.rsc.org/images/entities/char_e001.gif) O site occurs principally when the amount of PVP utilized in polyol synthesis reaches or is higher than a relevant saturated amount, while further chemisorption via the dissociated N–C site also occurring in the case of PVP is under an excess level.
O site occurs principally when the amount of PVP utilized in polyol synthesis reaches or is higher than a relevant saturated amount, while further chemisorption via the dissociated N–C site also occurring in the case of PVP is under an excess level.
To clarify the chemical state of surface-passivated PVP on Pt NPs as presumed from FT-IR results, TG-DTA analysis is also further conducted. Fig. 5(a) shows the TG-DTA result of pure PVP utilized in the present work. A relatively small weight loss started at 100 °C, accompanied by an endothermic process was confirmed, which may be induced by the absorbed water from moisture. In addition, a significant second weight loss located at 400 °C with significant endothermic was confirmed, which can be attributed to the typical thermal degradation of PVP, as reported previously.22–24 It has been presumed that the predominant mechanism during the thermal degradation of PVP is the depolymerization from polymer to a monomer containing the polymeric main chain. It has also been reported that the bond energy of the N–C (292 kJ mol−1) linkage is quite weaker than that of C–C (348 kJ mol−1), C–O (351 kJ mol−1) or C–H (391 kJ mol−1).25 Thus, the weight loss in the range of 200–400 °C can be attributed to the cleavage of the N–C bond, while the weight loss under 400–500 °C can be attributed to the bond dissociation of C–C/C–O/C–H induced depolymerization. By comparing the TG-DTG results of PVP-capped Pt NPs with pure PVP, as shown in Fig. 5(b) and (a), it demonstrated that the weight loss was dominated at a lower temperature range, suggesting that the capped PVP exhibits a different chemical state from that of pure PVP and/or the Pt NPs may act as a catalyst to promote the thermal decomposition of capped PVP as well.26 When the PVP amount was extremely low, as given by PVP/Pt = 0.005 case, the 1st stage weight loss due to N–C cleavage disappeared, whose phenomenon probably originated from the strong chemisorption of N centre on Pt NPs, as demonstrated by the FT/IR results.
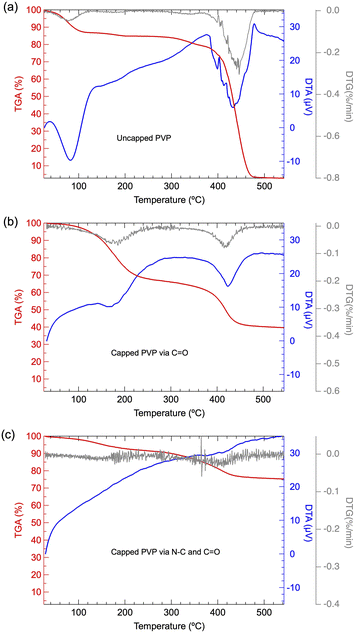 | ||
| Fig. 5 TG-DTA and DTG curves of (a) pure PVP, (b) synthesized Pt NPs for PVP/Pt = 0.344 and (c) synthesized Pt NPs for PVP/Pt = 0.03. | ||
Finally, we also investigated the reducing dynamic of Pt precursors under different PVP/Pt molar ratios, with the assistance of UV-vis spectroscopy. Fig. 6(a) and (b) display the UV-vis spectra of the reaction solution under different temperatures during polyol synthesis. The sharp peak appearing around 272 nm can be assigned as the characteristic absorption from PtCl62−,27–30 while the peak near 230 nm can be attributed to the absorption of n–π* transition from PVP.31,32 The UV-vis spectra demonstrate that the peak intensity of PtCl62− decreases as the polyol synthesis progresses. The peak intensity reduces rapidly when the reaction temperature is higher than 140 °C, whose phenomenon has been clarified previously based on the reaction mechanism for ethylene glycol in polyol synthesis.10 When the temperature of the precursor is higher than 140 °C, the acetaldehyde is produced as a strong reducing agent to react with the PtCl62−, resulting in the generation of Pt NPs. In addition, Fig. 6(c) depicts the peak reducing tendency as a function of temperature. Consequently, this demonstrates that the addition of PVP or the amount of PVP does not significantly affect the reducing dynamic of PtCl62−. Moreover, it can be observed that the peak of PVP dissipated gradually as the synthesis progressed, for the case of PVP/Pt = 0.005. This elucidates that the PVP structure was tuned as the PtCl62− reduced and Pt NPs were produced, which can be ascribed to the dissociation of both C![[double bond, length as m-dash]](https://www.rsc.org/images/entities/char_e001.gif) O and N–C in the pyrrolidine ring of PVP. These results correlate well with the FT-IR and TG-DTA results.
O and N–C in the pyrrolidine ring of PVP. These results correlate well with the FT-IR and TG-DTA results.
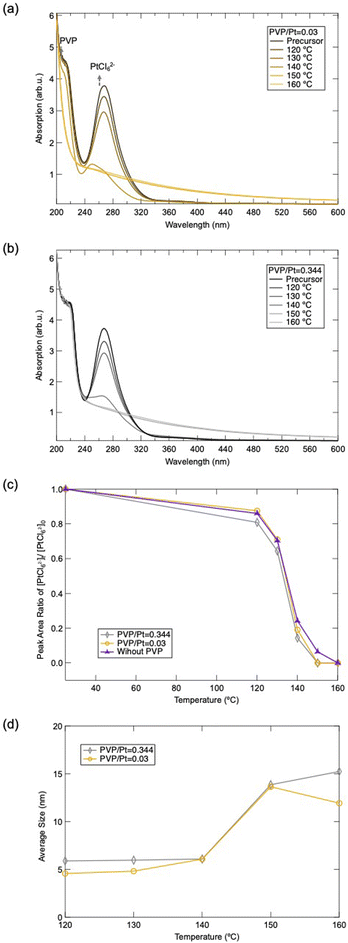 | ||
| Fig. 6 UV-vis absorption spectra of Pt NPs synthesized under (a) PVP/Pt = 0.03 and (b) PVP/Pt = 0.344, and (c) peak area ratio changes of PtCl62− estimated from UV-vis absorption spectra. | ||
Based on the above results, we presumed the mechanism of size controlling Pt NPs in polyol synthesis when different amounts of PVP are utilized, as illustrated in Scheme 1. At the beginning stage of polyol synthesis, as the temperature is lower than 140 °C, Pt precursor and PVP polymer are well dissolved in ethylene glycol solvent in which the Pt4+ is coordinated to carbonyl oxygen via sufficient electron transfer. When the temperature of the liquid phase reaches a target temperature of 150 °C, the strong reducing agent of acetaldehyde is generated and reacts with the Pt4+ to produce Pt0. Upon Ostwald ripening of Pt0, Pt NPs can then be formed. In the case of a high PVP/Pt molar ratio system, chemisorption of a relatively large amount of PVP occurs simultaneously, whose process not only suppresses further particle growth but also prevents the aggregation of particles via the repulsive force of the alkyl chain and the corresponding steric hindrance effect. Considering the surface chemical state of Pt NPs synthesized from a low PVP/Pt molar ratio, dissociation of the N–C bond in N–C![[double bond, length as m-dash]](https://www.rsc.org/images/entities/char_e001.gif) O and chemisorption of N also occurs, accompanied by carbonyl oxygen chemisorption. The aggregation of Pt0 and further particle growth can be promoted in such loose passivation of the polymer on the surface compared with a higher PVP amount. Furthermore, the structural change in the amide centre and the relatively weak repulsive force of the less alkyl chain induced in loose-packed PVP on the surface of Pt NPs cannot sufficiently prevent the aggregation of Pt NPs. Thus, a larger hydrodynamic radius of a particle can be observed in dispersion as the agglomeration of the primary particle, which is a principal key point that cannot be ignored in liquid-phase application.
O and chemisorption of N also occurs, accompanied by carbonyl oxygen chemisorption. The aggregation of Pt0 and further particle growth can be promoted in such loose passivation of the polymer on the surface compared with a higher PVP amount. Furthermore, the structural change in the amide centre and the relatively weak repulsive force of the less alkyl chain induced in loose-packed PVP on the surface of Pt NPs cannot sufficiently prevent the aggregation of Pt NPs. Thus, a larger hydrodynamic radius of a particle can be observed in dispersion as the agglomeration of the primary particle, which is a principal key point that cannot be ignored in liquid-phase application.
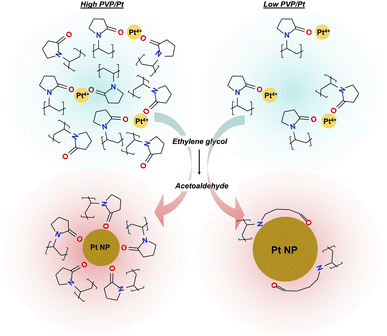 | ||
| Scheme 1 Presumed size-controlling mechanism for Pt NPs in polyol synthesis by utilizing an altered PVP/Pt molar ratio. | ||
Conclusions
In conclusion, Pt NPs of varied sizes were prepared via the reduction of Pt salts in an ethylene glycol-induced polyol process with an altered wide range of PVP/Pt molar ratios (0.005, 0.01, 0.03, 0.1, and 0.344). With systemic elucidation on the hydrodynamic size in liquid, solid-state size and morphology, crystal structure, surface chemical state and thermal decomposition behavior of the synthesized Pt NPs, as well as the reducing dynamic of Pt cations, the role of PVP in polyol synthesis of Pt NPs is clarified for the first time. The hydrodynamic size of Pt NPs as dispersed in the original reaction liquid, analysed by DLS, shows a larger size of up to ∼10 nm, whose results have been confirmed as the agglomeration of primary Pt NPs with an average size less than 5 nm regarding the morphology and size characterization via PXRD and HR-TEM on the solid-state. It was also found that the amount of PVP does not affect the reducing dynamic of Pt cations, but the chemical state capped on Pt NPs and particle size significantly depends on the initial PVP/Pt molar ratio in the precursor solution. With regard to the results of FT-IR and TG-DTA, this demonstrated that a dense packed PVP via chemisorption of carbonyl oxygen on the Pt NP surface occurs in the case of a higher PVP/Pt ratio, while the structure PVP tuned by the cleavage of the N–C bond resulted in chemisorption of the N atom on the surface when a lower PVP/Pt was applied. The former chemisorption of a relatively large amount of PVP occurs simultaneously, whose process not only suppresses further particle growth but also prevents the aggregation of particles via the repulsive force of the alkyl chain and the corresponding steric hindrance effect. On the contrary, the aggregation of Pt0 and further particle growth can be promoted in later loose passivated polymers on the surface compared with higher PVP amounts. These loose-packed PVP on the Pt NP surface cannot prevent the aggregation of Pt NPs sufficiently, resulting in a larger hydrodynamic size appearance in the liquid phase. The results of the present work provide important insights into fundamental knowledge as well as the design and development of functional metal nanoparticles.Author contributions
Y. X. planned the work, performed part of the experiments, characterized the results and wrote the manuscript. T. N. performed part of the experiments and characterized the results. K. K. provided the interpretation of characterization. Y. X. provided the interpretation of characterization. T. S. supervised the work and provided the interpretation of characterization. All authors read the manuscript and these authors contributed equally.Conflicts of interest
There are no conflicts to declare.Acknowledgements
The authors acknowledge Dr Shizuka Seto (Nagoya Institute of Technology) for HR-TEM observations.Notes and references
- M. He, Y. Ai, W. Hu, L. Guan, M. Ding and Q. Liang, Adv. Mater., 2023, 35, 2211915 CrossRef CAS PubMed.
- Y. Xia, Y. Xiong, B. Lin and S. E. Skrabalak, Angew. Chem., Int. Ed., 2009, 48, 60–103 CrossRef CAS PubMed.
- T. K. Sau, A. L. Rogach, F. Jackel, T. A. Klar and J. Feldmann, Adv. Mater., 2010, 22, 1805 CrossRef CAS PubMed.
- J. Quinson and K. M. Q. Jensen, Adv. Colloid Interface Sci., 2020, 286, 102300 CrossRef CAS PubMed.
- L. Liu and A. Corma, Chem. Rev., 2018, 118, 4981–5079 CrossRef CAS PubMed.
- P. K. Jain, X. Huang, I. H. El-Sayed and M. A. El-Sayed, Acc. Chem. Res., 2008, 41, 1578–1586 CrossRef CAS PubMed.
- S. Linic, P. Chrstopher and D. B. Ingram, Nat. Mater., 2011, 10, 911 CrossRef CAS PubMed.
- F. Fievet, S. Ammar-Merah, R. Brayner, F. Chau, M. Giraud, F. Mammeri, J. Y. Piquemal, L. Sicard and G. Viau, Chem. Soc. Rev., 2018, 47, 5187 RSC.
- H. Dong, Y.-C. Chen and C. Feldmann, Green Chem., 2015, 17, 4170 RSC.
- Y. Xin, T. Nagata, K. Kato and T. Shirai, ACS Appl. Nano Mater., 2022, 5, 4305 CrossRef CAS.
- K. M. Koczkur, S. Mourdikoudis, L. Polavarapu and S. E. Skrabalak, Dalton Trans., 2015, 44, 17883 RSC.
- T. H. Yang, Y. Shi, A. Janssen and Y. Xia, Angew. Chem., Int. Ed., 2020, 59, 15378–15401 CrossRef CAS PubMed.
- Y. J. Song, M. Wang, X. Y. Zhang, J. Y. Wu and T. Zhang, Nanoscale Res. Lett., 2014, 9, 17 CrossRef PubMed.
- S. Jharimune, R. Pfukwa, Z. Chen, J. Anderson, B. Klumperman and R. M. Rioux, J. Am. Chem. Soc., 2021, 143, 184 CrossRef CAS PubMed.
- I. A. Safo, M. Werheid, C. Dosche and M. Oezaslan, Nanoscale Adv., 2019, 1, 3095 RSC.
- Y. Borodko, S. E. Habas, M. Koebel, P. Yang, H. Frei and G. A. Somorjai, J. Phys. Chem. B, 2006, 110, 23052–23059 CrossRef CAS PubMed.
- A. S. Vorokh, Nanosyst.: Phys. Chem. Math., 2018, 9(3), 364–369 CAS.
- J. I. Lanford and A. J. C. Wilson, J. Appl. Crystallogr., 1978, 11, 102–113 CrossRef.
- A. R. Tao, S. Habas and P. Yang, Small, 2008, 4(3), 210–325 CrossRef.
- T. Yao, S. Liu, Z. Sun, Y. Li, S. he, H. Cheng, Y. Xie, Q. Liu, Y. Jiang, Z. Wu, Z. Pan, W. Yan and S. Wei, J. Am. Chem. Soc., 2012, 134, 9410–9416 CrossRef CAS PubMed.
- F. Bonet, K. Tekaia-Elhsissen and K. Vijaya Sarathy, Bull. Mater. Sci., 2000, 23, 165–168 CrossRef CAS.
- G. K. Inwati, Y. Rao and M. Singh, Nanoscale Res. Lett., 2016, 11, 458 CrossRef PubMed.
- M. I. loria-Bastarrachea, E. Herrera-Kao, J. V. Cauich-Rodriguez, J. M. Cervantes-Uc, H. Vazquez-Torres and A. Avila-Ortega, J. Therm. Anal. Calorim., 2011, 104, 737–742 CrossRef CAS.
- L. C. Mendes, R. C. Rodrigues, E. P. Silva and J. Them, Anal. Calorim., 2010, 101, 899–905 CrossRef CAS.
- C. Peniche, D. Zaldivar, M. Pazos, S. Paz, A. Bulay and J. San Roman, J. Appl. Polym. Sci., 1993, 50, 485–493 CrossRef CAS.
- Y. K. Du, P. Yang, Z. G. Mou, N. P. Hua and L. Jiang, J. Appl. Polym. Sci., 2006, 99, 23–26 CrossRef CAS.
- Z. Zhou, S. Wang, W. Zhou, L. Jiang, G. Wang, G. Sun, B. Zhou and Q. Xin, Phys. Chem. Chem. Phys., 2003, 5, 5485–5488 RSC.
- I. Znakovskaya, Y. A. Sosedove, E. M. Glebov, V. P. Grivin and V. F. Plyusnin, Photochem. Photobiol. Sci., 2005, 4, 897–902 CrossRef CAS PubMed.
- V. P. Thai, H. Furuno, N. Saito, K. Takahashi, T. Sasaki and T. Kikuchi, J. Appl. Phys., 2020, 128, 043305 CrossRef CAS.
- H. T. Su and Y. Sakka, Sci. Technol. Adv. Mater., 2014, 15, 014205 CrossRef PubMed.
- R. F. Bhajantri, V. Ravindrachary, B. P. Ismayil, A. Harisha and V. Crasta, Polym. Eng. Sci., 2009, 49, 903–909 CrossRef CAS.
- J. Wang, T. Tsuzuki, B. Tang, P. Cizek, L. Sun and X. Wang, Colloid Polym. Sci., 2010, 288, 1705–1711 CrossRef CAS.
| This journal is © The Royal Society of Chemistry 2024 |

