 Open Access Article
Application of MIL-101(Cr) for biofuel dehydration and process optimization using the central composite design method
Parya
Parak
a,
Ahmad
Nikseresht
 *b,
Masoud
Mohammadi
 c and
Mohammad Saeid
Emaminia
a
aLegal Medicine Research Center, Legal Medicine Organization, Tehran, Iran
bDepartment of Chemistry, Payame Noor University (PNU), P.O. Box 19395-4697, Tehran, Iran. E-mail: a_nik55@yahoo.com; ahmad.nikseresht@pnu.ac.ir
cDepartment of Chemistry, Faculty of Science, Ilam University, P.O. Box 69315516, Ilam, Iran
First published on 15th July 2024
Abstract
Nowadays, researchers from various fields are aiming to replace petro-based and other fossil fuels with green and renewable alternatives. One of the potential candidates, requiring a highly pure reactant, is biofuel. The use of alcohol-containing water as a reactant can lead to different types of problems including the generation of side reactions, hydrolysis, equilibrium shifts, catalyst deactivation and process complexity. A metal–organic framework, MIL-101(Cr), was successfully synthesized using the hydrothermal method and subsequently employed for the dehydration of a standard biofuel. With this goal in mind, we aimed to optimize the effects of operational parameters—specifically, initial water concentration, adsorbent dosage, and temperature—using the central composite design (CCD) method, while also analyzing their behaviors by applying variance analysis. To predict the process behavior, we propose a refined quadratic equation under various conditions, achieving an R2 value of 95.26. The results showed that the process was more influenced by temperature variations than the other two parameters. The optimal conditions were predicted with an initial concentration of 1.41, catalyst dosage of 0.14, and a temperature of 302.5 K, resulting in a capacity of 1349.72 and a desirability value of 0.95. Additionally, the synthesized MIL-101(Cr) was characterized using XRD, SEM, DSC/TGA, and N2 physisorption techniques. The results indicated that the particles possessed microporous windows and mesoporous cages, exhibiting a uniform octahedral shape with an average size ranging between 200 and 500 nm.
1. Introduction
Nowadays, numerous attempts are being launched with the aim of replacing petro-based and other fossil fuels, which have high prices and cause damage to the environment and emission of greenhouse gases, with novel renewable fuels. In this regard, biodiesel can be considered the most significant candidate, resulting in the minimization of greenhouse effects, carbon dioxide emissions, particulate volume, SO2 emissions, and unburned hydrocarbons.1–6Esterification is a common method for producing biodiesel from fatty acids and alcohols in the presence of catalysis in large-scale production.7–9 The reactants used in this reaction must be very pure. For example, the use of alcohols containing some water as a reactant can lead to the generation of side reactions such as saponification, severely affecting the efficiency of the reaction. Additionally, the presence of water in the final product can lead to issues such as corrosion, reduced efficiency, incomplete combustion, and internal engine knocking.10–13
To date, many procedures have been reported aiming to dry or dehydrate organic compounds and gases, such as distillation, chemical reactions, membranes, and adsorption.14,15 Among these, the adsorption process has gained significant attention due to its numerous advantages. The process is cost-effective, making it accessible for various industrial applications. It is also straightforward to operate, typically requiring simpler and less expensive equipment compared to other methods. Furthermore, adsorption offers a wide range of adsorbent materials, each with unique properties that can be tailored to specific needs, providing high selectivity in targeting particular substances for removal.11,16,17 This selectivity is crucial in applications where precise dehydration is necessary, such as in the production of pharmaceuticals, where even trace amounts of moisture can affect product stability.18 Additionally, adsorption results in low contamination of the target compounds because it does not involve the introduction of additional chemicals or complex chemical reactions. This minimizes the risk of side reactions and ensures the purity of the final product.19 The flexibility and efficiency of the adsorption technology make it an attractive choice for dehydration processes in various industries, from gas purification to food processing and beyond.20 Finding an appropriate adsorbent is crucial for successful application of adsorption in special processes. Many adsorbents can be used in dehydration processes, including silica gel, activated alumina, zeolites, and more recently, metal–organic frameworks (MOFs), which exhibit high capacity and surface area.21
The nature of hydrogen acceptor bonding and pore volume distribution are the most important parameters that determine the application of MOFs.22 It's worth mentioning that modifying and optimizing these parameters can enhance the selectivity of MOFs in specific processes. Notably, MIL-101(Cr) is among these adsorbents, continuously applied in dehydration processes. Its high water capacity can be attributed to the presence of chromium clusters in its structure, which forms a porous structure with high volume.22,23 In this context, Noorpoor et al.24 hydrothermally synthesized MIL-101(Cr) and shaped it for liquid fuel dehydration. Their modification methods, particularly with acetic acid, demonstrated effective dehydration of the liquid fuel. Similarly, Gobara et al.25 altered the structure of MIL-101(Cr) and converted it into an adsorbent for ethanol vapor phase dehydration. They employed the sonochemistry method to encapsulate MIL-101(Cr) with Ni and Pt particles, resulting in increased efficiency and improved thermal stability. Furthermore, Suresh et al.26 focused on modifying MIL-101(Cr) with AC and employed it as a selective adsorbent for dehydrating 1,4-butanediol and 1-phenylethanol. Their study achieved higher dehydrated product selectivity compared to that on HZSM-5, chromium-supported activated carbon (Cr/AC), and amberlyst-15 catalysts.
In this study, MIL-101(Cr) adsorbent was synthesized using the hydrothermal method to achieve dehydration of typical biofuel with a water content of less than 3 wt%. This adsorbent was utilized in a slurry configuration as a semi-continuous adsorber with a volume capacity of 5 L. The effects of operational parameters—namely, initial water concentration, temperature, and adsorbent dosage—on the dehydration process were optimized using the CCD within the framework of Response Surface Methodology (RSM). This statistical approach allowed for a comprehensive investigation of the interactions between the operating variables, leading to the identification of the optimal conditions for the dehydration process.27–29 Subsequently, the results were interpreted through analysis of variance (ANOVA).
2. Methods and materials
2.1. Chemicals
Chromium(III) nitrate nonahydrate [Cr(NO3)3·9H2O] was utilized as the metal source to synthesize MIL-101 MOFs (procured from Merck Co., Germany) with a purity of 99%. Benzene dicarboxylic acid (H2BDC, 98%), acetic acid (36%), hydrofluoric acid (HF, 40–45%), sodium acetate (99%), N,N-dimethylformamide (DMF) (anhydrous) were obtained from Aldrich Co. The biofuel, synthesized within our laboratory, contained approximately 3–5 wt% of water.2.2. Analysis and instruments
The phase structure was determined using an X-ray powder diffraction instrument, specifically the D5000 Siemens (Germany), with Cu Kα radiation (λ = 1.5418 Å). Data were collected at a scan rate of 0.2 per minute within the 2θ range of 0–20°. The temperature was maintained at 25 °C, and each scan lasted for 20 minutes. Morphological mapping was conducted using a Cambridge S-360 scanning electron microscope (SEM) operating at 20 kV. Additionally, N2 adsorption–desorption analysis was performed at −196 °C using a Micromeritics ASAP 2020 instrument. Thermogravimetric analysis of the synthesized sample was carried out using a TGA/SDTA analyzer (Mettler Toledo 851E). The sample was heated from ambient temperature to 800 °C at a constant rate of 5 °C min−1 under a nitrogen atmosphere. Water concentration was measured using a Karl Fischer titrator instrument (Titrino, Switzerland).2.3. Preparation procedure
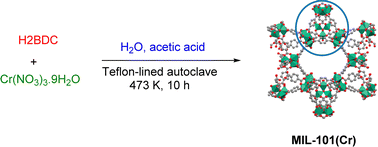
As an ongoing pursuit within our research endeavors focused on MOFs and nanoparticles,30–36 we embarked on a process involving the dissolution of chromium(III) nitrate nonahydrate (3.2 g), H2BDC (1.3 g), and acetic acid (6 mL, 40 wt%) in deionized water (50 mL), followed by a 20 minute session of ultrasonication. After this step, the resulting suspension was carefully transferred to a Teflon-lined autoclave, which was then placed in an oven at 473 K for a duration of 10 hours. Once the process was completed, the autoclave underwent cooling to reach the ambient temperature. In the subsequent stages, MIL-101(Cr) crystals, initially dispersed in ethanol for 1 hour, were subjected to a thorough washing regimen involving DMF. Concluding these steps, the mixture underwent a controlled centrifugation process lasting 5 minutes at 8000 rpm. To attain the desired dehydrated state of MIL-101, a vacuum evacuation lasting 12 hours at 423 K was meticulously carried out (Scheme 1).2.4. Reactor description
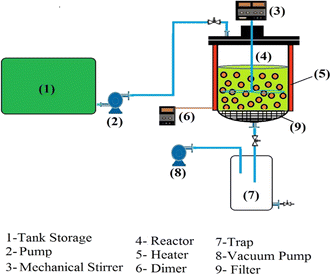
In this study, the reactor employed was a semi-continuous stirred reactor with a volume capacity of 5 liters (as shown in Scheme 2). For each test, the required adsorbent was placed in the reactor. Subsequently, biofuel was introduced continuously through Pump No. 2. During the feeding process, a mechanical stirrer was operated at an appropriate rate to ensure sufficient surface exposure and contact time for dehydration. After 60 minutes, when an equilibrium state was reached, the outlet valve was opened, transferring the biofuel to a trap. The adsorbent was then discharged into a storage tank through the valve at the bottom of the trap. Following the closure of both the discharge and inlet valves, the vacuum pump was activated to establish a vacuum of approximately 20 mL within the reactor. The reactor temperature was elevated to 150 °C using surrounding heaters to regenerate the adsorbent for a period of 30 minutes. It is important to note that Filter No. 7, functioning as a micro-filter, is responsible for separating the adsorbent from the dehydrated biofuel.2.5. Optimization procedure
The initial concentrations of water content concentration, process temperature, and MIL dosage were selected as effective operating parameters. The water loading capacity was also considered as a response for the design. The CCD included three types of points: cubic points, axial points, and central points. These were utilized due to the chosen design approach. In order to determine the Minimum Number of Experiments to optimize (MNE), the following equation can be used:| MNE = 2f + 2f + N0 | (1) |
Water loading capacity (WLC) was used as the response to analyze parametric behaviors. The initial and final water concentrations of the samples were measured using the volumetric Karl-Fisher method which is reliable to a few ppm. The water loading capacity for each test was calculated using eqn (2):
The response variable chosen to analyze the parametric behaviors was the Water Loading Capacity (WLC). Initial and final water concentrations of the samples were determined using the volumetric Karl Fischer method, known for its reliability within a few ppm range. The water loading capacity for each test was computed using eqn (2), where ‘ms’ represents the mass of the solution (kg), Cf and C0 denote the equilibrium and initial water concentrations (mg g−1) in the biofuel, respectively, and mADS signifies the mass of the adsorbent (kg). Table 1 provides an overview of the final design and its associated properties.
 | (2) |
| Run | Initial concentration | Temperature | Dosage | WLC |
|---|---|---|---|---|
| 1 | 1.41 | 313.95 | 0.06 | 850 |
| 2 | 2.59 | 302.05 | 0.14 | 1268 |
| 3 | 2.00 | 308.00 | 0.10 | 1160 |
| 4 | 2.00 | 308.00 | 0.10 | 1140 |
| 5 | 3.00 | 308.00 | 0.10 | 1001 |
| 6 | 2.00 | 298.00 | 0.10 | 1128 |
| 7 | 2.00 | 308.00 | 0.17 | 1198 |
| 8 | 2.59 | 313.95 | 0.06 | 780 |
| 9 | 1.00 | 308.00 | 0.10 | 1196 |
| 10 | 2.00 | 308.00 | 0.03 | 1015 |
| 11 | 2.00 | 318.00 | 0.10 | 790 |
| 12 | 2.00 | 308.00 | 0.10 | 1125 |
| 13 | 1.41 | 313.95 | 0.14 | 955 |
| 14 | 2.59 | 313.95 | 0.14 | 825 |
| 15 | 2.59 | 302.05 | 0.06 | 992 |
| 16 | 1.41 | 302.05 | 0.14 | 1380 |
| 17 | 1.41 | 302.05 | 0.06 | 1100 |
3. Results and discussion
3.1. Characterization
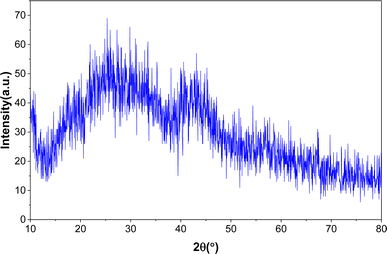
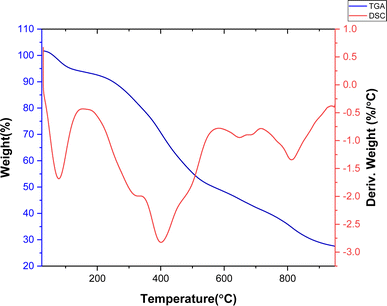
Fig. 1 shows the XRD pattern for the hydrothermally synthesized MIL (Cr)-101. The comparison of the appeared peaks with the reported patterns in the literature24,25 confirmed the successful formation of MIL (Cr)-101. Furthermore, no additional peak was observed, which confirms the purity of the framework.TGA and DSC curves of the synthesized MIL-100(Cr) are presented in Fig. 2. Notably, these curves reveal distinct two-step weight losses occurring within the temperature ranges of 25 to 200 °C and 300 to 500 °C. The first step is related to impurities, volatilization, and solvent molecules.25 The second step, resulting in framework collapse, is related to the ligand pyrolysis of the MOFs. These results are consistent with the thermogravimetric analysis reported in the literature,24 which indicated high thermal stability of MIL-101(Cr). Fig. 2 depicts the DSC curve for the synthesized adsorbent, illustrating the exo/endothermic nature of each stage of weight loss. The DSC profile reveals two endothermic stages attributed to evaporation and decomposition reactions. The results confirm satisfactory thermal stability for MIL-101(Cr) up to 350 °C, with the remaining about 27% of the sample as the final residual at the decomposition stage, which is related to the inorganic component of the sample.
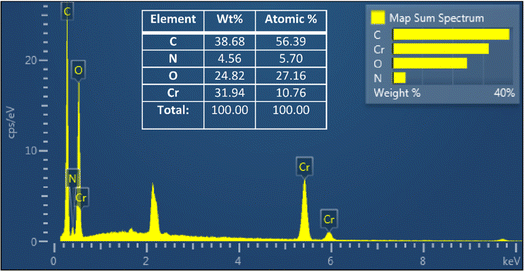
The EDX spectroscopy conducted on MIL-101(Cr) provided valuable insights into its elemental composition, as illustrated in Fig. 3. Analysis of the spectrum revealed the presence of chromium, attributed to the metal oxide clusters within the MOF support. Furthermore, the presence of the H2BDC ligand was confirmed through the detection of characteristic peaks corresponding to carbon, nitrogen, and oxygen. Complementing this spectroscopic analysis, ICP-OES (Inductively Coupled Plasma Optical Emission Spectroscopy) was employed to precisely quantify the chromium content within the sample. The results indicated a chromium concentration of 17.3 wt%, underscoring its significant contribution to the inorganic component. This finding implies that approximately 64.07% of the total inorganic content, as determined by TGA, comprises chromium. Notably, the remaining 35.93% consists predominantly of oxygen, as identified through comprehensive elemental analysis.
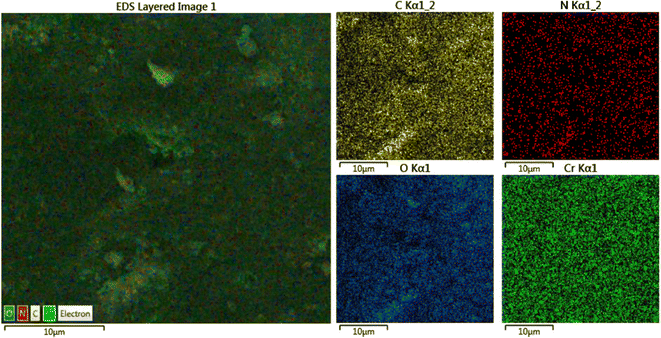
The elemental mapping shows that the C, N, O and Cr, elements are homogeneously spread out in the MIL-101(Cr) matrix (Fig. 4) and proves the successful formation of the target MOF product.
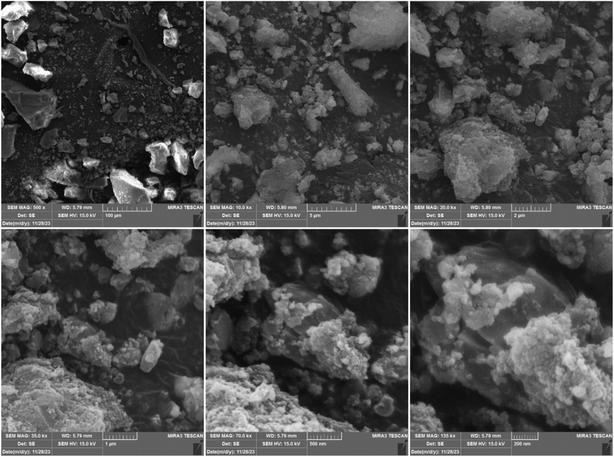
To observe the morphological properties of the synthesized metal–organic framework (MOF), the particles were analyzed using scanning electron microscopy, as shown in Fig. 5. As can be observed, the particles exhibit a uniform structure, indicating the synthesis of MOF with good purity.37
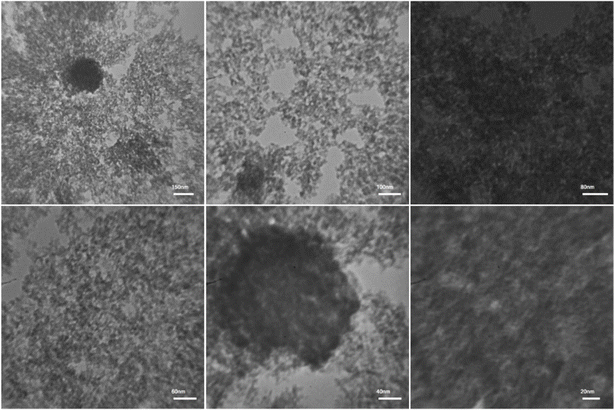
To explore the morphology and particle dimensions of the MIL-101(Cr) metal–organic framework (MOF), we conducted transmission electron microscopy (TEM). The synthesized adsorbent displays remarkable features, showcasing a uniform porous framework characterized by clearly delineated channels. These attributes render MIL-101(Cr) highly suitable for a wide array of applications, spanning adsorption and separation processes, catalysis, and drug delivery. The particle sizes of MIL-101(Cr) were determined to range between 10 and 30 nanometers. Notably, examination of the TEM image reveals the presence of nanocrystals in all three MOFs under study (Fig. 6).
Adsorption and desorption isotherms for MIL-101, along with the results of textural analysis (BET), are shown in Fig. 7 and Table 2, respectively. According to IUPAC rules for isotherm classification, the N2 adsorption–desorption isotherm exhibits Type I isotherms with an H2-type hysteresis loop, indicating the presence of mesoporous cages and microporous windows within this material.
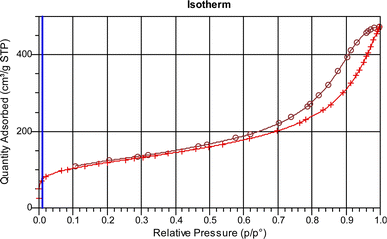 | ||
| Fig. 7 Nitrogen adsorption/desorption curves of the synthesized MIL (Cr)-101 catalyst for biofuel dehydration. | ||
| Characteristic | Value |
|---|---|
| BET surface area (m2 g−1) | 409.81 |
| Pore volume (cm2 g−1) | 0.46 |
| Average pore size (nm) | 1.11 |
3.2. Process optimization
Some parameters, including the initial concentration of the adsorbate, temperature, pressure, pH, types of adsorbents, stirring methodologies, and adsorbent dosage, have been reported in the literature as influential factors in liquid dehydration processes. In this study, utilizing the CCD, the effective parameters were estimated based on the reported data concerning the application of MIL-101 in dehydration processes.25,26 We investigated the effects of the following parameters on the dehydration process: initial concentration of water, temperature, and MIL dosage. The experimental conditions and their corresponding outcomes are presented in Table 3.| Factor | Name | Units | Type | Low actual | High actual | Mean | Std dev. |
|---|---|---|---|---|---|---|---|
| A | Initial con. | wt% | Numeric | 1.41 | 2.59 | 2.00 | 0.53 |
| B | Temperature | K | Numeric | 302.05 | 313.95 | 308.00 | 5.33 |
| C | MIL dosage | — | Numeric | 0.061 | 0.14 | 0.10 | 0.04 |
Under different operational conditions, seventeen experiments were conducted to assess data reproducibility and experimental errors. The water loading capacity was calculated for each test. Upon introducing the responses into the software, it was determined that the process’s behavioral variation could be predicted using a quadratic equation as follows:
| WLC = 1143.64 − 54.77 × A − 139.01 × B + 74.23 × C − 60.75 × B × C − 22.06 × A2 − 71.38 × B2 − 19.27 × C2 |
Variance analysis was performed to examine the individual interactions as well as the quadratic effects of the variables influencing water loading capacity during biofuel dehydration. In order to minimize the total error and validate the model under real conditions, terms with a ‘Prob > F’ (p-value) of less than 0.05 were retained in the final equation, while terms with values exceeding 0.30 were excluded. Concerning the reduction of the quadratic equation, it has been demonstrated that the essential terms—namely, A, B, C, BC, A2, B2, and C2—should be retained, while the less significant ones can be omitted. The variance analysis of the reduced quadratic model is presented in Table 4.
| Source | Sum of squares | df | Mean square | F-Value | p-Value prob > F | |
|---|---|---|---|---|---|---|
| Model | 458![[thin space (1/6-em)]](https://www.rsc.org/images/entities/char_2009.gif) 239.40 239.40 |
7 | 65![[thin space (1/6-em)]](https://www.rsc.org/images/entities/char_2009.gif) 462.77 462.77 |
25.85 | <0.0001 | Significant |
| A-Initial con. | 40![[thin space (1/6-em)]](https://www.rsc.org/images/entities/char_2009.gif) 963.21 963.21 |
1 | 40![[thin space (1/6-em)]](https://www.rsc.org/images/entities/char_2009.gif) 963.21 963.21 |
16.17 | 0.0030 | |
| B-Temperature | 263![[thin space (1/6-em)]](https://www.rsc.org/images/entities/char_2009.gif) 903.90 903.90 |
1 | 263![[thin space (1/6-em)]](https://www.rsc.org/images/entities/char_2009.gif) 903.90 903.90 |
104.22 | <0.0001 | |
| C-Dosage | 75![[thin space (1/6-em)]](https://www.rsc.org/images/entities/char_2009.gif) 253.47 253.47 |
1 | 75![[thin space (1/6-em)]](https://www.rsc.org/images/entities/char_2009.gif) 253.47 253.47 |
29.72 | 0.0004 | |
| BC | 20![[thin space (1/6-em)]](https://www.rsc.org/images/entities/char_2009.gif) 604.50 604.50 |
1 | 20![[thin space (1/6-em)]](https://www.rsc.org/images/entities/char_2009.gif) 604.50 604.50 |
8.13 | 0.0190 | |
| A 2 | 5488.02 | 1 | 5488.02 | 2.16 | 0.1750 | |
| B 2 | 57![[thin space (1/6-em)]](https://www.rsc.org/images/entities/char_2009.gif) 446.44 446.44 |
1 | 57![[thin space (1/6-em)]](https://www.rsc.org/images/entities/char_2009.gif) 446.44 446.44 |
22.68 | 0.0010 | |
| C 2 | 4171.15 | 1 | 4171.15 | 1.64 | 0.2314 | |
| Residual | 22![[thin space (1/6-em)]](https://www.rsc.org/images/entities/char_2009.gif) 788.37 788.37 |
9 | 2532.04 | |||
| Lack of fit | 22![[thin space (1/6-em)]](https://www.rsc.org/images/entities/char_2009.gif) 171.71 171.71 |
7 | 3167.38 | 10.27 | 0.0916 | Not significant |
| Pure error | 616.66 | 2 | 308.33 | |||
| Cor total | 481![[thin space (1/6-em)]](https://www.rsc.org/images/entities/char_2009.gif) 027.80 027.80 |
16 |
As an index, the F-value evaluates the effective role of the factors for process optimization. In this context, the magnitude of the F-value indicates that temperature has the greatest effect, with a value of 104.22. The second most influential parameter is MIL dosage, with a value of 29.72. Although the initial concentration was ranked third, its high F-value (16.70) underscores its significant impact on the dehydration process. The F-value and P-value (25.85 and < 0.0001, respectively) demonstrate the reliability and stability of the model in predicting behavior. The interaction effect between the temperature and MIL dosage also exhibits a notable F-value of 8.13, whereas the interactions involving other factors were disregarded due to their high P-values and low F-values. The appearance of the phrase ‘Not significant’ for the Lack of Fit term (which is desirable for ANOVA) indicates the model’s ability to predict process behavior accurately.38
Table 5 presents the regression coefficients of the reduced model proposed by ANOVA. R2 and R2-adj are indices that measure the correlation between the predicted and experimental data. Approaching their values to unity indicates that ANOVA can effectively explain the relationship between independent variables and responses.39 The obtained R2 and R2-adj values for the model were 95.26 and 91.57, respectively.
| R 2 | 95.26 | Std dev. | 50.32 |
| R 2-adj | 91.57 | Mean | 1053.12 |
| Pred R-squared | 76.89 | C.V.% | 4.78 |
| Adeq precision | 18.59 | PRESS | 111![[thin space (1/6-em)]](https://www.rsc.org/images/entities/char_2009.gif) 124.3 124.3 |
Unfortunately, the R2 value always increases when the number of included terms in the model increases. Consequently, it is crucial to consider variables that genuinely contribute to or play a significant role in the model. The use of this index can run counter to the parsimony principle, which encourages minimizing the number of parameters. Instead, considering the adjusted coefficient of determination (R2-adj) statistic as an index can address this issue. Generally, the addition of variables to the model will not always result in an increase in R2-adj.40 The R2-adj value approaches unity, confirming the reliability of the model. The optimized condition is achieved using the software, with values and responses adjusted within the specified ranges. The maximum adsorption capacity (1349.72) was predicted at an initial water concentration of 1.41 wt%, an adsorbent dosage of 0.14, and a temperature of 302.8 K, with a desirability score of 0.95.
The software utilized displays interactions between two independent variables using a three-dimensional graph while keeping other variables constant. The interactions between the initial concentration of water and temperature (with the assumed dosage held constant at its optimum level) in the biofuel dehydration process using synthesized MIL-101(Cr) are depicted in Fig. 6. The graph illustrates that the desired temperature range for the dehydration process is 273 to 283 K; increases beyond this range would lead to a decrease in the process efficiency. This phenomenon can be attributed to the thermodynamic equilibrium state between adsorbate–adsorbent-solution elements at higher temperatures, which results in the desorption of adsorbate molecules. Consequently, the adsorption capacity of MIL for water and dehydration efficiency decreases. Moreover, the substantial impact of a 10° temperature increase from ambient temperature confirms the significance of this parameter in the proposed model. In other words, this increase enhances mobility and accelerates the diffusion of adsorbate molecules to the adsorbent surface.
As indicated in Fig. 8, when the temperature is maintained at the optimum level, it can be observed that increasing the initial concentration leads to decreased efficiency with a moderate slope, signifying the highest water adsorption capacity of this adsorbent. This decrease in efficiency can be attributed to an increase in the ratio of adsorbate molecules to the total number of active sites on the MIL-101 surface, causing the required time for the adsorbate molecules to occupy the active sites to increase.
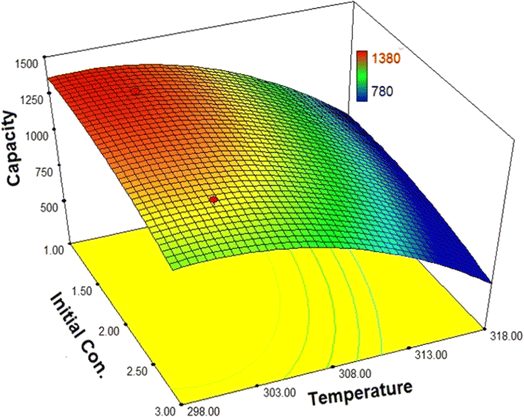 | ||
| Fig. 8 The interactions between the initial concentration of water and temperature in the biofuel dehydration process. | ||
Fig. 9 illustrates the interaction between MIL-101(Cr) and temperature in the dehydration process. As is evident, increasing the dosage leads to an increase in the adsorption capacity. Consequently, the total number of active sites available for adsorption also increases, while the total number of adsorbate molecules remains constant. This, in turn, highlights that the adsorption capacity experiences an increase.
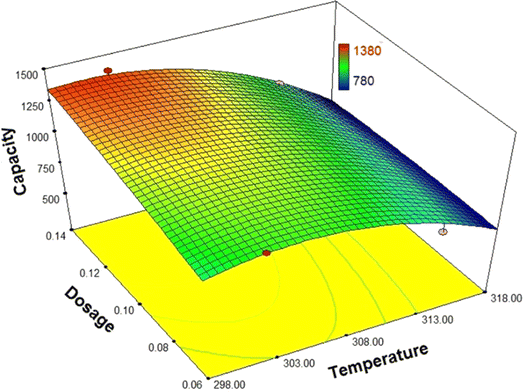 | ||
| Fig. 9 The interactions between MIL-101(Cr) dosage and temperature on the biofuel dehydration process. | ||
Fig. 10 depicts the interactions between MIL (Cr)-101 dosage and the initial concentration of the pollutant (water). As can be observed, the adsorption capacity approaches its maximum when the dosage is at its lowest level and the initial concentration is at its highest level. In other words, when the total number of pollutant molecules remains constant, an increase in dosage leads to an increase in the total number of active and available sites for adsorption. Consequently, the required time to reach equilibrium decreases, resulting in an increased capacity.
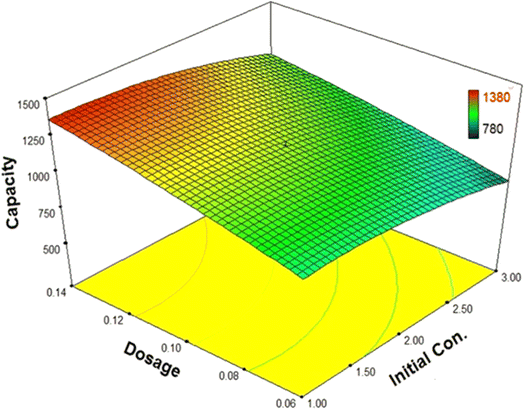 | ||
| Fig. 10 The interactions between MIL-101(Cr) dosage and initial concentration of water in the biofuel dehydration process. | ||
Furthermore, it is evident that by increasing the initial concentration of water, the capacity experiences a significant decrease (when the dosage is at a low amount) or a smoother decrease (when the dosage is at a high amount). These variations validate the effectiveness of the adsorbent surface and the number of active sites during the adsorption process. However, when considering the proposed model, the interactions between MIL (Cr)-101 dosage and the initial concentration of the pollutant (water) are shown to be very low and negligible. In reality, this assumption cannot hold true, indicating the software’s inability to predict the behavior of this complex process with adequate accuracy.
4. Conclusions
In this research, the MIL (Cr)-101 adsorbent was synthesized using the hydrothermal method for biofuel dehydration. The synthesized adsorbent properties were characterized using XRD, adsorption/desorption, BET, and TGA/DSC. The results confirm the successful synthesis of MIL (Cr)-101. Moreover, the CCD and variance analysis were employed to optimize the effective parameters and describe their behavior in the dehydration process. Initial concentrations of water, temperature, and MIL (Cr)-101 dosage were selected as effective parameters. Their ranges were experimentally determined and introduced to the software to propose an appropriate design (17 experiments). A reduced equation was formulated to predict and simulate the system’s behavior under different conditions. The high values of the correlation coefficients indicate that the model can successfully predict the relationships between actual and predicted results. The maximum adsorption capacity (1349.72 mg g−1) was predicted with an initial water concentration of 1.41 wt%, an adsorbent dosage of 0.14, and a temperature of 302.8 K, with a desirability of 0.95. This demonstrates the need for successful project implementation on a larger scale, specifically for feed dilution or recycling stages.Data availability
All data and materials in this publication are available by contacting the corresponding author.Author contributions
Parya Parak (the PhD student) performed most of the practical laboratory work as part of her PhD thesis supervised by Dr Ahmad Nikseresht. Ahmad Nikseresht (supervisor, PhD) designed and coordinated the study, software, conceptualization, and edited the final version and submitted the manuscript for publication. Masoud Mohammadi (PhD) contributed to the conceptualization, software, writing, review, and editing of manuscript draft. Mohammad Saeid Emaminia contributed to the software.Conflicts of interest
The authors declare that they have no known competing financial interests or personal relationships that could have appeared to influence the work reported in this paper.Acknowledgements
This work was financially supported by the Payame Noor University, Tehran, Iran.References
- R. S. Norhasyima and T. M. I. Mahlia, J. CO2 Util., 2018, 26, 323–335 CrossRef CAS.
- N. Damanik, H. C. Ong, C. W. Tong, T. M. I. Mahlia and A. S. Silitonga, Environ. Sci. Pollut. Res., 2018, 25, 15307–15325 CrossRef CAS PubMed.
- A. S. Silitonga, H. H. Masjuki, T. M. I. Mahlia, H. C. Ong and W. T. Chong, Energy Convers. Manage., 2013, 76, 828–836 CrossRef CAS.
- M. Sadidi, N. Hajilary and F. Abbasi, J. Environ. Chem. Eng., 2023, 11, 110946 CrossRef CAS.
- E. Quiroga, N. García, B. Cifuentes, R. Cogua, J. Becerra, J. M. Berenguer and M. Cobo, J. Environ. Chem. Eng., 2024, 12, 111803 CrossRef CAS.
- P. Suchamalawong, S. Pengnarapat, P. Reubroycharoen and T. Vitidsant, J. Environ. Chem. Eng., 2019, 7, 103155 CrossRef CAS.
- A. E. Atabani, A. S. Silitonga, I. A. Badruddin, T. M. I. Mahlia, H. H. Masjuki and S. Mekhilef, Renewable Sustainable Energy Rev., 2012, 16, 2070–2093 CrossRef.
- S. Tie, B. Sreedhar, M. Donaldson, T. Frank, A. K. Schultz, A. S. Bommarius and Y. Kawajiri, Adsorption, 2019, 25, 795–807 CrossRef CAS.
- A. Lotfollahzade Moghaddam and M. J. Hazlett, J. Environ. Chem. Eng., 2023, 11, 110307 CrossRef CAS.
- F. Ma and M. A. Hanna, Bioresour. Technol., 1999, 70, 1–15 CrossRef CAS.
- S. G. Pakdehi, S. Babaee and H. R. Azizi, Bull. Chem. Soc. Jpn., 2017, 90, 1325–1332 CrossRef CAS.
- M. N. Goda, A. E.-A. A. Said and H. N. Abdelhamid, J. Environ. Chem. Eng., 2021, 9, 106336 CrossRef CAS.
- N. Hanchate, P. Kulshreshtha and C. S. Mathpati, J. Environ. Chem. Eng., 2019, 7, 102938 CrossRef CAS.
- W. Raza, J. Yang, J. Wang, H. Saulat, G. He, J. Lu and Y. Zhang, Sep. Purif. Technol., 2020, 235, 116102 CrossRef CAS.
- S.-Y. Lin, H.-L. Lin and M.-J. Li, Adsorption, 2002, 8, 197–202 CrossRef CAS.
- S. Karimi, M. Tavakkoli Yaraki and R. R. Karri, Renewable Sustainable Energy Rev., 2019, 107, 535–553 CrossRef CAS.
- S. Ghorbani, D. Habibi, S. Heydari, M. Mohammadi and M. Ariannezhad, Environ. Sci. Pollut. Res., 2022, 30, 32762–32775 CrossRef PubMed.
- Ş. Yılmaz, A. Zengin, T. Şahan and İ. H. Gübbük, J. Polym. Environ., 2023, 31, 36–49 CrossRef.
- Ş. Yılmaz, A. Zengin and T. Şahan, Colloids Surf., A, 2020, 601, 125041 CrossRef.
- Ü. Ecer, Ş. Yılmaz and T. Şahan, Int. J. Environ. Anal. Chem., 2022, 102, 7779–7799 CrossRef.
- S. Sadighi, M. S. Alivand and M. Faghihi, Pet. Coal, 2019, 61, 932–948 Search PubMed.
- S. Bhattacharjee, C. Chen and W.-S. Ahn, RSC Adv., 2014, 4, 52500–52525 RSC.
- F. Yulia, A. Zulys and R. Ruliandini, J. Adv. Res. Fluid Mech. Therm. Sci., 2019, 57, 158–174 Search PubMed.
- Z. Noorpoor, S. G. Pakdehi and A. Rashidi, Adsorption, 2017, 23, 743–752 CrossRef CAS.
- H. M. Gobara, R. S. Mohamed, S. A. Hassan, F. H. Khalil and M. S. El-Sall, Catal. Lett., 2016, 146, 1875–1885 CrossRef CAS.
- M. Suresh, B. David Raju, K. S. Rama Rao, K. Raveendranath Reddy, M. L. Kantam and P. Srinivasu, J. Chem. Sci., 2014, 126, 527–532 CrossRef CAS.
- Ş. Yılmaz and T. Şahan, Biomass Convers. Biorefin., 2023, 13, 2469–2486 CrossRef.
- Ü. Ecer, Ş. Yılmaz and T. Şahan, Chem. Phys. Lett., 2023, 825, 140610 CrossRef.
- Ş. Yılmaz, A. Zengin, T. Şahan and Ö. S. Zorer, Environ. Technol. Innovation, 2021, 23, 101631 CrossRef.
- A. Nikseresht, A. Daniyali, M. Ali-Mohammadi, A. Afzalinia and A. Mirzaie, Ultrason. Sonochem., 2017, 37, 203–207 CrossRef CAS PubMed.
- A. Afzalinia, A. Mirzaie, A. Nikseresht and T. Musabeygi, Ultrason. Sonochem., 2017, 34, 713–720 CrossRef CAS PubMed.
- A. Nikseresht, S. Ghasemi and S. Parak, Polyhedron, 2018, 151, 112–117 CrossRef CAS.
- S. Ghasemi, M. Yousefi, A. Nikseresht and H. Omidi, Process Biochem., 2021, 102, 92–101 CrossRef CAS.
- H. Veisi, A. Nikseresht, N. Ahmadi, K. Khosravi and F. Saeidifar, Polyhedron, 2019, 162, 240–244 CrossRef CAS.
- H. Veisi, A. Nikseresht, S. Mohammadi and S. Hemmati, Chin. J. Catal., 2018, 39, 1044–1050 CrossRef CAS.
- H. Veisi, A. Nikseresht, A. Rostami and S. Hemmati, Res. Chem. Intermed., 2019, 45, 507–520 CrossRef CAS.
- G. Férey, C. Mellot-Draznieks, C. Serre, F. Millange, J. Dutour, S. Surblé and I. Margiolaki, Science, 2005, 309, 2040–2042 CrossRef PubMed.
- A. R. Zarei, H. Rezaeivahidian and A. R. Soleymani, Process Saf. Environ. Prot., 2015, 98, 109–115 CrossRef CAS.
- U. K. Garg, M. P. Kaur, V. K. Garg and D. Sud, Bioresour. Technol., 2008, 99, 1325–1331 CrossRef CAS PubMed.
- S. Benredouane, T. Berrama and N. Doufene, Chemom. Intell. Lab. Syst., 2016, 155, 128–137 CrossRef CAS.
| This journal is © The Royal Society of Chemistry 2024 |

